
Every facility that moves fluid — whether chilled water through an air handling unit or sulfuric acid through a reactor feed line — depends on flow monitors to operate safely, efficiently, and within regulatory boundaries. But the term “flow monitor” covers an enormous range of instruments, from a $400 insertion sensor in an HVAC duct to a $25,000 Coriolis mass meter on a custody transfer line. Choosing between an HVAC-focused and a process-focused flow monitor is not a catalog exercise; it is a decision rooted in what happens when the measurement is wrong.
In HVAC applications, a 5% flow measurement error on a chilled water loop translates to overcooled or undercooled zones, wasted pump energy, and tenant comfort complaints — problems measured in dollars per square foot per year. In process industries, a 5% error on a chemical dosing line can mean off-spec product batches worth $50,000–$500,000, environmental permit violations, or — in the worst case — a thermal runaway event that threatens personnel safety.
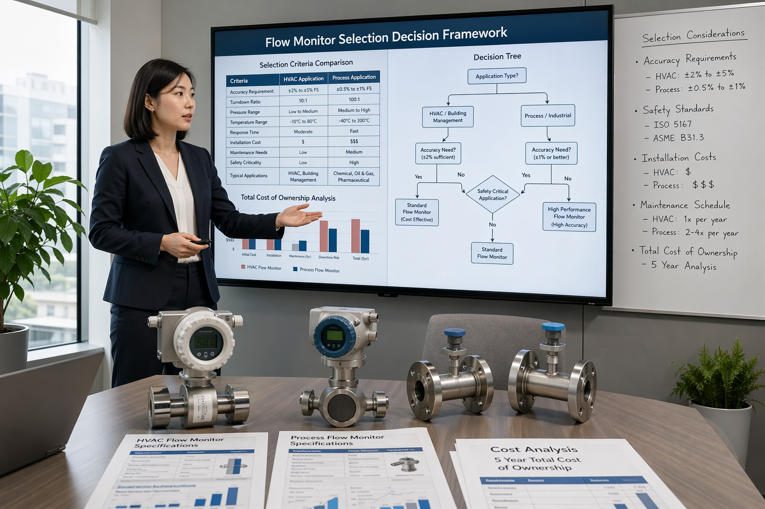
This guide defines the decision framework for selecting between HVAC-grade and process-grade flow monitoring technologies. It covers the four pillars that drive every selection: energy efficiency (the primary mandate in HVAC), safety (the non-negotiable in process environments), compliance (standards from ASHRAE to IEC to ISA that constrain your choices), and reliability (because a meter that drifts undetected for 18 months delivers false confidence, not real measurement). The subsequent sections walk through fluid types, accuracy requirements, available technologies, installation realities, maintenance economics, compliance standards, total cost of ownership, and a structured decision framework — with data tables, charts, and case studies you can apply directly to your next specification.
Understanding the Scope: HVAC vs. Process Industries

Core Monitoring Objectives in HVAC Systems
HVAC flow monitoring serves three interconnected objectives: energy optimization, occupant comfort, and code compliance. A commercial chiller plant serving a 500,000 sq ft office campus typically circulates 2,000–4,000 GPM of chilled water through primary and secondary loops. Flow monitors on these loops enable demand-based pump control — when the building load drops to 40% on a mild spring day, the BMS reduces pump speed based on real-time flow data rather than running at full capacity. A Southeastern U.S. university documented $20,000 per month in energy savings after installing permanent flow meters on their chilled water distribution system and implementing flow-based optimization algorithms.
The fluids in HVAC are comparatively benign: treated water, water-glycol mixtures (typically 20–40% propylene glycol), steam condensate, and conditioned air. Temperatures range from 35°F (chilled water supply) to 200°F (heating hot water), with pressures rarely exceeding 150 psig. Chemical compatibility is seldom the primary concern — most standard flow meter materials (brass, 316SS, PVC) handle HVAC fluids without issue. The real engineering challenge is achieving accurate measurement at the low flow velocities common during part-load operation, when many meters fall below their minimum accuracy threshold.
Core Monitoring Objectives in Process Industries
Process industry flow monitoring adds layers of complexity that HVAC engineers rarely encounter. The objectives expand beyond energy efficiency to include batch accuracy, reaction stoichiometry control, safety instrumented system (SIS) input, environmental emissions tracking, and custody transfer accounting. A petrochemical plant’s ethylene cracking unit may have 200+ flow measurement points, each with different fluid properties, accuracy requirements, and safety classifications.
Process fluids range from deionized water to concentrated acids, cryogenic liquefied gases, abrasive slurries, high-viscosity polymers, and multi-phase streams containing both liquid and entrained gas. Temperatures span from -320°F (LNG) to 1,000°F+ (molten sulfur), and pressures can exceed 6,000 psig in high-pressure reactor systems. Material compatibility becomes a make-or-break selection criterion: a flow meter that performs flawlessly on water may corrode within weeks on a 37% hydrochloric acid line if the wrong wetted materials are specified.
When Cross-Over Monitoring Matters
The HVAC/process boundary is not always clean. Pharmaceutical manufacturing facilities require HVAC-grade airflow monitoring that meets process-grade accuracy and documentation standards — the air handling units serving a fill-finish cleanroom must maintain ISO Class 5 particle counts, demanding ±3–5% airflow accuracy with full calibration traceability. Data centers use chilled water systems that resemble commercial HVAC but operate at process-level criticality — a 15-minute cooling failure can destroy $2M+ in server hardware. Food and beverage plants run glycol-based cooling loops that are HVAC in topology but process-critical in consequence, where flow measurement accuracy directly impacts product quality and food safety compliance.
In these cross-over applications, selecting an HVAC-grade meter to save $2,000 on purchase price can create $200,000 in risk exposure. The decision framework in this guide helps identify exactly where the boundary lies for your specific facility.
Key Differences in Flow Monitoring Requirements
Fluid Types, Viscosities, and Temperature Ranges
Table 1: Fluid Property Comparison — HVAC vs. Process Applications
| Parameter | Typical HVAC | Typical Process |
|---|---|---|
| Fluid types | Water, water-glycol, steam condensate, air | Acids, bases, solvents, slurries, cryogenics, hydrocarbons, multi-phase |
| Viscosity range | 0.3–5 cSt | 0.1–100,000+ cSt |
| Temperature range | 35°F to 200°F (-1°C to 93°C) | -320°F to 1,000°F+ (-196°C to 538°C+) |
| Pressure range | 0–150 psig | Vacuum to 6,000+ psig |
| Conductivity (if relevant) | >50 µS/cm (treated water) | 0 to >100,000 µS/cm (varies by fluid) |
| Corrosion risk | Low (treated systems) | High (acids, caustics, chlorinated solvents) |
| Solids content | Minimal (filtered systems) | 0–60% by weight (slurries, ore processing) |
These property differences fundamentally shape meter selection. An electromagnetic flow meter running on treated chilled water at 45°F requires standard PTFE liner and 316SS electrodes — a $1,500–$3,000 instrument. The same measurement principle applied to 98% sulfuric acid at 180°F demands PFA liner, platinum electrodes, and Hastelloy process connections — a $6,000–$12,000 instrument. The measurement technology is identical; the application environment drives a 3–4× cost multiplier.
Accuracy, Repeatability, and Response Time Expectations
HVAC flow monitoring typically requires ±2–5% of reading accuracy. The building energy model that justified the chiller plant upgrade was built with ±10% flow assumptions — achieving ±3% in the field exceeds the engineering basis. Response time requirements are lenient: HVAC control loops operate on minute-scale time constants, so a meter that updates every 2–5 seconds is perfectly adequate.
Process applications frequently demand ±0.2–1.0% of reading accuracy, with repeatability specifications of ±0.05–0.1%. A batch chemical reactor adding 500 kg of reagent at ±0.5% accuracy controls dosing to ±2.5 kg — acceptable for most reactions. At ±2% accuracy (an HVAC-grade spec), dosing uncertainty reaches ±10 kg, potentially shifting product yield or triggering an exothermic excursion. Response time in process applications can be critical: a safety shutdown on a runaway reaction may require sub-second flow detection to initiate emergency cooling, mandating meters with <500 ms response.
Environmental and Installation Constraints
HVAC meter installations typically occur in mechanical rooms, ceiling plenums, and pipe chases — indoor, temperature-controlled environments with convenient electrical power and BMS network connectivity. The installation challenge is usually space: fitting the meter and its required straight-run pipe lengths into congested mechanical rooms designed before metering was specified.
Process installations face outdoor exposure (desert heat, Arctic cold, tropical humidity), hazardous area classifications (ATEX Zone 1, Class I Division 1), vibration from rotating equipment, corrosive atmospheres that attack enclosures and cable glands, and access restrictions that make routine maintenance a multi-permit, multi-person operation. A properly planned installation accounts for all of these constraints before the meter is ordered — not after it arrives on site.
Available Flow Measurement Technologies
Differential Pressure (DP) Meters and Orifice Plates
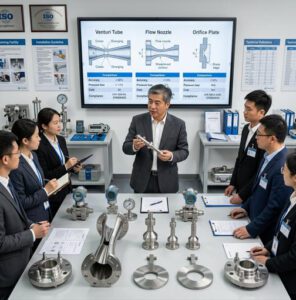
DP flow measurement is the oldest and most widely installed flow technology globally, accounting for approximately 21% of all flow meter installations according to Fortune Business Insights’ 2025 market analysis. The principle is straightforward: a restriction in the pipe (orifice plate, Venturi tube, flow nozzle, or wedge element) creates a pressure differential proportional to the square of the flow velocity. An adjacent DP transmitter measures this differential and calculates flow rate.
In HVAC, DP elements appear primarily in large chilled water plants where historical design practice established orifice plates as the baseline measurement method. In process industries, orifice plates dominate steam measurement and remain prevalent in refinery and petrochemical gas measurement, partly because of extensive API and ISO standardization (ISO 5167) that enables “no-calibration” installations based on published discharge coefficients.
The limitations are well-documented: orifice plates create significant permanent pressure loss (40–70% of the measured DP is not recovered), their accuracy degrades as the plate edge erodes, and their turndown ratio is limited to 3:1–5:1 — inadequate for systems that modulate over wide load ranges. A 10-inch orifice plate on a continuous chilled water loop can consume $3,000–$8,000/year in additional pump energy compared to a low-ΔP alternative.
Ultrasonic and Coriolis Flow Meters
Ultrasonic flow meters use transit-time or Doppler techniques to measure flow velocity without obstructing the pipe. Transit-time models achieve ±0.5–1.0% accuracy on clean liquids and are increasingly used in both HVAC chilled water systems (where clamp-on installation avoids pipe cutting) and process applications (where inline multi-path designs serve custody transfer). Jade Ant Instruments’ ultrasonic vs. magnetic comparison details the accuracy trade-offs between clamp-on and wetted-transducer configurations for different fluid types.
Coriolis mass flow meters directly measure mass flow and fluid density by detecting the phase shift in vibrating tubes through which the fluid passes. With accuracy specifications of ±0.1–0.5% of reading and simultaneous density measurement, Coriolis meters are the gold standard for custody transfer, batch dosing, and any application where mass — not volume — is the controlled variable. Their limitation is size and cost: a 6-inch Coriolis meter can weigh over 500 lbs and cost $15,000–$30,000, making them impractical for large-diameter HVAC mains. Current Coriolis technology comparisons show that the technology continues to expand into larger line sizes, with some manufacturers now offering 12-inch models.
Mass Flow and Thermal Dispersion Options
Thermal mass flow meters measure the rate of heat transfer from a heated sensor to the flowing fluid — a measurement directly proportional to mass flow rate. In HVAC, thermal dispersion meters are the preferred technology for duct airflow measurement, offering 100:1 turndown ratios that track variable-air-volume systems from full load down to 10% capacity. Jade Ant Instruments’ thermal mass flow meter line is engineered for both HVAC air measurement and industrial gas applications (compressed air, nitrogen, biogas), delivering direct mass flow readings without separate pressure and temperature compensation.
In process service, thermal meters excel on gas measurement where composition is known and stable. They are less suited to liquid measurement and lose accuracy when gas composition varies — a landfill gas application with 45–55% methane content variation can see ±8–12% reading shifts unless the meter has multi-gas compensation algorithms.

HVAC-Focused Monitoring Considerations
Airflow versus Water/Glycol in HVAC Loops
HVAC systems present two distinct flow measurement challenges that require different technologies. Airflow measurement in ductwork — for outdoor air verification, VAV system balancing, and demand-controlled ventilation — operates at low velocities (500–2,500 fpm), low pressures (near-atmospheric), and clean conditions. Thermal dispersion probes and averaging pitot arrays are the dominant technologies, with thermal probes increasingly preferred due to their 100:1 turndown ratio that tracks VAV systems through their full modulation range.
Hydronic (water/glycol) measurement in chilled water, heating hot water, and condenser water loops presents different requirements: higher accuracy (±1–3% to validate energy performance), compatibility with glycol concentrations up to 50%, and operation at velocities of 3–10 ft/s in 2–24 inch pipes. Electromagnetic flow meters are the most common choice for hydronic HVAC, offering ±0.5% accuracy, no pressure drop, and immunity to glycol concentration changes. Ultrasonic clamp-on meters are gaining adoption for retrofit applications where cutting into existing pipes would require system draindown and shutdown.
Energy Efficiency and Demand-Based Control
Flow monitoring enables the single largest energy optimization opportunity in commercial HVAC: demand-based pump and fan control. The U.S. Department of Energy estimates that HVAC systems account for approximately 40% of commercial building energy consumption, and that pump and fan energy can be reduced 20–50% through variable-speed operation controlled by actual flow demand rather than fixed-speed operation designed for peak conditions.
A 300,000 sq ft hospital in the Midwest installed electromagnetic flow meters on primary and secondary chilled water loops feeding the BMS. The control algorithm reduced secondary pump speed when measured flow exceeded the calculated building load requirement. Results over 12 months: 22% reduction in chilled water pump energy consumption, $47,000 annual savings, and improved zone temperature control as bypass flow was eliminated. The total metering investment — eight electromagnetic meters plus installation and BMS integration — was $34,000, achieving simple payback in 8.7 months.
Chart 1: Documented Energy Savings from Flow-Based HVAC Optimization (Selected Case Studies)
Annual HVAC Energy Cost Savings After Flow Monitor Implementation
University Campus (SE US)
Hospital (Midwest US)
Corporate Campus (Denver)
Data Center (NE US)
Office Tower (Singapore)
Sources: Badger Meter case study, ENERGY STAR cooling system ROI report, Jade Ant Instruments project documentation, published engineering conference papers.
Process Industry Considerations
Chemical Compatibility and Hazardous Environments
Material selection errors account for approximately 30% of premature flow meter failures in chemical process service, based on warranty return data compiled by multiple manufacturers. The wetted materials — liner, electrodes, gaskets, sensor housing — must withstand the process fluid at its worst-case concentration and temperature, not just nominal conditions. A flow meter specified for 20% sodium hydroxide at 25°C may fail catastrophically when a batch preparation error temporarily exposes it to 50% NaOH at 80°C.
For aggressive chemicals, the available material options vary by technology. Electromagnetic meters offer the widest liner/electrode material selection: PTFE and PFA liners handle virtually all acids and bases below 180°C, while ceramic liners extend to abrasive slurries. Hastelloy B, Hastelloy C, tantalum, and platinum electrodes address specific corrosion profiles. Ultrasonic clamp-on meters avoid the compatibility question entirely for the meter — but the pipe itself must be compatible, and acoustic coupling through exotic alloy pipe walls (Hastelloy, Inconel, titanium) requires specialized transducers and calibration. Jade Ant Instruments’ electromagnetic flow meter product line provides 12 liner/electrode combinations to address the chemical compatibility matrix across acids, bases, solvents, and abrasive media.
Throughput Stability and Process Control Loops
In continuous process operations, the flow meter is not a passive observer — it is an active input to PID control loops that regulate reactor feed rates, distillation reflux ratios, heat exchanger approach temperatures, and blending proportions. The meter’s repeatability and response time directly affect loop stability. A meter with ±0.1% repeatability but 5-second response time will cause a fast PID loop to oscillate; a meter with 200 ms response but ±1% repeatability will produce noisy control output that whips the final control element.
For critical control loops, process engineers specify Coriolis meters (±0.05% repeatability, 50–100 ms response) or electromagnetic meters (±0.1% repeatability, 100–500 ms response depending on excitation frequency). Vortex meters offer excellent repeatability (±0.1%) but their minimum Reynolds number requirement can cause signal dropout during low-flow transients — a characteristic that destabilizes control loops if not properly configured with a low-flow cutoff.
Installation, Maintenance, and Reliability
Sensor Placement, Piping Geometry, and Leak Risk
Installation quality determines 60–70% of a flow meter’s real-world accuracy, regardless of its laboratory specification. Both HVAC and process installations must address straight-run requirements, but the consequences of non-compliance differ dramatically. An HVAC electromagnetic meter installed 3 pipe diameters downstream of an elbow (instead of the recommended 5D) may read 2–3% off-spec — a tolerable error for energy monitoring. The same installation deficiency on a process custody transfer meter creates a systematic billing error that compounds into thousands of dollars per month.
Table 2: Installation Requirements by Technology and Application
| Technology | Upstream Straight Run | Downstream Straight Run | Typical HVAC Install Time | Typical Process Install Time |
|---|---|---|---|---|
| Electromagnetic | 5D | 3D | 2–4 hours | 4–8 hours (incl. permits) |
| Ultrasonic (clamp-on) | 10D | 5D | 1–2 hours | 2–4 hours |
| Ultrasonic (inline) | 10–20D | 5D | 3–5 hours | 6–10 hours |
| Coriolis | 0D (self-conditioning) | 0D | 3–5 hours | 6–12 hours (weight support) |
| Vortex | 15–20D | 5D | 3–5 hours | 5–8 hours |
| DP (orifice plate) | 20–40D | 5–7D | 4–6 hours | 8–16 hours (impulse lines) |
| Thermal mass | 10–15D | 5D | 1–3 hours (insertion) | 3–6 hours |
D = pipe diameters. Process install times include safety permitting, line isolation, and decontamination procedures that HVAC installations typically do not require.
Calibration, Diagnostics, and Remote Monitoring
HVAC flow meters are typically calibrated at commissioning and then verified annually or biennially — if at all. Industry surveys suggest that fewer than 40% of HVAC flow meters receive any post-commissioning calibration within their first five years of operation. This gap is not negligence; it reflects the economic reality that pulling a 6-inch electromagnetic meter from a chilled water loop for bench calibration requires system draindown, a $1,500–$3,000 calibration lab fee, and 8–16 hours of maintenance labor — a $4,000–$7,000 total cost that is hard to justify when the meter’s energy monitoring function tolerates ±5% accuracy.
Process flow meters operate under stricter calibration regimes. Fluke’s calibration best practices emphasize that calibration intervals should be driven by criticality analysis and historical drift data. Custody transfer meters may require quarterly proving against a master meter. SIS-rated meters (SIL 2 or SIL 3) have mandatory proof-test intervals defined by the safety integrity level calculation. Environmental reporting meters must maintain ISO/IEC 17025-traceable calibration records for regulatory audit.
Modern meters from manufacturers like Jade Ant Instruments address the calibration burden with built-in diagnostic capabilities: electrode impedance monitoring (detecting coating buildup on electromagnetic meters), signal quality trending (predicting ultrasonic transducer degradation), and coil drive current monitoring (verifying excitation stability). These diagnostics enable condition-based calibration — verifying meter health remotely through HART or Modbus and scheduling physical calibration only when diagnostics indicate drift, rather than on a fixed calendar.
Compliance, Standards, and Safety
Industry Standards (ISO, ISA, NEC) Relevant to Flow Monitoring
The standards landscape differs significantly between HVAC and process applications, and selecting a meter without understanding the applicable standards creates compliance risk that procurement may not discover until audit time.
HVAC-relevant standards: ASHRAE 62.1 (minimum ventilation rates — requires permanent airflow measurement on outdoor air intakes serving 25+ occupants), ASHRAE 90.1 (energy efficiency — credits flow-based optimization), ASHRAE 111 (testing, adjusting, and balancing), and LEED v4.1 EQ prerequisites for outdoor air delivery monitoring.
Process-relevant standards: ISO 5167 (DP flow element geometry and installation), IEC 61508/61511 (functional safety and SIL rating for safety instrumented systems), ISA standards for instrumentation (including S20 specification forms), API MPMS chapters (petroleum measurement), and AGA reports (natural gas custody transfer).
Safety Classifications and Explosion-Proof Requirements
Process installations in areas where flammable gases, vapors, or dusts may be present require meters with appropriate hazardous area certification. The two primary certification frameworks are ATEX/IECEx (used in the EU and most international markets) and NEC/CEC (used in North America). These are not interchangeable — a meter with ATEX Zone 1 certification cannot be installed in a Class I Division 1 location in the United States without separate FM or CSA certification.
Hazardous area certification influences both the meter and its installation: intrinsically safe (IS) circuits limit the energy available to the sensor, which may constrain signal range or require barriers in the control room; explosion-proof (XP/flameproof) enclosures add significant weight and cost; and purged/pressurized enclosures require continuous instrument air supply. KOBOLD’s hazardous area guide provides a comprehensive overview of certification types and their installation implications.
HVAC applications almost never require hazardous area certification — the notable exceptions being meters in hospital medical gas systems, paint spray booth exhaust monitoring, and parking garage ventilation CO monitoring with gas detection integration.
Economic Considerations and ROI
Total Cost of Ownership: CAPEX vs OPEX
Purchase price is the most visible — and most misleading — component of flow meter economics. Industry data consistently shows that initial CAPEX represents only 25–35% of 10-year total cost of ownership, with installation, calibration, maintenance, energy loss (pressure drop), and downtime accounting for the remainder.
Table 3: 10-Year TCO Comparison by Technology (4-inch Liquid Flow Meter)
| Cost Component | DP Orifice | Electromagnetic | Ultrasonic (Clamp-On) | Coriolis | Vortex |
|---|---|---|---|---|---|
| Meter + transmitter | $2,500 | $3,500 | $7,000 | $15,000 | $3,000 |
| Installation (HVAC) | $2,000 | $1,800 | $600 | $2,500 | $2,000 |
| Installation (Process) | $5,000 | $4,000 | $1,200 | $6,000 | $4,500 |
| 10-yr calibration cost | $5,000 | $6,000 | $8,000 | $8,000 | $4,000 |
| 10-yr maintenance | $8,000 | $2,000 | $3,000 | $2,500 | $2,000 |
| 10-yr energy loss (pressure drop) | $25,000 | $0 | $0 | $4,000 | $8,000 |
| 10-yr TCO (HVAC scenario) | $42,500 | $13,300 | $18,600 | $32,000 | $19,000 |
| 10-yr TCO (Process scenario) | $45,500 | $15,500 | $19,200 | $35,500 | $21,500 |
Assumes continuous operation (8,760 hr/yr), electricity at $0.10/kWh, 70% pump efficiency, and standard (non-exotic) materials. Process scenario adds hazardous area permitting and decontamination labor to installation and maintenance costs.
Chart 2: Where the Money Actually Goes — 10-Year TCO Breakdown (Electromagnetic Meter, Process Application)
10-Year TCO Distribution
Installation (26%)
Calibration & Verification (39%)
Maintenance (12%)
Note: For DP orifice systems, the “Energy Loss” slice (from pressure drop) would represent an additional 55% of total cost — the single largest component — which is why orifice plates show the highest 10-year TCO despite the lowest purchase price.
Downtime Reduction and Energy Savings
Unplanned flow meter failure in process service creates cascading costs: the measurement point goes blind, the associated control loop switches to manual, the operator must physically verify process conditions, and production rate may be reduced or halted until measurement is restored. A specialty chemical plant in Texas documented that each unplanned Coriolis meter failure on their reactor feed line caused an average of 6 hours of reduced-rate production, costing $18,000 per event in lost output — exclusive of the meter repair cost.
In HVAC, flow meter failure is rarely an emergency, but chronic measurement degradation creates invisible waste. A chilled water plant running without accurate flow data overproduces chilled water by 10–20% on average, because operators use conservative manual setpoints rather than optimized automatic control. Over a year, this hidden inefficiency can exceed $30,000 in pump and chiller energy for a medium-sized commercial campus — a cost that never appears as a line item because no one realizes the flow data driving the BMS is wrong.
Decision Framework: How to Choose Between HVAC vs Process Monitors
Risk Assessment and Critical Control Points
Begin every flow meter selection by classifying the measurement point’s criticality tier:
Table 4: Criticality Tier Classification
| Tier | Description | Accuracy Required | Typical HVAC Examples | Typical Process Examples |
|---|---|---|---|---|
| Tier 1 — Safety | Meter input to SIS or life-safety system | ±0.5–1.0%, SIL rated | Hospital isolation room airflow | Reactor emergency cooling, SIS input |
| Tier 2 — Compliance | Meter supports regulatory reporting or custody transfer | ±0.5–2.0%, traceable cal | ASHRAE 62.1 OA verification, LEED | EPA emissions, custody transfer billing |
| Tier 3 — Control | Meter feeds PID loop or optimization algorithm | ±1.0–3.0% | CHW pump VFD control | Batch dosing, blending ratio |
| Tier 4 — Monitoring | Trending, energy accounting, diagnostics | ±3.0–5.0% | Submetering, energy dashboards | Process troubleshooting, leak detection |
Tier classification directly determines acceptable meter technology, calibration interval, and documentation requirements. Over-specifying (Tier 1 meter on a Tier 4 point) wastes capital; under-specifying (Tier 4 meter on a Tier 1 point) creates safety or compliance risk.
Scalability and Future-Proofing
Facilities evolve. A building designed as Class A office space may be retrofitted as a laboratory. A chemical plant may add new product lines that change the fluid flowing through an existing metering point. Select meters with field-configurable parameters (flow range, output scaling, communication protocol) and upgrade paths (firmware updates for new protocols, field-swappable transducers for different fluid calibrations). Jade Ant Instruments’ 5-factor selection methodology includes a future-proofing assessment as the fifth factor, evaluating whether the meter platform supports anticipated changes in process conditions, accuracy requirements, or digital integration (HART 7, PROFINET, OPC UA) over a 10–15 year horizon.
Vendor Support and Service Models
The value of vendor support becomes apparent only when something goes wrong — and in flow measurement, something always eventually goes wrong. Evaluate vendors on response time (can they have an application engineer on-site within 48 hours?), spare parts availability (are transducers and electronics boards in regional stock or on 8-week factory lead time?), remote diagnostic capability (can they connect to your meter via HART pass-through or cloud gateway to troubleshoot before dispatching a truck?), and training programs (do they provide hands-on calibration and troubleshooting training for your maintenance staff?). A detailed vendor evaluation framework helps procurement teams score these service factors alongside technical specifications.
Implementation Best Practices and Case Studies

Phased Deployment Strategies
Attempting to install 50+ flow meters simultaneously across a running facility is a recipe for commissioning chaos. Industry best practice is a three-phase deployment: Phase 1 (Pilot, 4–8 weeks): install 3–5 meters on representative applications, validate accuracy against portable reference instruments, confirm BMS/DCS integration, and document installation lessons learned. Phase 2 (Rollout, 8–16 weeks): deploy remaining meters using the validated installation procedures from Phase 1, training additional maintenance staff on each batch. Phase 3 (Optimization, ongoing): analyze flow data trends to identify control improvements, calibration interval adjustments, and additional measurement points needed.
A multinational pharmaceutical company deployed 127 flow meters across a new API manufacturing facility using this three-phase approach. Phase 1 discovered that 8 of the planned electromagnetic meter locations had insufficient straight-run — a finding that would have affected 47 meters if rolled out without validation. The Phase 1 pilot added 6 weeks to the timeline but prevented an estimated $180,000 in rework costs.
Lessons from Real-World HVAC and Process Facilities
HVAC Case — 200,000 sq ft Corporate Campus, Denver: Twelve AHUs had no permanent airflow measurement. Jade Ant Instruments specified 24 thermal insertion probes for supply/return ducts and 12 averaging pitot arrays for exhaust fans. Post-installation diagnostics discovered three AHUs running at 130–145% design airflow (damper failures) and two under-ventilating by 18–22% (ASHRAE 62.1 non-compliance). Corrective actions reduced HVAC energy consumption by 17% ($64,000/year), with the $78,000 meter investment achieving payback in 14.6 months.
Process Case — Specialty Chemical Plant, Houston: A reactor off-gas line measured with an orifice plate showed 5–8% accuracy due to composition variability, causing 22% over-dosing of caustic in the downstream scrubber ($47,000/year in chemical waste). Replacing the orifice with a thermal mass meter (CPD type, Hastelloy sensor, multi-gas compensation) improved accuracy to 1.8% of reading, reducing scrubber chemical costs by 19% ($41,200/year) with an 11-month payback on the $38,000 installed cost.
KPIs to Track Post-Implementation
Establish measurement KPIs within 30 days of commissioning: meter availability (target >99.5%), measurement uncertainty (verified against reference), calibration compliance (percentage of meters within calibration due date), control loop performance improvement (reduced oscillation, tighter setpoint tracking), and energy savings realized (for HVAC applications) or yield improvement (for process applications). Review these KPIs monthly for the first year, then quarterly once stable baselines are established.
Selecting Vendors and Partners
Evaluation Criteria: Accuracy, Reliability, and Service
Technical specifications get you to a shortlist; service capability makes the final selection. Request documented accuracy data from the vendor’s ISO/IEC 17025-accredited calibration laboratory — not marketing-sheet specifications that cite “typical” performance. Ask for field performance data: what percentage of their installed meters maintain specification after 3 years in similar service? Vendors who can answer this question with data (not generalities) have real field experience. Jade Ant Instruments’ manufacturer comparison guide benchmarks key service metrics across major global flow meter brands.
References, Certifications, and Integration Capabilities
For process applications, require vendors to provide reference installations in your specific industry and fluid type. A vendor’s expertise in water metering does not translate to competence in concentrated acid metering — the materials science, installation practices, and failure modes are entirely different. Verify that the vendor’s products carry all certifications required for your installation: CE marking, ATEX/IECEx for hazardous areas, FM/CSA for North America, SIL capability certificates for safety-instrumented applications, and FDA compliance for pharmaceutical or food-contact service.
Training and Commissioning Support
The quality of commissioning support is the strongest predictor of first-year meter performance. Require the vendor to provide (at minimum): factory-supervised commissioning of the first 2–3 units, documented commissioning procedures including acceptance criteria, loop check verification from sensor through DCS/BMS, and hands-on training for your maintenance staff covering installation verification, basic troubleshooting, and calibration procedures. Budget commissioning labor at 50–100% of hardware cost — this is not overhead; it is the investment that turns a specification on paper into a working measurement in the field.
Video: Flow Meters Explained — Types, Working Principles, and Applications
This video provides a visual walkthrough of the major flow meter technologies discussed in this guide, including electromagnetic, ultrasonic, Coriolis, vortex, and differential pressure meters — and where each technology fits in HVAC and process industry applications:
Recap of Main Selection Criteria
The HVAC-versus-process flow monitor decision is not a binary choice between “simple” and “complex” instruments — it is a calibration of six interlocking factors against your facility’s specific requirements. Fluid properties (benign water/glycol vs. aggressive chemicals) determine material selection and eliminate incompatible technologies. Accuracy requirements (±3–5% energy monitoring vs. ±0.2–1.0% custody transfer) define the technology tier. Safety classification (standard indoor vs. ATEX Zone 1) determines enclosure, wiring, and certification requirements. Installation constraints (available straight-run, shutdown feasibility) shape the practical shortlist. Calibration and compliance obligations (annual verification vs. quarterly proving with traceable documentation) drive ongoing operational costs. Total cost of ownership over 10 years — not purchase price alone — reveals the true economics.
Aligning Measurement Technology with Facility Goals and Risk Tolerance
Match the meter’s capability tier to the measurement point’s criticality tier. Over-specification wastes capital; under-specification creates risk. A Tier 4 monitoring point on an HVAC condenser water loop does not need a $15,000 Coriolis meter — a $3,500 electromagnetic meter with ±1% accuracy provides more than sufficient data quality. Conversely, a Tier 1 safety input on a reactor cooling line must not be served by a $600 clamp-on meter whose ±3% accuracy may not detect the flow reduction that triggers an emergency condition.
Quick Checklist for the Final Purchasing Decision
Table 5: Pre-Purchase Verification Checklist
| Checkpoint | HVAC Application | Process Application |
|---|---|---|
| Fluid compatibility verified? | Usually standard — confirm glycol concentration | Full wetted-material review against MSDS |
| Accuracy meets application need? | ±2–5% for monitoring; ±1% for control | ±0.2–1.0% for dosing/custody; ±2% for monitoring |
| Straight-run space confirmed? | Survey mechanical room before ordering | Review P&IDs and piping isometrics |
| Output protocol matches BMS/DCS? | BACnet IP/MSTP, 4–20 mA, Modbus | HART, PROFIBUS, Foundation Fieldbus, Modbus |
| Hazardous area rating required? | Rarely (except medical gas, paint booths) | Frequently — confirm zone/division classification |
| Calibration plan established? | Annual verification recommended | Per criticality tier and SIS proof-test interval |
| Vendor support evaluated? | Confirm BMS integration expertise | Confirm process industry references and on-site capability |
| 10-year TCO calculated? | Include energy loss from pressure drop | Include downtime risk cost and calibration compliance |
Frequently Asked Questions (FAQs)
1. What are the most common flow meters used in HVAC systems?
The three most prevalent flow meter technologies in HVAC are electromagnetic flow meters (for chilled water, heating hot water, and condenser water loops), thermal mass flow meters (for duct airflow measurement and demand-controlled ventilation), and ultrasonic clamp-on meters (for retrofit applications where pipe modification is impractical). Electromagnetic meters dominate hydronic HVAC because they offer ±0.5% accuracy, zero pressure drop, and work well with water-glycol mixtures at any concentration. Jade Ant Instruments’ electromagnetic flow meter range covers pipe sizes from DN10 to DN2000, addressing everything from fan coil unit loops to central plant headers.
2. How do I determine the required accuracy for process monitoring?
Start with the end use of the measurement data. Custody transfer and billing applications typically require ±0.2–0.5% of reading with traceable calibration. Batch dosing and reaction stoichiometry control generally need ±0.5–1.0%. Process optimization and energy monitoring can tolerate ±1.0–3.0%. Environmental emissions reporting follows the uncertainty limits specified in the applicable permit (often ±2–5% depending on the pollutant and regulatory jurisdiction). The key principle: never specify tighter accuracy than the application actually requires — over-specification inflates both CAPEX and calibration OPEX without providing additional value.
3. What maintenance frequency is typical for industrial flow meters?
Maintenance intervals vary by technology and operating environment. Electromagnetic meters in clean service require the least maintenance — typically a visual inspection and diagnostic check every 12 months, with bench calibration every 24–36 months. Coriolis meters have similar intervals due to their no-moving-parts design. Vortex meters need bluff body inspection every 12–24 months in services with particulate or scale buildup. DP orifice plates require impulse line checks every 6 months and plate edge inspection annually. Thermal meters in dusty or contaminated gas streams may need sensor cleaning every 3–6 months to prevent fouling-related drift.
4. Can I use an HVAC-grade flow meter in a process application?
In limited cases, yes — if the process fluid, temperature, pressure, and required accuracy all fall within the HVAC meter’s specification envelope. For example, a clean water utility loop in a chemical plant may use the same electromagnetic meter as a commercial building chilled water system. However, HVAC-grade meters typically lack hazardous area certifications, exotic material options, SIL-rated safety functions, and the calibration traceability documentation required for process compliance. Using an HVAC-grade meter on a process line to save $1,000 on purchase price creates unquantified risk that can cost orders of magnitude more in the event of failure.
5. How does glycol concentration affect flow meter accuracy in HVAC systems?
Glycol changes three fluid properties that affect flow measurement: viscosity (increases significantly — 50% propylene glycol at 40°F has approximately 15× the viscosity of pure water), density (increases by 3–7% depending on concentration), and conductivity (decreases, which matters for electromagnetic meters). Electromagnetic meters handle glycol well because they measure velocity directly and are unaffected by viscosity, but the minimum conductivity specification must be checked — some budget electromagnetic meters have a 5 µS/cm minimum that may not be met by high-purity glycol solutions. Ultrasonic meters require reconfiguration of the speed-of-sound parameter for glycol, or accuracy will degrade by 3–8%.
6. What is the ROI timeline for installing flow monitors in an HVAC system?
Published case studies consistently show 8–24 month payback for flow-based HVAC optimization, depending on facility size, energy rates, and the degree of pre-existing inefficiency. The primary savings come from three sources: eliminating pump and fan over-operation (15–25% energy reduction), identifying and correcting equipment faults (stuck dampers, failed valves, malfunctioning VFDs), and validating chiller plant efficiency (ensuring actual COP matches design COP). A university cooling system study showed a $20,000/month savings after flow meter implementation — $240,000 annual return on a $110,000 investment.
7. What certifications should I look for when selecting flow meters for hazardous areas?
For North American installations: FM (Factory Mutual) or CSA certification to the applicable Class/Division/Group or Class/Zone/Group per the NEC. For European and international installations: ATEX certification per directive 2014/34/EU and/or IECEx certification. Ensure the specific protection concept (intrinsic safety “Ex i”, flameproof “Ex d”, increased safety “Ex e”, etc.) matches your installation method. This ATEX/IECEx guide provides a clear explanation of zone classifications and their corresponding equipment requirements.
8. How do I choose between a clamp-on ultrasonic meter and an inline electromagnetic meter for a retrofit?
The decision hinges on four factors: accuracy requirement (inline electromagnetic delivers ±0.5% vs. ±1–3% for clamp-on ultrasonic), fluid conductivity (electromagnetic requires >5 µS/cm — non-conductive fluids like deionized water or hydrocarbons must use ultrasonic), shutdown feasibility (clamp-on installs without process interruption; inline requires pipe cutting), and pipe condition (clamp-on accuracy depends on knowing exact pipe wall thickness and condition — corroded or lined pipes degrade performance). For HVAC chilled water retrofits where ±2% accuracy is acceptable and system shutdown is costly, clamp-on wins. For process applications requiring ±1% accuracy on conductive fluids, inline electromagnetic is the better choice.
9. What role do flow monitors play in achieving LEED certification?
LEED v4.1 includes an Indoor Environmental Quality (EQ) prerequisite requiring permanent outdoor air delivery monitoring for mechanically ventilated spaces serving 25 or more occupants. This requires permanent airflow measuring devices (thermal probes or averaging pitot arrays) on outdoor air intakes, capable of generating an alarm when measured airflow deviates more than 15% from the design minimum ventilation rate. Additionally, LEED Energy & Atmosphere credits reward demand-based control strategies that rely on flow monitoring for chilled water, hot water, and air systems. Accurate flow data supports the Measurement and Verification (M&V) plans required to document ongoing energy performance.
10. Where can I get engineering support for selecting the right flow monitor for my facility?
Jade Ant Instruments provides free application consultations for both HVAC and process flow monitoring. Their engineering team reviews your process data sheets, piping layouts, BMS/DCS architecture, and compliance requirements to deliver a documented recommendation covering technology selection, meter sizing, material specification, installation drawings, and calibration planning. For complex facilities with both HVAC and process measurement needs, they offer integrated metering strategies that standardize on common platforms where feasible — reducing spare parts inventory and training requirements while ensuring each measurement point meets its specific accuracy and compliance mandate. Start with their online flow meter selection guide or contact their application engineering team directly at www.jadeantinstruments.com.
This article was produced by the technical content team at Jade Ant Instruments, an ISO-certified manufacturer of industrial flow measurement instruments including electromagnetic flow meters, vortex flow meters, thermal mass flow meters, and ultrasonic flow meters. For application-specific engineering support, visit www.jadeantinstruments.com.