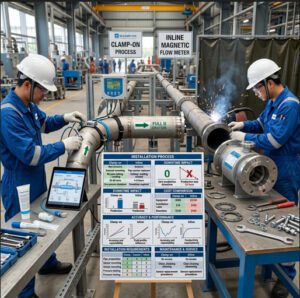
 Feature image: upload this file to your WordPress media library, then keep the filename above.
To maximize the operational lifespan and measurement accuracy of advanced ultrasonic water flow meters, maintenance teams must move from reactive repairs to a proactive strategy. The strategy rests on three pillars. Teams protect signal integrity, follow rigorous calibration protocols, and run environment-specific installation audits.
This guide serves only trade readers. The readers are OEM equipment and skid-mount manufacturers, instrument distributors and importers, EPC firms and system integrators, industrial end users and MRO teams, and municipal and utility operators. Each group owns meter health at a different stage, and this guide gives each group its own tasks.
I. The Critical Role of Ultrasonic Flow Measurement in High-Stakes Industrial and Municipal Infrastructure
Flow meters sit under money and safety decisions. A utility bills a city district from one inlet meter. A plant stops a chemical batch when a dosing meter drifts. A cooling system protects a turbine with flow data.
Errors in these points cost more than a repair bill. A billing meter that drifts 2% low for a year can hide revenue in the six figures on a large zone. A dosing meter that drifts high can scrap product batches before anyone sees the cause.
Common Pain Points for MRO and EPC Teams: Signal Attenuation, Installation Drift, and Calibration Decay
Three faults cause most field trouble. Signal attenuation means the received sound grows weak, and the meter works harder to hear its own signal. Installation drift means the physical setup shifts after commissioning, through moved sensors, aged gel, or changed pipe state. Calibration decay means the reading slowly walks away from the true value as parts age and deposits grow.
Each fault starts small. Each fault also leaves a trace in the meter data long before the reading fails. Proactive teams read those traces.
O transit-time and Doppler working guide gives new technicians the base they need before they touch a live meter.
Objective: A Technical Roadmap to Reducing Downtime and Ensuring Long-Term Measurement Stability
This guide lays out a full maintenance roadmap. The roadmap starts with signal quality. The roadmap then covers drift, calibration, fluid state, environment, diagnostics, integration, and fast troubleshooting.
Teams can lift each section into a site manual as a standalone procedure. Section IX gives the rapid recovery matrix for the day a meter still surprises the team.
II. Optimizing Signal Quality and Noise Reduction
Maintaining a high signal-to-noise ratio is the foundation of accurate ultrasonic measurement. The signal-to-noise ratio, or SNR, compares the strength of the sound signal with the strength of background noise. A high SNR gives a clean reading. A low SNR gives jitter, dropouts, and drift.
Identifying Sources of Acoustic Noise: Pump Cavitation, Turbulence, and Electrical Interference
Pump cavitation creates clouds of tiny bubbles near a pump outlet. Cavitation is the forming and collapse of vapour bubbles in a liquid under low pressure. The bubbles scatter sound and add sharp noise to the signal.
Turbulence adds a second noise source. Bends, half-open valves, and reducers stir the flow, and the stirred flow bends the sound path in random ways. The reading then dances around the true value.
Electrical interference adds a third source. Variable frequency drives, welders, and long parallel power cables inject noise into sensor cables. The ultrasonic flow meter reference entry outlines the core measurement physics that these noise sources attack.
Techniques for Optimizing Transducer Coupling and Interface Contact
Sound cannot cross air. The coupling gel fills the micro-gaps between the transducer face and the pipe wall. Old gel dries, cracks, and traps air, and the signal fades month by month.
A sound renewal takes minutes:
- The technician removes the transducer and cleans both faces.
- The technician cleans the pipe spot to bare, smooth material.
- The technician applies fresh gel in an even layer.
- The technician seats the transducer firm and checks the signal quality index at once.
Inline sensors need a different care path. The crew cleans sensor faces during planned stops and checks for scale coats. A thin scale coat can cost clear signal strength on a hot line.
 Replace this slot with your own photo. Suggested: close-up of hands renewing couplant and re-seating a clamp-on transducer.
Utilizing Diagnostic Tools to Monitor Signal Strength and Quality Indices
Modern meters report signal strength, gain, and a signal quality index. Gain shows how hard the meter amplifies the received sound. Rising gain at the same flow point means the path is fouling or the coupling is ageing.
Teams should log three values at every visit: signal strength, gain, and quality index. A simple rule works well in the field. A quality index above 60 means a healthy point. A value between 50 and 60 means the team should plan a service visit. A value below 50 means the team should act now.
Portable diagnostic kits help on large sites. One kit can survey a whole meter fleet in a day and rank the points by health.
III. Addressing and Correcting Installation Drift
Physical shifts in piping and environmental degradation can lead to drift, and drift compromises data integrity. Drift is a slow shift of the reading away from the true value while the meter still looks alive.
Detecting Drift Through Baseline Comparison and Zero-Flow Verification
Every meter needs a baseline record from commissioning day. The record holds signal strength, gain, transit times, and the zero-flow offset. Later visits compare live values against that record.
Zero-flow verification is the fastest drift test. The crew stops the flow at a true no-flow state and reads the meter. A healthy meter reads zero or a hair above it. A steady offset at no flow proves drift, and the size of the offset guides the fix.
Teams should run zero checks at every planned stop. The test costs five minutes and catches the fault class that costs the most money.
Assessing the Impact of Pipe Scaling, Corrosion, and Liner Degradation on Sonic Velocity
Scale grows on pipe walls in hard water service. The scale shrinks the true inner diameter, and the meter still computes with the old diameter. The reading then reports more flow than the pipe truly carries, because the same velocity in a smaller bore means less volume.
Corrosion roughens the wall and scatters sound. Liner damage bends the sound path at loose spots. Each change alters the sonic velocity profile that the meter assumes, where sonic velocity is the speed of sound in the fluid and pipe path.
An audit visit should include a wall thickness measure and a bore check at the meter point. The crew updates the meter setup with the true figures on the spot.
Correcting Alignment Errors in Clamp-On Configurations to Eliminate Path-Length Inaccuracies
Clamp-on sensors drift when straps loosen or a sensor slides. A 2 mm slide on a small pipe changes the path length, and the reading shifts at once. Paint marks from install day expose the slide at a glance.
The fix follows a set order. The technician checks the spacing against the transmitter value. The technician re-seats both sensors on the paint marks with fresh gel. The technician then re-runs the zero check and logs the new baseline values.
O clamp-on flow sensor selection notes help teams pick sensor sizes that resist alignment trouble on each pipe class.
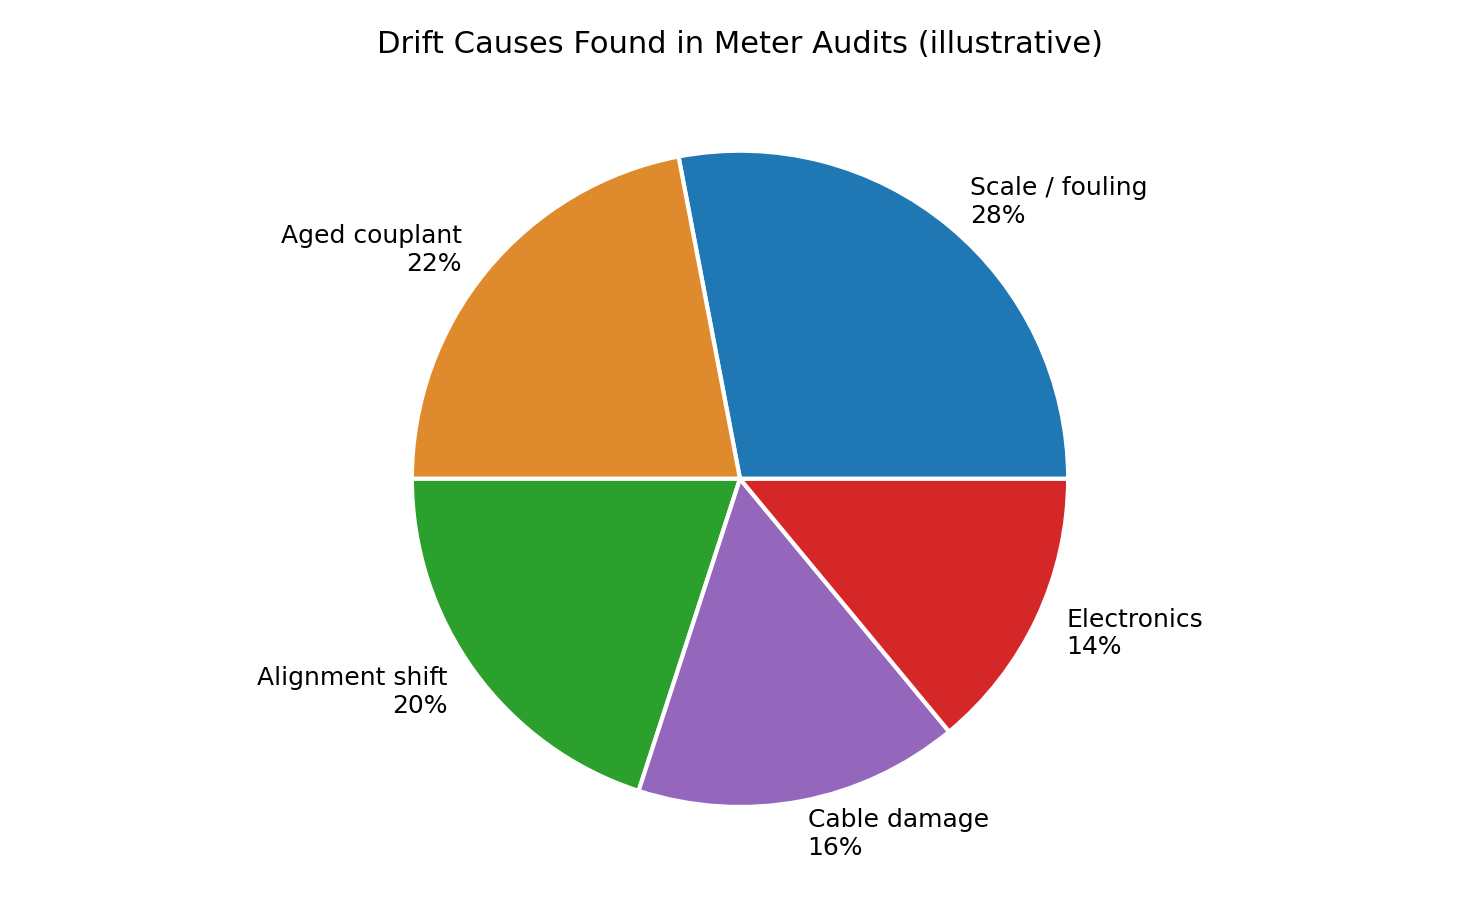 Replace this slot with your own chart or diagram. Suggested: pie chart of drift causes found in site audits, with scale and aged couplant as the largest shares.
IV. Strategic Calibration Checks and Verification Protocols
Periodic verification ensures that the meter remains within the specified tolerance of the original OEM certification. Verification checks the meter against a reference. Calibration adjusts the meter when the check finds an error.
Implementing In-Situ Verification Methods to Avoid Costly System Shutdowns
In-situ verification tests the meter in place, in the live line. The method avoids removal, draining, and shutdown. Three methods cover most sites:
- Portable reference method: a clamp-on reference meter reads the same line at a sound point nearby.
- Tank or level method: the team compares meter totals against a measured tank level change.
- Pump curve method: the team compares the reading against the duty point of a known pump.
Each method has limits. The portable method shares the line’s flow profile risks. The tank method needs a calm, measurable window. A good report states the method and its uncertainty, not just a pass mark.
Teams that run regular audits use portable ultrasonic meters for water audits as the reference tool for this work. This setup walkthrough shows the configuration steps a technician follows before a verification run:
https://www.youtube.com/watch?v=tlqVPhSmDPs
Establishing a Tiered Calibration Schedule Based on Criticality (Municipal vs. Industrial)
Not every meter earns the same cycle. Billing and custody points carry legal and revenue weight, and those points need the tightest cycle. General monitoring points can run longer between checks.
| Meter duty | Verification interval | Full calibration trigger |
|---|---|---|
| Custody transfer and billing | 12 meses | Any error above half the allowed tolerance |
| Chemical dosing and recipe control | 12 meses | Error above 1% at any test point |
| Controle de processos | 12 to 18 months | Drift trend across two checks |
| District metering and leak zones | 18 months | Zero offset or signal decay |
| General monitoring | 24 meses | Reading dispute or signal fault |
Municipal billing meters also follow local metrology rules, and those rules can set firm dates. Industrial meters follow the plant quality system instead. Both systems reward records that show a steady history, not a single heroic repair.
 Replace this slot with your own chart or diagram. Suggested: bar chart of verification intervals by duty tier, billing tightest and general monitoring longest.
Documenting Traceability and Adhering to ISO/IEC Standards for Audit Compliance
Traceability means every measurement links back to a national standard through an unbroken chain of checks. Auditors ask for that chain by name. A calibration certificate without a traceable reference holds little weight in a dispute.
Laboratories that issue strong certificates work under the ISO/IEC 17025:2017 standard for calibration laboratories. Buyers should ask any calibration vendor for the accreditation scope, not just a logo.
Site files should hold five records per meter: the commissioning baseline, each verification report, each adjustment record, the certificate set, and the current setup file. A missing baseline is the most common audit failure that MRO teams report.
 Replace this slot with your own photo. Suggested: meter on a wet calibration rig in a lab, with reference pipework and a laptop.
V. Managing Fluid Dynamics for Enhanced Performance
Understanding the relationship between flow profiles and ultrasonic paths is essential for eliminating measurement bias. The meter reads velocity along sound paths. The flow profile decides how that path velocity maps to true volume.
Ensuring Adequate Straight-Run Requirements (Upstream and Downstream) to Minimize Turbulence
A stable profile needs straight pipe. The common rule asks for 10 pipe diameters before the meter and 5 after it. Pumps and control valves disturb the profile more than bends, and points near pumps may need 20 to 30 diameters.
Maintenance teams inherit the install they have. An audit should still measure the real straight run and record the figure. A short run does not doom a point, but the team must then judge the reading as a lower-tier source.
Profile trouble has a clear sign. The reading error changes with flow rate, small at high flow and large at low flow, or the reverse. A profile fault, not an electronics fault, causes that pattern in most cases.
Managing the Effects of Entrained Air and Bubbles on Signal Attenuation
Entrained air is air mixed into the water as fine bubbles. Fine bubbles scatter transit-time sound and weaken the signal. A sudden bubble load can drop the reading to zero for minutes.
Sources sit close to the meter in most cases. A suction-side leak pulls air into a pump line. A falling inlet stream aerates a tank feed. A cavitating pump fills the line with vapour bubbles.
The fix belongs to the process, not the meter. The team seals the suction leak, calms the inlet, or moves the meter point to a full, rising leg of pipe. Air release valves at high points protect chronic spots.
Adjusting Flow Profiles Using Conditioners or Strategic Sensor Placement
A flow conditioner evens the velocity profile inside a short pipe run. The device costs some pressure head, and the engineer must check the pump margin before the team fits one.
Sensor placement offers a cheaper lever. A multi-path meter averages several chords and resists profile skew. A single-path clamp-on point can move to the best straight run on the line, even if that point sits far from the original plan.
Teams should record the final point choice in the as-built file. A later crew that moves the point back can undo the fix without knowing it.
VI. Environmental Hardening and Asset Protection
Protecting the physical instrument from harsh industrial environments extends the mean time between failures. MTBF is the average run time between two failures across a fleet. Environment work raises MTBF more cheaply than spare parts do.
Implementing Thermal Insulation and Heating Jackets for Extreme Temperature Fluctuations
Cold chambers freeze couplant and thicken cable jackets. Hot lines age gel and electronics. Insulation evens the swings, and a heating jacket holds a safe band on outdoor winter points.
One rule protects the sensors. The insulation must not bury the transducer under a thick, loose layer that the crew cannot remove. A removable insulation pad over the sensor zone gives protection and service access in one part.
Battery meters need thermal care too. Cold cuts battery output, and a shaded, insulated box can add years to a remote point’s service interval.
Selecting Appropriate Ingress Protection (IP) Ratings and Housings for Corrosive Municipal Environments
The IP rating states how well a housing seals against dust and water. IP65 resists jets of water. IP68 allows long immersion. Flooded municipal chambers demand IP68 sensors, because one flood ends a lesser unit.
Corrosion sets the housing material. Coastal and wastewater sites attack paint and cheap alloys. Stainless or coated housings cost more at order and less across ten winters. The ultrasonic water flow meter line from Jade Ant Instruments lists housing and rating options per model for specifiers who write chamber duty into tenders.
 Replace this slot with your own photo. Suggested: technician checking a meter in a damp underground chamber with insulated pipework.
Surge Protection and Grounding Strategies to Prevent Electronic Failure in Skid-Mount Systems
Lightning and switching surges kill transmitter electronics in one event. A surge protector on the power line and on long signal runs absorbs the hit. The skid frame needs one clean earth point, and every shield should land on that point.
Ground loops cause the quieter fault. Two earth points at different potentials push current through cable shields, and the current shows up as noise. A single-point ground plan in the design file prevents years of ghost faults.
MRO teams should test surge devices at annual service. A spent protector looks fine and protects nothing.
VII. Advanced Diagnostics and Predictive Maintenance
Shifting from scheduled maintenance to condition-based monitoring reduces operational overhead. The meter already measures its own health. The team only needs to collect and act on that data.
Leveraging Built-In Diagnostic Alarms for Early Detection of Sensor Failure
Modern transmitters alarm on low signal, high gain, path failure, and empty pipe. Each alarm maps to a short field procedure. A low-signal alarm sends the crew to the coupling first, not to the parts store.
Alarm thresholds need site tuning. Factory defaults can cry wolf on hard lines, and crews learn to ignore noisy alarms. A two-week baseline period lets the team set limits that mean something.
Analyzing Historical Data Trends to Predict Scaling or Blockage
Trend lines tell the story early. A gain value that climbs a little each month points to scale growth. A quality index that falls after each hot spell points to gel ageing. A zero offset that creeps points to alignment shift.
One municipal team caught a scaling main this way. Gain rose 18% across one quarter at flat signal demand. The crew cleaned the point at a planned stop and avoided a billing dispute the next quarter. The data cost nothing, because the meter had logged the values all along.
Integrating Meter Health Data into SCADA and CMMS for Automated Maintenance Triggers
A SCADA system watches process data at a central point. A CMMS system manages maintenance work orders. The link between the two turns a health alarm into a scheduled job with no phone calls.
The setup needs three choices. The team picks which health values travel to SCADA. The team sets the trigger limits in the CMMS. The team assigns an owner for each trigger class.
Small fleets gain too. A monthly export of health values into a simple sheet beats no record at all, and the habit builds the baseline that later automation needs.
VIII. Integration Best Practices for OEM and System Integrators
Seamless integration at the design phase prevents long-term maintenance headaches for the end-user. Most lifetime meter pain is designed in, or designed out, before the first pipe is cut.
Standardizing Communication Protocols (Modbus, HART, Profinet) for Reliable Data Transmission
One protocol across a fleet cuts spare types and training load. Modbus suits SCADA-heavy plants. HART suits plants with strong instrument shops. Profinet suits skid builders inside large automation lines.
The protocol choice must include health data, not just flow. A design that maps only the flow value strands the diagnostics inside the meter. Specifiers should list the health registers in the data sheet request at order stage.
Cable and segment rules matter as much as the logo on the protocol. A sound bus design with clean terminations outlives a premium protocol on poor cable.
Designing Accessible Installation Points for Easier Technician Access During MRO Cycles
A meter that needs scaffolding for a gel renewal will not get gel renewals. Designers should place clamp-on points within safe reach and leave hand room around the sensors. A platform or a ground-level point pays for itself at the first service cycle.
Access includes data access. A local display that a technician can read at the point beats a value that lives only in a control room across the site. Junction boxes should open with common tools, and cable entries should face down to shed water.
Creating Comprehensive As-Built Documentation for Future Calibration Reference
An as-built file records the system as the crew actually left it. The file holds pipe data, sensor positions with photos, setup values, baseline diagnostics, and the calibration certificate set.
This file is the calibration reference for every later year. A verification crew with a full as-built file finishes in half the time and makes fewer setup errors. The ultrasonic flow meter cost savings and ROI guide shows how documentation and planned care convert into avoided downtime cost, for teams that must defend a maintenance budget.
OEM builders should ship the as-built file as a product, with a named owner at handover. Files that belong to everyone belong to no one, and they vanish within a year.
IX. Troubleshooting Matrix for Rapid Recovery
A structured approach to troubleshooting reduces the mean time to repair. MTTR is the average time from fault report to a restored, trusted reading. The matrix below cuts that time by fixing the search order.
Step-by-Step Isolation of Hardware Failure vs. Configuration Error
Most calls that look like hardware failure end as setup faults. Crews should isolate in this order:
- Power and display: confirm supply, fuses, and a live screen.
- Setup data: confirm pipe size, wall, material, and fluid in the menu.
- Signal values: read strength, gain, and quality index against the baseline.
- Sensor path: inspect cables, connectors, gel, and sensor position.
- Process state: confirm a full pipe and real flow conditions.
A fault found at step 2 or 3 costs minutes. A crew that starts at step 4 with a parts swap can burn a day and still miss a wrong wall entry.
Identifying False Positives in Flow Readings Caused by External Vibrations
Vibration shakes sensors and pipe walls, and the shake can fake a flow signal at true no-flow. Rotating machines near the meter point are the usual source. The sign is a reading that pulses in time with a nearby machine and falls to zero when that machine stops.
The fix has three levels. The crew re-seats and firms the sensor mounts. The crew moves the point away from the machine if the layout allows. The team sets a low-flow cutoff in the transmitter to hide residue noise below a real flow floor.
Verification Checklist for Rapid Deployment of Replacement Transducers
A spare transducer only speeds repair if the swap follows a checklist:
| Step | Check | Pass sign |
|---|---|---|
| 1 | Match sensor model and frequency to the point record | Model code matches the as-built file |
| 2 | Clean pipe spot and sensor face | Bare, smooth contact surface |
| 3 | Apply fresh couplant, even layer | No dry spots or air pockets |
| 4 | Set spacing from the transmitter value | Spacing within 1 mm of the guide |
| 5 | Read signal quality index | Value at or above 60 |
| 6 | Run zero-flow verification | Offset at the baseline level |
| 7 | Log new baseline values | Record saved in the meter file |
A swap that skips step 6 can return a live but wrong meter to service. The log entry at step 7 protects the next crew.
X. Synthesis of the Proactive Maintenance Framework
The framework has a simple spine. Teams protect the signal, watch for drift, verify on a tiered cycle, harden the point against its environment, and let health data trigger the work. Each habit is cheap alone. Together the habits turn meter care from emergency work into routine work.
The Long-Term ROI of Rigorous Calibration and Signal Management
The return shows up in avoided losses. One caught drift event on a billing point can pay for years of verification visits. One avoided shutdown pays for a portable reference kit. Plants that log health data also defend their numbers in audits and disputes, and that defence has cash value even when no fault ever occurs.
Final Call to Action: Implementing a Standardized Maintenance Manual Across All Utility and Industrial Assets
Asset owners should merge the sections of this guide into one site manual, assign an owner per meter class, and set the first verification dates this quarter. Teams that need a starting template can ask the Jade Ant Instruments team for a maintenance audit template with their meter list and duty classes in the first message. The first audit then sets the baselines that every later year will use.
Glossary: Plain Words for Key Terms
| Termo | Plain meaning | Example |
|---|---|---|
| Signal-to-noise ratio (SNR) | The strength of the sound signal next to background noise | A high SNR gives a steady reading on a pump line |
| Signal attenuation | Loss of sound strength along the path | Scale on a sensor face fades the signal |
| Drift | A slow shift of the reading away from the true value | A meter that gains 0.2% per month after a sensor slide |
| Couplant | A gel that removes air between a sensor and the pipe | Fresh gel at a yearly service visit |
| In-situ verification | A check of the meter in place, in the live line | A portable reference meter reads the same line |
| Traceability | A chain of checks that links a result to a national standard | A certificate that names the lab and its scope |
| Flow profile | The shape of water speed across the pipe bore | A flat profile after a long straight run |
| MTBF | Mean time between failures across a fleet | A fleet that runs 6 years on average between faults |
| MTTR | Mean time to repair, from report to trusted reading | A matrix-guided crew restores a point in 2 hours |
| CMMS | A software system that manages maintenance work orders | An alarm auto-creates a service job |
| IP68 | A rating that allows long immersion in water | A sensor that survives a flooded chamber |
| Wet calibration | A test with real water against a reference standard | A lab rig test at three flow points |
Perguntas frequentes
1. How do I distinguish between a failing transducer and a signal blocked by pipe scaling?
The technician checks the quality index and gain first. Scale raises gain on both paths in a slow, even pattern over months. A failing transducer often drops one path hard or fails at once. A cleaning test settles the case: if a face clean restores the signal, scale was the cause.
2. What is the maximum allowable signal attenuation before the meter becomes unreliable?
Most teams treat a signal quality index below 50 as unreliable ground. Gain near the top of the meter range is a second warning, because the meter has no headroom left for a bad day. Sites should set their own floor from the baseline record and act before the reading, not after it, starts to jump.
3. How often should a municipal water meter be re-calibrated compared to an industrial process meter?
Municipal billing meters follow local metrology rules, and many areas set a test cycle of a few years with yearly verification. Industrial process meters follow the plant quality system, and critical loops often verify each year. Dosing and custody points in both worlds sit at the tight end of the cycle.
4. Can we use a different coupling gel than the OEM provided, and will it affect the signal?
A team can use another gel if the gel matches the site temperature and the pipe surface. High-temperature points need rated gel, and food plants need food-grade gel. The wrong gel dries or runs and the signal fades. After any gel change, the crew should log the new signal values as a fresh baseline.
5. How does the presence of micro-bubbles affect the transit-time measurement?
Micro-bubbles scatter the sound and shrink the received signal. A light load adds jitter. A heavy load can drop the reading or force the meter to a fault state. The crew should hunt the air source, such as a suction leak or a cavitating pump, because the meter cannot fix a process fault.
6. What are the signs that installation drift is occurring in a clamp-on ultrasonic meter?
The classic signs are a zero-flow offset, a slow gain climb, and a reading that disagrees with a check meter by a growing margin. Paint marks expose a slid sensor at a glance. A baseline comparison at each visit turns these signs into numbers the team can act on.
7. How do we handle calibration verification in a system where removing the meter is impossible?
The team verifies in place. A portable reference meter, a tank level change, or a pump duty point can each serve as the reference. The report must state the method and its uncertainty. In-situ results guide care well, even where a legal rig test remains the formal path for billing points.
8. What is the impact of pipe wall thickness errors on the final flow calculation?
Wall thickness sets the sensor spacing math and the sound path in the water. A wrong entry shifts every reading by a fixed share. On small pipes the share can reach several percent. A thickness gauge measure at the point takes minutes and removes the whole error class.
9. When should we replace the transducers versus attempting to re-calibrate the electronics?
The team replaces transducers when a face is pitted, a cable is damaged, or one path stays weak after a clean and re-bond. The team recalibrates electronics when both paths are strong and even but the reading sits off by a steady share. Signal pattern, not age alone, should drive the choice.
10. Which diagnostic parameters are most critical to monitor in a SCADA system for predictive maintenance?
Four values carry most of the warning power: signal strength, gain, signal quality index, and zero-flow offset. Path transit times add value on multi-path meters. A monthly trend of these values predicts most fouling, coupling, and alignment faults weeks before the reading fails.