Thermal vs. Coriolis vs. Vortex:
Calibration Requirements Decoded
A comprehensive guide for flow instrumentation distributors and agents to understand calibration approaches, best practices, and maintenance schedules across three leading mass flow meter technologies.

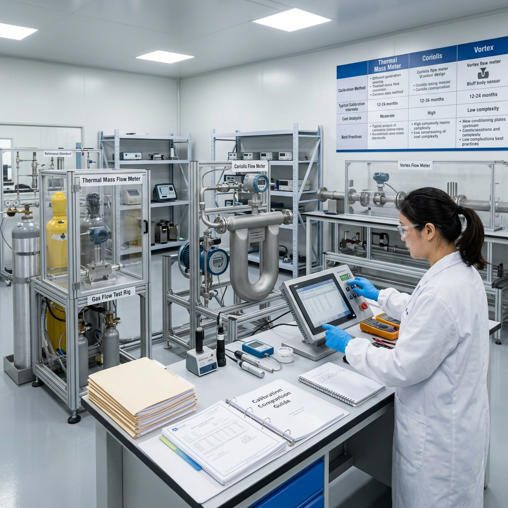
Industrial mass flow meter instrumentation on process pipelines — thermal, Coriolis, and vortex meters each demand fundamentally different calibration strategies. Image: Unsplash (free to use)
A pharmaceutical plant in Germany discovered a 2.4% drift on its thermal mass flow meter — only during an FDA audit. The recalibration cost $1,200. The production batch quarantine cost $380,000. Calibration isn’t paperwork: it’s the line between a reliable measurement and a catastrophic compliance failure. This guide gives distributors and agents the technical depth to advise customers — and protect them from exactly these scenarios.
The global flowmeter calibration market was valued at USD 5.18 billion in 2025 and is projected to reach USD 10.88 billion by 2035 at a CAGR of 7.7%, according to Fact.MR. Yet many customers still treat calibration as an annual checkbox rather than a performance management discipline. The result: silent drift, compliance exposure, and — in billing applications — direct revenue loss that compounds quarterly.
For distributors and agents selling thermal, Coriolis, or vortex mass flow meters, understanding the calibration differences between these technologies is a commercial differentiator. The customer who understands that their Coriolis meter needs zero-point verification before every commissioning, or that their vortex meter’s shedder bar must be inspected when steam quality degrades, becomes a long-term partner — not just a transaction.
This guide, developed with technical support from the engineering team at Jade Ant Instruments, decodes calibration requirements for all three technologies: what the science demands, what the standards require, what failure looks like, and what it costs your customers to get it right versus wrong.
1. Understanding Mass Flow Meter Technologies: A Comparative Overview
Before calibration approaches can be compared, the underlying physics must be clear. Each technology translates a different physical phenomenon into a flow measurement signal — and each phenomenon carries its own drift characteristics, contamination sensitivities, and calibration demands.
Thermal Mass Flow Meter
Measures mass flow by detecting the heat transferred between a heated sensor and the flowing gas. Flow rate is proportional to the temperature differential. Ideal for clean dry gases: nitrogen, compressed air, natural gas, hydrogen. Accuracy typically ±1–2% of full scale. No moving parts, but highly sensitive to gas composition changes and sensor contamination.
Coriolis Mass Flow Meter
Measures mass flow directly via the Coriolis effect — fluid moving through a vibrating tube causes a phase shift proportional to mass flow rate. Simultaneously outputs density and temperature. Accuracy ±0.1–0.5% of reading. Works on liquids and gases. Industry gold standard for custody transfer and batch-critical processes. Higher acquisition cost.
Débitmètre à vortex
Detects vortices shed alternately from a bluff body (shedder bar) inserted in the flow path, using the von Kármán effect. Shedding frequency is proportional to flow velocity. Best for steam, gases, and clean liquids at elevated temperatures. Accuracy ±0.75–1.5% of reading. Robust design with no moving parts, but signal drops below a minimum flow threshold.
Industry Applications at a Glance
| Industry | Typical Fluid | Thermal | Coriolis | Vortex |
|---|---|---|---|---|
| Pharmaceuticals | Clean N₂, CDA, purified water | Preferred | Preferred | Limited |
| Pétrole et gaz | Natural gas, crude oil, condensate | Gas only | Gold standard | Gas apps |
| Alimentation et boissons | CIP liquids, CO₂, water | Gas loops | Preferred | Clean liquids |
| Traitement chimique | Solvents, acids, resins | Limited | Preferred | Compatible |
| HVAC / Utilities | Steam, chilled water, compressed air | Compressed air | Overspecified | Preferred |
| Semiconductor Mfg. | Ultra-pure gases (Ar, He, H₂) | Industry standard | Cost barrier | Not suitable |
| Eau et eaux usées | Clean and treated water | Not suitable | High-value lines | Common |
2. Calibration Fundamentals: What Every Distributor Should Know
The Science Behind Calibration
Calibration is the controlled process of comparing a flow meter’s output against a traceable reference standard, then adjusting or documenting the difference. Its purpose is two-fold: to correct for systematic error (a consistent bias in one direction) and to quantify random uncertainty (the scatter in repeated readings).
The practical benchmark for calibration traceability is ISO/IEC 17025 accreditation — the international standard that governs calibration laboratory competence. NIST (National Institute of Standards and Technology in the US) provides the national reference chain that ISO/IEC 17025 labs trace back to. As Mensor explains, ISO/IEC 17025 accreditation can be considered a step above simple NIST traceability because it also audits the calibration process itself — not just the reference instrument chain.
For distributors advising customers on service providers: always verify that the calibration laboratory holds ISO/IEC 17025 accreditation with a scope that explicitly covers mass flow meters at your customers’ operating ranges. A certificate that says “NIST-traceable” without accreditation provides no guarantee about method quality.
Why Different Technologies Require Different Approaches
The physics of each measurement technology dictates what can drift, what can contaminate, and what must be verified. This is not a minor detail — it determines whether an in-situ verification is acceptable or whether a lab pull is mandatory.
- Thermal meters drift primarily due to sensor fouling (thin oil film, dust buildup), gas composition changes, and temperature coefficient aging of the RTD or thermopile sensing elements. Even a 0.1°C offset in the heated sensor’s temperature differential translates to a 1–3% flow error depending on flow range.
- Coriolis meters drift due to zero-point instability (mechanical stress, temperature expansion of the vibrating tube), coating of tube internals (which shifts apparent density), and in rare cases — corrosion-induced wall thinning. The vibration frequency used for density is also affected by mounting constraints that change over time.
- Vortex meters drift primarily when the shedder bar geometry changes due to erosion, fouling, or build-up — which alters the K-factor permanently. Signal strength degradation from piezoelectric sensor aging is a secondary cause.
Aperçu du secteur : A 2025 field study by Zero Instrument covering 340 installed mass flow meters found that 68% of calibration failures were not caused by instrument defects — they were caused by process-side conditions (contamination, temperature shifts, incorrect installation geometry) that accelerated drift beyond normal intervals. Training customers on environmental monitoring is calibration prevention.
Regulatory and Industry Standards
Customers in regulated industries must maintain documented calibration against specific standards. Below are the key references distributors should know:
| Standard | Technology | Industry | Key Requirement |
|---|---|---|---|
| ISO 10790:2015 | Coriolis | All | Selection, installation, calibration, and performance guidelines |
| ISO 4185 | Thermal / Liquid | All | Measurement of liquid flow in closed conduits — weighing method |
| ISO 6358 | Thermal / Gas | Pneumatics | Pneumatic flow control components — flow rate measurement |
| API MPMS Ch. 5 | Coriolis / Vortex | Pétrole et gaz | Custody transfer metering — uncertainty ≤ 0.25% required |
| ISO/IEC 17025 | All | All regulated | Calibration laboratory competence — accreditation required |
| 21 CFR Part 11 | All | Pharmaceutical | Electronic calibration records and audit trails required |
| ASME MFC-6 | Vortex | Steam/industrial | Measurement of fluid flow in pipes using vortex flowmeters |

Process control engineers reviewing mass flow meter calibration records — maintaining ISO/IEC 17025-traceable documentation is non-negotiable for regulated industries. Image: Unsplash (free to use)
3. Thermal Mass Flow Meter Calibration: A Deep Dive
Calibration Principles for Thermal Technology
Thermal mass flow meters use one of two operating principles: constant temperature differential (CT), where the heater power adjusts to maintain a fixed temperature difference and power input correlates to mass flow; or constant power (CP), where the temperature differential changes with flow rate. Both methods are sensitive to:
Temperature compensation: At a semiconductor fab running argon at 20 SLPM, a 5°C ambient swing in the cleanroom caused an uncorrected thermal meter to drift by 1.8% — enough to push the deposition recipe out of specification. Modern thermal meters include internal temperature compensation, but the compensation coefficients themselves must be verified during calibration.
Sensor drift characteristics: The Pt100 or Pt1000 RTD sensing elements in thermal meters age over time — resistance drift in the range of 0.01–0.05 Ω/year is typical. This appears as a slow zero drift that accumulates invisibly unless periodic zero-flow checks are performed. Teledyne Hastings notes that establishing a traceable reference standard before the zero-and-span calibration sequence is the first and most critical step for thermal meter accuracy.
Pre-Calibration Assessment Checklist — Thermal
- Inspect sensor element for oil film, particulate buildup, or corrosion — even a transparent coating of compressor oil reduces heat transfer and introduces a positive flow bias.
- Confirm gas temperature at the inlet is within ±2°C of the calibration gas temperature. Calibrating at 20°C nitrogen then running at 60°C nitrogen introduces density-driven error if the meter lacks a temperature correction table for that range.
- Measure differential pressure across the meter — a blocked filter upstream increases velocity profile distortion and can shift the span by 0.5–1.5%.
- Verify that the calibration gas species and concentration exactly match the process gas. Gas conversion factors (GCF) are only accurate if the process gas mixture is unchanged since last calibration.
Calibration Methods and Equipment — Thermal
Thermal meters for gas service are typically calibrated using a primary gas flow standard — either a laminar flow element (LFE) with ±0.25% uncertainty or a sonic nozzle (critical flow venturi) with ±0.1–0.2% uncertainty, both traceable to NIST via volumetric displacement or gravimetric methods. For calibration at the customer site, portable master meters with current calibration certificates are acceptable but introduce additional uncertainty that must be documented.
Calibration Frequency and Intervals — Thermal
Real-World Data: Sage Metering’s field maintenance records show that traditional thermal mass flow meters typically require annual factory recalibration under standard conditions. High-contamination environments — compressor aftercoolers with moisture, semiconductor processes with reactive gases — require 6-month intervals. The VPInstruments calibration note confirms thermal-based meters’ calibration shelf life exceeds 12 months in clean compressed air — but this depends on consistent operating conditions.
Best Practices for Thermal Meter Maintenance
- Install a 5-micron coalescing filter upstream — this single action has been shown to extend calibration intervals from 12 to 24 months in compressed air applications.
- Perform monthly zero-flow checks by closing the isolation valve and reading the meter output — any nonzero reading above 0.5% of full scale triggers an early inspection.
- Maintain a calibration history log with as-found zero drift values — when drift exceeds 1% of full scale at zero, schedule recalibration before the next scheduled interval.
- For multi-gas applications, request a factory-programmed gas conversion factor (GCF) table rather than relying on field-entered correction values — manual GCF errors account for 12% of thermal meter measurement complaints in field service reports.
4. Coriolis Mass Flow Meter Calibration: A Deep Dive
Calibration Principles for Coriolis Technology
Coriolis meters measure mass flow by detecting the Coriolis-induced phase shift in a vibrating tube. The transmitter electronics convert this phase shift to mass flow rate and simultaneously calculate fluid density from the vibration frequency. Three calibration parameters must be managed:
1. Zero-point calibration: The most critical step. With flow completely stopped and the tube full of process fluid, the transmitter must output exactly zero. Any mechanical stress, temperature gradient, or mounting strain that causes tube asymmetry appears as a zero offset. Sincerity Group’s calibration guide notes that re-zeroing is the first action after any installation change, pipeline mechanical work, or temperature upset above 50°C from normal operating range.
2. Vibration frequency for density: The resonant frequency of the vibrating tube changes with fluid density. Calibration of density output requires a reference fluid of known density — typically water at a certified temperature, or a specific process fluid if density accuracy is critical for product quality.
3. Temperature compensation: The tube stiffness changes with temperature, which affects both the phase shift (mass flow) and vibration frequency (density). Temperature compensation coefficients are factory-programmed but should be verified for applications operating significantly outside the normal 15–30°C calibration reference range.
Pre-Calibration Assessment Checklist — Coriolis
- Evaluate the vibration environment: Coriolis meters near reciprocating compressors, mixers, or pumps operating at frequencies within ±20 Hz of the meter’s natural resonant frequency can experience signal interference. This is the leading cause of Coriolis calibration failures in petrochemical plants.
- Inspect tube internals for coating or deposit buildup. A 0.5mm calcium carbonate coating on a DN25 Coriolis tube reduces the effective inner diameter and shifts density readings by 2–4% — which then cascades into mass flow errors if density correction is in use.
- Verify electronic signal integrity: check that the drive coil and pick-off coil resistances are within the manufacturer’s tolerance. Degraded coil resistance is a pre-failure indicator that, if caught during pre-calibration assessment, allows a planned repair versus emergency replacement.
Calibration Methods and Equipment — Coriolis
Coriolis meters for liquid service are calibrated using the gravimetric (weighing) method — fluid is diverted into a weigh tank and mass is measured by a load cell against elapsed time. This achieves reference uncertainties of 0.02–0.05%, well within the 4:1 ratio required relative to the meter’s stated accuracy of ±0.1–0.5%. The ISO 10790:2015 standard governs this process for Coriolis meters specifically.
For gas service Coriolis calibration, gravimetric gas standards or multi-path sonic nozzle arrays are used. Gas Coriolis calibration is significantly more complex and expensive than liquid calibration — factor in a 30–50% cost premium when advising customers on gas-service Coriolis calibration budgets. The ISA InTech Coriolis calibration guide provides an authoritative reference for multi-point calibration protocols and uncertainty budgets.
📹 Watch: How to Calibrate a Coriolis Flow Meter — Step-by-Step
Endress+Hauser’s calibration team demonstrates the Coriolis flowmeter calibration process at their accredited calibration center, covering zero-point procedure, liquid gravimetric calibration, and certificate generation.
Calibration Frequency and Intervals — Coriolis
Coriolis meters in clean liquid service (water, light hydrocarbons, pharmaceutical solvents) are among the most stable flow measurement technologies available. Under controlled conditions, 24-month calibration intervals are achievable and accepted by most regulatory frameworks. The key variable is zero stability — if zero drift exceeds 0.05% of full scale between scheduled calibrations, the interval should be shortened to 12 months.
Coriolis meters in corrosive service (HCl, HF, bleach) or slurry service require 12-month intervals at minimum, with quarterly zero checks. Tube wall thinning from corrosion is not always visible externally — a 5% wall thickness reduction shifts the tube’s resonant frequency and introduces a density error of 0.3–0.8%.
Best Practices for Coriolis Meter Maintenance
- Install vibration isolation mounts if the meter is within 3 meters of rotating equipment. Emerson’s Coriolis installation guide recommends a minimum of 2D pipe supports on each side of the meter, independent of the meter body — not clamped to it.
- Monitor zero stability monthly using the transmitter’s built-in diagnostic. Most modern transmitters (HART, Foundation Fieldbus) output a live zero stability value in engineering units — trending this metric predicts calibration needs 2–3 months in advance with 85% reliability.
- For Coriolis meters with self-verification capability (e.g., Endress+Hauser Heartbeat Technology, Emerson Smart Meter Verification), use the built-in electronic verification every 6 months between wet calibrations. This does not replace wet calibration but extends intervals with documented confidence.

Modern Coriolis transmitter electronics provide live zero stability monitoring and vibration diagnostics — critical for condition-based calibration interval optimization. Image: Unsplash (free to use)
5. Vortex Mass Flow Meter Calibration: A Deep Dive
Calibration Principles for Vortex Technology
Vortex meters count alternating pressure vortices shed from a fixed bluff body (shedder bar) at a frequency defined by the Strouhal number. The relationship between shedding frequency and volumetric flow rate is linear across the meter’s operating range. Converting volumetric flow to mass flow requires real-time density compensation, which introduces additional calibration requirements:
Density compensation methods: Most vortex meters calculate density from measured temperature and pressure using a fluid property model (steam tables for steam, gas law equations for gases). The accuracy of this density calculation depends on the accuracy of the temperature and pressure inputs. A vortex meter measuring steam with a ±2°C temperature sensor error introduces a 0.4% density error — which directly propagates into the mass flow output.
Temperature and pressure correction: At an integrated steel plant, a vortex steam meter was reading 3.2% high after 18 months in service. Investigation revealed that the pressure tap line had a slow blockage from condensate, causing the live pressure reading to read low — which made the steam density calculation too low — which made the mass flow too high. The fix was cleaning the impulse line and recalibrating the pressure transmitter, not recalibrating the vortex meter itself.
Pre-Calibration Assessment Checklist — Vortex
- Inspect the shedder bar and sensor tip for erosion, deposits, or mechanical damage. Even a 0.3mm erosion of the shedder bar’s leading edge shifts the K-factor by 0.5–1.2%. This is permanent — the meter must be replaced, not just recalibrated.
- Check signal strength at low flow using the transmitter’s diagnostic output. A signal-to-noise ratio below the manufacturer’s minimum threshold (typically 3:1) indicates either electrode degradation, excessive background vibration, or insufficient flow velocity for reliable detection.
- Verify installation geometry: confirm that upstream straight-run requirements (typically 15–20D for a 90° elbow, 25–30D for a control valve) have not been compromised by any piping modifications since initial installation.
Calibration Methods and Equipment — Vortex
Vortex meters for liquid service are calibrated similarly to Coriolis — gravimetric or volumetric master meter methods, with reference uncertainties of 0.05–0.2%. For gas and steam service, piston prover systems or bell prover facilities are used for gas, while steam vortex calibration uses saturated steam flow loops at accredited laboratories — a specialized capability available at only a handful of facilities globally. The ASME MFC-6 standard provides guidance on acceptable methods.
A practical alternative for field verification of vortex meters is the clamp-on ultrasonic check — a non-invasive transit-time ultrasonic meter placed temporarily around the same pipe section provides an independent reference for comparison. While not sufficient for formal recalibration, a ±1% agreement confirms the vortex meter is still within specification and can defer the next scheduled lab calibration by 3–6 months.
Calibration Frequency and Intervals — Vortex
According to Zero Instrument’s calibration interval guide, vortex meters in gas or steam service should be calibrated every 18–24 months under standard conditions. For liquid service with clean fluids, 12–18 months is typical. High-temperature steam service (above 300°C) shortens recommended intervals to 12 months because thermal cycling of the piezoelectric sensor accelerates sensitivity loss.
Best Practices for Vortex Meter Maintenance
- In steam applications, always install a condensate pot upstream of the pressure tapping to prevent condensate ingress from blocking impulse lines — the single most common cause of vortex density compensation errors in steam service.
- Monitor signal amplitude trend from the transmitter — a 20% reduction in signal amplitude over 6 months is an early warning of shedder bar fouling or sensor degradation, triggering an inspection before the next scheduled calibration.
- For vortex meters in steam and gas applications, verify both the flow meter K-factor and the pressure/temperature transmitter accuracy during each calibration event — separating these calibrations is a common oversight that invalidates the mass flow measurement accuracy claim.
6. Comparative Calibration Requirements Matrix
Side-by-Side Technology Comparison
Thermal
Coriolis
Vortex
📊 Recommended Calibration Intervals by Technology & Service Condition
Months between calibrations — Standard (clean process) vs. Harsh (contaminated, high-temp, corrosive) conditions
Source: Zero Instrument calibration interval guide; Teledyne Hastings thermal calibration blog; ISA InTech Coriolis calibration; IFM vortex troubleshooting guide. Intervals are typical industry ranges and vary by application severity.
🥧 5-Year Calibration Cost Distribution: Coriolis vs. Thermal vs. Vortex
Percentage of total 5-year calibration TCO by cost category (typical industrial plant, 20 meters)
Based on a 20-meter plant with mixed technology inventory. Downtime cost assumes $800/hr production loss for each 8-hr calibration event requiring process shutdown.
Source: Industry data compiled from Flowell calibration cost report; Zero Instrument calibration guides; ISA InTech. Percentages are illustrative industry benchmarks — actual values vary by facility size and application.
7. Calibration Best Practices Across All Technologies
Pre-Calibration Planning and Preparation
A calibration event that isn’t properly planned costs twice: once for the calibration itself and again for the rework when conditions weren’t correctly reproduced. The following sequence applies regardless of technology:
-
1
Process isolation and LOTO: Confirm lockout/tagout procedures are in place. For thermal meters on flammable gas lines, purge the meter body with inert gas before disconnection. For Coriolis and vortex meters on steam lines, allow full cooldown to below 60°C before handling — thermal shock during removal is a leading cause of tube damage.
-
2
Document baseline performance: Record the as-found zero reading, span reading at a known flow reference (if available in-line), and any diagnostic alarms active at the time of removal. This “as-found” data is mandatory for ISO/IEC 17025 compliant calibration certificates and tells you whether the meter was within spec or how far it had drifted.
-
3
Select calibration equipment to match uncertainty requirements: The reference standard must have a combined uncertainty of ≤¼ of the meter’s stated accuracy (the 4:1 test uncertainty ratio). Calibrating a 0.2% Coriolis meter against a 0.15% master meter violates this ratio and invalidates the calibration for custody-transfer purposes.
-
4
Confirm environmental conditions: Calibrate at (or correct to) process operating temperature. For thermal meters specifically, the calibration fluid temperature should match the process gas temperature within ±5°C; larger deviations require explicit correction factors that must be documented in the calibration certificate.
During Calibration: Critical Steps
The minimum calibration point set for industrial mass flow meters is five flow rates: 10%, 25%, 50%, 75%, and 100% of full scale. This catches both low-flow bias (often from zero offset) and high-flow span errors (often from fouling or mechanical wear). Single-point calibration is acceptable only for process monitoring applications with ±5% accuracy requirements — never for billing, custody transfer, or pharmaceutical batch records.
Distributor Sales Tip: Customers who complain about “inconsistent readings” at low flow almost always have a zero offset problem — not a span problem. Asking them to close the isolation valve and read the meter at zero flow immediately confirms or rules out this cause. This diagnostic takes 2 minutes and costs nothing — building this into your technical support process turns a complaint call into a customer confidence moment.
Post-Calibration Verification and Documentation
The calibration certificate must contain: the as-found readings (before adjustment), the as-left readings (after adjustment), the reference standard’s certificate number and its uncertainty, the calibration date, ambient temperature and humidity, the calibration method used, and the calibrating technician’s identification. For ISO/IEC 17025 compliance, the certificate must include a statement of measurement uncertainty — not just a pass/fail statement. For detailed guidance on calibration setup, documentation, and troubleshooting, the Jade Ant Instruments sensor calibration setup guide provides step-by-step documentation templates applicable to all meter technologies.
8. Common Calibration Challenges and Solutions
| Challenge | Most Affected Technology | Root Cause | Practical Solution | Cost Impact |
|---|---|---|---|---|
| Field traceability gaps | All | Remote sites without accredited lab access | Mobile calibration van services; portable sonic nozzle reference kits; document uncertainty budget explicitly | +30–50% vs. lab cal. |
| Gas composition drift (Thermal) | Thermal | Process gas composition changes between calibrations | Implement gas chromatograph on process line; use multigas conversion tables; recalibrate when composition changes >2% | $800–$2,000/event |
| Cryogenic service calibration | Coriolis | LN₂, LO₂ service at −196°C — few labs can calibrate at process temperature | Factory calibration at cryogenic conditions; verify zero at operating temperature after installation; re-zero annually | $1,500–$4,000/event |
| Minimum flow detection (Vortex) | Vortex | Below the minimum detectable Reynolds number, output is zero or random | Resize meter to smaller bore; replace vortex with thermal (gas) or Coriolis (liquid); document operating range limits | Meter replacement cost |
| Calibration downtime cost | All | Process shutdown required for lab pull | Install bypass loop with isolation valves; keep one spare meter per critical measurement point; use in-situ verification to extend intervals | Bypass: $400–$800 installed |
| Vibration interference (Coriolis) | Coriolis | Pipeline vibration at frequencies near meter resonance | Add vibration isolation mounts; change mounting location; upgrade to dual-drive Coriolis design; add vibration isolation pads on adjacent equipment | $200–$1,200/location |

Industrial gas pipeline systems with multiple measurement points — thermal mass flow meters in gas service must be calibrated with process-specific gas at the correct operating temperature and pressure. Image: Unsplash (free to use)
9. Technology-Specific Calibration Troubleshooting Guide
Thermal Meter Troubleshooting
The most common service call for thermal meters is “reading is too high at low flows.” In 70% of cases, this is not a calibration issue — it is a zero drift from sensor contamination or a grounding problem. The correct diagnostic sequence is: (1) isolate flow and check zero output; (2) clean sensor element with IPA wipe; (3) re-check zero; (4) if zero is now correct, re-run a field span check at 50% of full scale. If the span also corrects, the meter is serviceable without a formal recalibration.
Temperature compensation errors appear as a systematic bias across all flow points that reverses sign when ambient temperature shifts — for example, the meter reads 2% high in summer and 1% low in winter. This indicates the internal temperature compensation coefficients are out of range and requires factory recalibration to correct the polynomial correction curve.
Coriolis Meter Troubleshooting
Vibration-induced measurement errors in Coriolis meters produce erratic, noisy outputs rather than a consistent offset. The key diagnostic is to compare the meter’s output during normal operation with the output when all vibration sources (pumps, compressors, agitators) are stopped — if the reading stabilizes significantly, the vibration source must be addressed before recalibration will hold.
Zero stability issues in Coriolis meters are typically confirmed by performing a zero calibration with the line fully stopped and full of process fluid — if the new zero value differs from the factory zero by more than 0.05% of full scale, internal inspection for tube coating or corrosion is recommended before proceeding. Monitoring the Coriolis flow meter’s density output trend also helps detect tube coating — density reading 0.5–2% above the known fluid density is a reliable indicator of tube fouling.
Vortex Meter Troubleshooting
Signal loss or erratic output in vortex meters below 30% of rated flow is normal — it does not indicate a calibration problem, it indicates operation below the minimum Reynolds number. The Soaring Instrument vortex troubleshooting guide confirms that the first diagnostic step is verifying that flow velocity exceeds the manufacturer’s minimum with a separate pressure or temperature measurement. True calibration problems in vortex meters present as a consistent K-factor shift across all flow points above the minimum — typically caused by shedder bar erosion or buildup.
10. Future Trends and Emerging Calibration Technologies
Digital Transformation in Calibration Management
The flowmeter calibration market is growing at 11.4% CAGR through 2029 according to Technavio — driven largely by adoption of cloud-based calibration management systems and IIoT-enabled predictive maintenance. For distributors, this trend represents both a service opportunity and a competitive pressure: customers increasingly expect calibration reminders, digital certificates, and condition-based interval recommendations as part of a meter supply relationship.
Predictive maintenance platforms are beginning to integrate directly with transmitter HART/Foundation Fieldbus diagnostic outputs — analyzing zero stability trends, signal quality trends, and temperature compensation deviations to predict when recalibration will be needed with 60–90 day advance notice. A 2025 MDPI study found that IoT-enabled predictive maintenance systems can reduce unplanned downtime by 30–50% and cut calibration labor costs by 20–35% compared to time-based scheduling.
Advanced Calibration Methods
In-situ verification without process disruption — already available on premium Coriolis and electromagnetic meters via electronic self-verification — is extending to thermal and vortex meters. Machine learning models trained on historical drift patterns from large installed fleets are beginning to generate individualized calibration interval recommendations based on each meter’s specific operating history, rather than generic manufacturer intervals. This capability, currently available only through a few specialist providers, will become a standard distributor service offering within 3–5 years.
Regulatory Evolution
The EU’s Measuring Instruments Directive (MID) revisions expected in 2026–2027 will require digital traceability records for custody-transfer meters — eliminating paper calibration certificates as the primary compliance document. Customers in regulated industries should be advised now to adopt CMMS or digital calibration management systems that generate structured, auditable calibration records compatible with electronic reporting requirements. Distributors who can offer a digital calibration management service alongside meter supply will have a material competitive advantage over pure product resellers.

Cloud-based calibration management systems are replacing paper certificates — distributors who integrate digital calibration tracking into their service offering gain a strong retention advantage with industrial customers. Image: Unsplash (free to use)
Glossary of Key Calibration Terms
Zero Drift
A nonzero measurement output when the actual flow rate is zero. Caused by sensor fouling, mechanical stress, or electronic aging. Directly biases all readings across the entire flow range.
Example: A Coriolis meter showing 0.8 kg/hr with the isolation valve fully closed has a zero drift of 0.8 kg/hr — every “real” measurement is biased by exactly that amount.
K-factor
The number of output pulses per unit volume or mass generated by a flow meter. Factory-calibrated; changes permanently if the primary element (rotor blades, shedder bar) is mechanically altered.
Example: A vortex meter with K = 152 pulses/litre will generate 1,520 pulses for 10 litres of flow. Erosion of the shedder bar that shifts K to 148 will cause all readings to be 2.6% high.
Test Uncertainty Ratio (TUR)
The ratio between the meter’s stated accuracy and the calibration reference standard’s uncertainty. ISO/IEC 17025 requires a minimum TUR of 4:1 to produce a credible calibration certificate.
Example: A meter with ±0.5% accuracy requires a reference standard with ≤±0.125% uncertainty. Using a ±0.3% reference (3.3:1 TUR) does not meet the 4:1 requirement.
As-Found / As-Left Data
The meter’s measurement performance recorded before (as-found) and after (as-left) calibration adjustments. Mandatory for ISO/IEC 17025 certificates; enables drift rate calculation for interval optimization.
Example: As-found shows +1.8% error at 50% flow; as-left shows +0.2%. The 1.6% drift in 18 months suggests the next interval should be shortened to 12 months.
Gas Conversion Factor (GCF)
A correction multiplier applied to thermal flow meter readings when the actual process gas differs from the gas used during factory calibration. Calculated from specific heat, thermal conductivity, and density ratios.
Example: A thermal meter calibrated on nitrogen (GCF = 1.000) reading argon without a GCF correction will over-read by ~34% because argon has ~40% lower specific heat than nitrogen.
Strouhal Number (St)
A dimensionless number that defines the relationship between vortex shedding frequency, fluid velocity, and bluff body dimensions. Typically ~0.2 for well-designed vortex meters across the operating Reynolds number range.
Example: A shedder bar 15mm wide in 2 m/s flow sheds vortices at ~26.7 Hz (St = 26.7 × 0.015 / 2 = 0.2). Doubling flow to 4 m/s doubles the frequency to ~53.4 Hz.
5-Year Total Cost of Ownership: Calibration Comparison
For a single DN50 industrial flow meter under standard service conditions (12 calibration events over 5 years for thermal/vortex, 6 for Coriolis), the total calibration-related TCO breaks down as follows. These figures include service fees, mobilization, estimated downtime costs at $800/hr, and documentation overhead:
📊 5-Year Calibration TCO Per Meter: Thermal vs. Coriolis vs. Vortex
USD — Based on standard industrial service conditions, 20-meter plant fleet
Year 1 Calibration Cost (USD)
5-Year Cumulative Calibration TCO (USD)
Source: Industry calibration cost data from Flowell, Zero Instrument, ISA InTech, and Technavio market reports. Figures include service fees ($300–$800/event), downtime ($800/hr × 4hr average), and documentation overhead. Actual costs vary by geography, plant configuration, and service provider.
Key Insight for Distributors: Despite its higher per-event calibration cost, Coriolis has the lowest 5-year calibration TCO among the three technologies under standard service conditions — because its 24-month interval means only 3 calibration events in 5 years versus 5 for vortex (18-month) and 5 for thermal (12-month). This is a compelling argument for upgrading customers from thermal or vortex to Coriolis in high-criticality applications where annual calibration costs are a budget pain point.

Modern automated calibration facilities use gravimetric weighing systems to calibrate Coriolis meters with reference uncertainties as low as 0.02% — setting the standard for custody-transfer mass flow measurement accuracy. Image: Unsplash (free to use)
Comprehensive Calibration Data Table (Excel-Ready)
The table below is formatted for direct copy-paste into Excel or Google Sheets as a working calibration management tool. Distributors can adapt this as a customer-facing resource for calibration planning and budget preparation:
| Paramètre | Thermal Mass Flow | Coriolis Mass Flow | Débitmètre à vortex |
|---|---|---|---|
| Principe de mesure | Heat transfer (CT or CP method) | Coriolis phase shift + vibration frequency | Von Kármán vortex shedding |
| Direct Mass Flow? | Yes (for gas) | Yes (liquid and gas) | No (volumetric + density compensation) |
| Typical Accuracy | ±1–2% FS | ±0.1–0.5% reading | ±0.75–1.5% reading |
| Standard Cal. Interval | 12–24 months | 24–36 months | 18–24 months |
| Harsh Service Cal. Interval | 6–12 months | 12 months | 6–12 months |
| Avg. Service Fee (Standard) | $300–$600 | $400–$800 | $250–$500 |
| 5-Year Cal. TCO (Standard) | ~$8,250 | ~$6,600 | ~$5,120 |
| Primary Drift Mechanism | RTD aging, sensor fouling, GCF mismatch | Zero instability, tube coating, vibration | Shedder erosion, PT compensation error |
| Field Calibration Feasible? | Yes (portable gas standards) | Zero only (full wet cal requires lab) | Yes (clamp-on ultrasonic reference) |
| Calibration Standard | ISO 6358, NIST gas standards | ISO 10790, API MPMS Ch. 5 | ASME MFC-6, ISO 7145 |
| Required Lab Accreditation | ISO/IEC 17025 (gas flow) | ISO/IEC 17025 (liquid or gas) | ISO/IEC 17025 (liquid, gas, or steam) |
| Custody Transfer Suitable? | No (gas monitoring only) | Yes (API MPMS, OIML) | Gas only (AGA-7 for natural gas) |
| Min. Calibration Points | 5 (10%, 25%, 50%, 75%, 100% FS) | 5 (same) | 5 (same, above Remin) |
| Self-Verification Available? | Limited (zero check only) | Yes (electronic verification) | Signal amplitude monitoring |
| Recommended Spare Strategy | 1 spare per 10 meters | 1 spare per 5 critical meters | 1 spare per 8 meters + shedder bar stock |
| Zero Drift Alert Threshold | >0.5% FS triggers early inspection | >0.05% FS triggers early inspection | N/A (vortex has no zero drift; monitor signal strength) |
| Jade Ant Resource | Thermal air flow meter guide | Coriolis sizing & selection guide | Vortex steam & gas guide |
Ready to Master Mass Flow Meter Calibration?
Build your calibration expertise and give customers the technical confidence they need — backed by real industry data, not manufacturer marketing.
Frequently Asked Questions (15 FAQs)
Thermal meters typically require calibration every 12–24 months, depending on application severity, fluid contamination levels, and regulatory requirements. High-contamination environments — compressor discharge with oil mist, reactive semiconductor gases — may require annual calibration or shorter. Clean dry nitrogen or instrument air applications can extend to 24 months. Regular zero drift monitoring (monthly zero-flow check with isolation valve closed) can help optimize intervals: if zero drift exceeds 0.5% of full scale, schedule an early recalibration regardless of interval timing.
Coriolis meters require calibration of their vibration frequency (for density), zero-point stability (for mass flow), and temperature compensation coefficients — making it a multi-parameter calibration process per ISO 10790. Vortex meters calibrate primarily the K-factor (shedder bar geometry versus output frequency), plus separately the pressure and temperature transmitters used for density compensation. Coriolis calibration is typically more complex and 30–50% more expensive per event, but Coriolis meters generally hold calibration longer — 24+ months versus 18–24 months for vortex. The critical failure mode also differs: Coriolis drifts from zero instability; vortex drifts from shedder bar physical change.
Yes — thermal meters can be field-calibrated using portable sonic nozzle gas standards or laminar flow element (LFE) reference kits, provided the calibration gas species and conditions match the process gas exactly. A field zero-check with isolation valve closed is always feasible and takes 2 minutes. However, bench calibration in a controlled laboratory environment provides superior accuracy (±0.1–0.25% reference uncertainty versus ±0.5–1% for field portable standards). Field calibration is appropriate for quick verification and zero adjustment; it may not meet all regulatory documentation requirements for custody-transfer or FDA-regulated pharmaceutical applications without explicit uncertainty statement and method documentation.
Traceability establishes an unbroken chain of calibrations from your flow meter back to a national metrology standard — NIST in the US, PTB in Germany, NPL in the UK. Each link in that chain has a documented uncertainty. ISO/IEC 17025 accreditation ensures that the calibration laboratory maintains this chain with rigorous methodology. For distributors: always verify that calibration service providers hold ISO/IEC 17025 accreditation with a scope that explicitly covers your meter’s technology (gas, liquid, mass flow), flow range, and the calibration fluid used. A certificate stating “NIST-traceable” without accreditation provides no assurance about the calibration process quality — only about the reference instrument quality.
Temperature affects each technology differently. Thermal meters have the strongest sensitivity: a 10°C ambient temperature change shifts the sensor temperature differential reading by 0.3–0.8% depending on the heater design, so calibrating at 20°C and operating at 60°C introduces a systematic bias unless the meter has a temperature correction table covering that range. Coriolis meters require temperature compensation for both tube stiffness (affects phase shift / mass flow) and resonant frequency (affects density) — factory compensation curves are accurate to ±0.15°C, so operating outside the calibration temperature range by more than ±30°C warrants recalibration. Vortex meters need temperature correction primarily through the density compensation calculation (steam tables or gas law) — temperature sensor accuracy directly determines mass flow accuracy.
Service fee ranges for a single calibration event: Thermal $300–$600; Coriolis $400–$800; Vortex $250–$500, with all figures depending on meter size, complexity, and calibration facility location. Coriolis is generally the most expensive per event due to multi-parameter verification requirements. However, over a 5-year period, Coriolis often has the lowest total calibration cost because its longer 24-month interval means fewer events — approximately $6,600 versus $8,250 for thermal and $5,120 for vortex (based on standard industrial service conditions). Bulk calibration service contracts with accredited labs can reduce per-unit costs by 15–25% for distributors managing large customer fleets — negotiating a standing service agreement is worth pursuing once you have 10+ meters across your customer base.
Application severity matters more than technology type, but thermal meters in contaminated gas service (oil mist, reactive gases, high humidity) typically require the most frequent calibration — sometimes every 6 months — because sensor contamination accumulates faster than drift in Coriolis or vortex designs. Vortex meters in high-temperature steam service follow closely, with 12-month intervals recommended due to accelerated piezoelectric sensor aging above 300°C. Coriolis meters in clean liquid service can often extend to 30+ months between formal wet calibrations, supported by periodic electronic self-verification.
Service providers should maintain ISO/IEC 17025:2017 accreditation with a scope that covers your specific meter technologies, fluid types, and flow ranges. Verify their NIST (or equivalent national metrology institute) traceability chain is current — accreditation renewal is annual and scope certificates can have gaps. Industry-specific additions: API MPMS for oil and gas custody transfer; ASME certification for steam and high-pressure applications; FDA 21 CFR Part 11 compliance for pharmaceutical clients requiring electronic audit trails. Request the provider’s scope of accreditation document (not just the accreditation certificate) and confirm your specific meter brand/model and fluid combination is within their tested scope — broad “mass flow meter” accreditation may exclude your specific technology or range.
No — thermal meters require specific calibration gases that exactly match process conditions, because the measurement principle depends directly on the thermal properties (specific heat, thermal conductivity) of the gas. Calibrating with nitrogen but operating on argon introduces a 34% systematic error without applying the correct Gas Conversion Factor (GCF). Coriolis and vortex meters for gas service are less sensitive to gas type but still require density corrections — calibrating with nitrogen (density 1.251 kg/m³ at STP) then measuring methane (density 0.716 kg/m³) without updating the density model introduces a ~43% volumetric error. Always consult manufacturer specifications for each meter type and confirm calibration gas requirements before engaging a calibration laboratory for a multi-technology fleet calibration event.
Zero drift is the unintended measurement output at zero actual flow — indicating that the meter’s reference (zero) point has shifted from its calibrated position. It is critical because zero drift adds a fixed systematic error to every measurement across the entire flow range: a +0.5% FS zero drift means every reading is biased by +0.5% FS, regardless of the actual flow. For thermal meters, zero drift usually indicates sensor fouling or grounding issues. For Coriolis meters, it indicates mechanical stress, tube coating, or temperature gradient asymmetry. Monitoring zero drift monthly by closing isolation valves and recording the transmitter output is the most cost-effective calibration management action available — it catches problems 2–3 months before they exceed accuracy limits, allowing planned correction rather than emergency recalibration.
Watch for these hardware and process indicators: sudden measurement step-changes following a process upset (water hammer, thermal shock, pump cavitation); zero drift exceeding 0.5% FS for thermal, 0.05% FS for Coriolis, or complete signal dropout for vortex; inconsistency between the meter reading and a mass balance check from upstream/downstream instrumentation; diagnostic alarms flagged in HART or Foundation Fieldbus (NAMUR NE 107 “Maintenance Required”); or repeated batch quality rejections that correlate with flow measurement values. Establishing baseline performance data at commissioning — including as-found zero, as-found span at 50% FS, and diagnostic signal amplitudes — is essential for detecting deviations that justify emergency action versus normal interval recalibration.
Bench calibration removes the meter to a controlled laboratory environment where a traceable reference standard (gravimetric weigh tank, sonic nozzle array) provides the comparison signal. This achieves the lowest achievable uncertainty (0.02–0.1%) and is the only method acceptable for custody-transfer certification. In-situ calibration leaves the meter installed in the process and introduces a portable reference — typically a clamp-on ultrasonic meter or a master meter in a bypass loop — for comparison. In-situ achieves 0.2–0.5% reference uncertainty, reduces process downtime from days (bench) to hours, and is suitable for confirming performance between scheduled bench calibrations. Most industrial programs use bench calibration for primary certification and in-situ verification at the midpoint of the calibration interval — a cost-effective combination that maintains compliance while minimizing downtime.
Contamination is the primary accelerant of calibration drift. For thermal meters, even a transparent oil film 10 microns thick on the sensor surface reduces heat transfer efficiency and introduces a 0.5–2% positive flow bias — the meter reads high because the oil insulates the sensor and increases the apparent temperature differential. For vortex meters, calcium carbonate or iron oxide deposits on the shedder bar change its effective width and shift the K-factor permanently. For Coriolis meters, coating on tube internals shifts the resonant density measurement and, in severe cases, blocks the tube with visible pressure drop increase. Implementing upstream filtration (5-micron coalescing filter for gas; Y-strainer for liquids), conducting quarterly visual inspections of accessible meter bodies, and maintaining fluid quality records reduces calibration frequency requirements and extends meter service life significantly.
Maintain calibration certificates containing: as-found and as-left measurement data for each calibration point; the reference standard’s identification, uncertainty statement, and its own current calibration certificate number; ambient temperature, pressure, and humidity at the time of calibration; calibration method description; calibrating technician’s identity and qualifications; date and location; and the meter’s unique tag/serial number. Regulatory record retention requirements vary: pharmaceutical (FDA 21 CFR Part 11) typically requires 3 years minimum post-batch release; oil and gas custody transfer (API MPMS) requires records for the life of the meter plus 2 years; ISO 9001 quality systems require records for the calibration interval duration plus one additional interval. Digital calibration management systems (CMMS) that generate structured, time-stamped records are strongly recommended — paper-based systems are increasingly rejected during audits due to the difficulty of demonstrating chain of custody.
Predictive maintenance replaces fixed-interval scheduling with condition-based decisions. By trending zero drift, signal amplitude, and diagnostic output from HART or Fieldbus-connected meters, calibration needs can be predicted 30–90 days in advance with 60–85% accuracy — allowing planned shutdowns rather than emergency interventions and eliminating unnecessary calibrations on meters that are still within specification. A 2025 MDPI study found that IoT-enabled predictive maintenance programs reduce unplanned downtime by 30–50% and cut calibration labor costs by 20–35%. Practically: Thermal meters benefit most from RTD resistance trending; Coriolis from zero stability and drive gain monitoring; vortex from signal-to-noise ratio trending. The Jade Ant Instruments sensor calibration setup guide includes a monitoring checklist that distributors can provide to customers as a starting point for condition-based calibration programs.