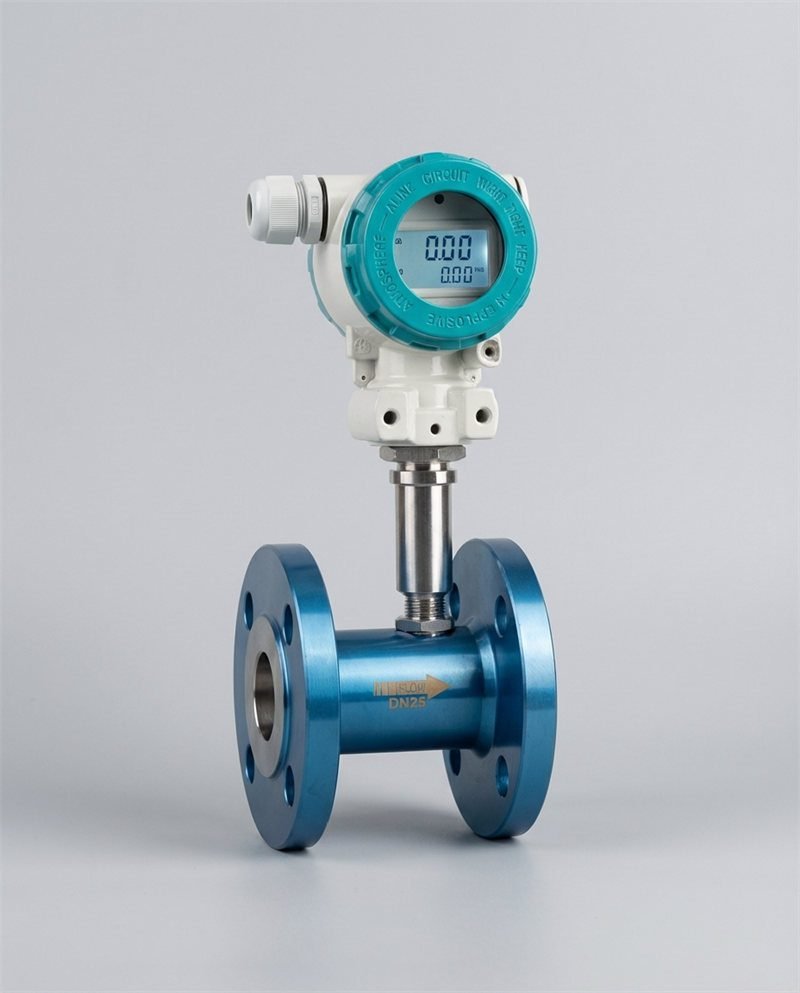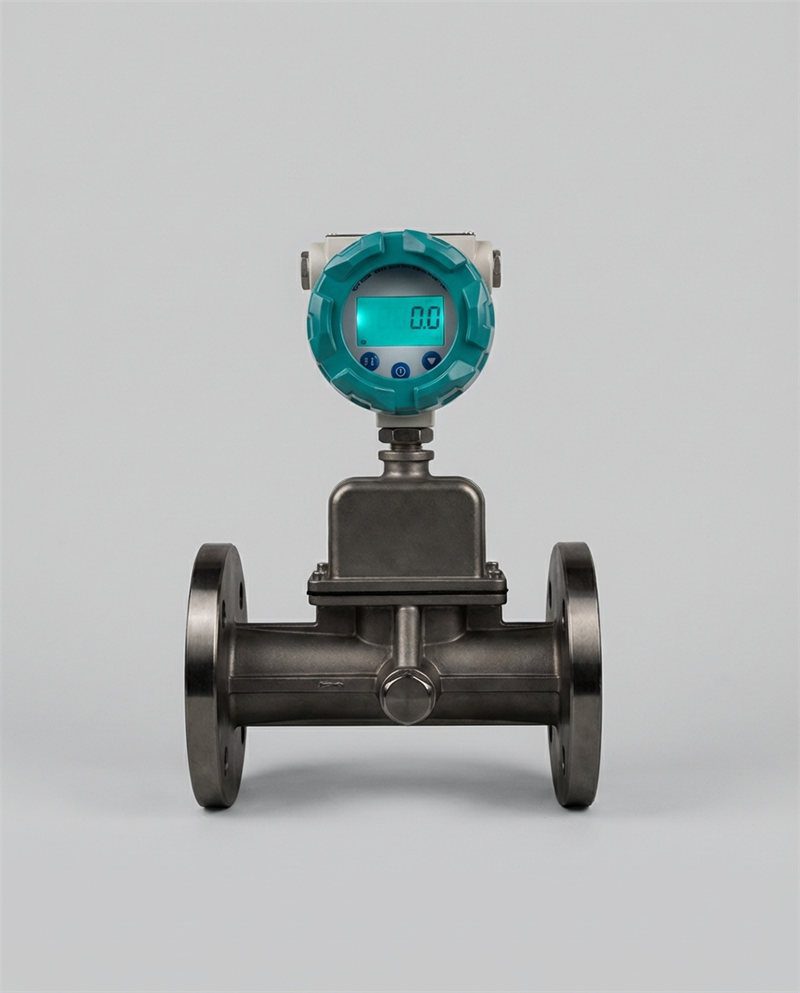

Make informed purchasing decisions with this comprehensive guide designed specifically for B2B distributors and flow instrumentation agents. Learn how to evaluate ultrasonic technology, compare leading manufacturers, and select the right solution for your clients’ applications.

The global ultrasonic flow meter market is valued at over USD 2.08 billion in 2025 and is projected to reach USD 3.56 billion by 2032, growing at a CAGR of approximately 7%.
Why Ultrasonic Flow Meters Matter for Your Business
In industrial flow measurement, two things drive technology decisions more than anything else: the cost of getting it wrong, and the lifetime cost of maintaining what you install. A 1% measurement error on a crude oil transfer line carrying 50,000 barrels per day translates to roughly $35,000 in unaccounted product every 24 hours. A mechanical turbine meter on a corrosive chemical line requiring annual bearing replacement adds $1,500–$3,000 in service labor every year, before unplanned failure costs are counted. These are the real conditions under which ultrasonic flow meters have steadily displaced older technologies across process industries — and they are the conditions your clients’ engineers think about every time they evaluate a new meter.
For distributors and agents operating in flow instrumentation, understanding ultrasonic technology in depth is not just a product knowledge exercise — it is a commercial advantage. The ability to explain precisely why a transit-time clamp-on outperforms a turbine meter on a particular client’s chemical plant header, or why a multi-path inline meter is the correct specification for an oil terminal’s custody transfer application, is what separates a trusted technical partner from a transactional vendor.
This guide covers everything from the physics of sound propagation in pipes to manufacturer comparisons, installation specifications, integration protocols, and ROI calculation models. Each section is grounded in real application data and industry standards, not marketing language.
1. Understanding Ultrasonic Flow Meter Technology: The Foundation
How Ultrasonic Flow Meters Work: Core Principles Explained
An ultrasonic flow meter measures fluid velocity by exploiting the physics of sound propagation in moving media. Two piezoelectric transducers are positioned on opposite sides of the pipe — either clamped to the outside wall or mounted as wetted elements inside the flow stream — and send ultrasonic pulses diagonally across the pipe bore, alternating between upstream and downstream directions.
The core measurement is straightforward: when fluid is stationary, a pulse travelling from Transducer A to Transducer B takes exactly the same time as a pulse travelling in the reverse direction. When fluid moves, the pulse travelling with the flow arrives slightly earlier, and the pulse travelling against the flow arrives slightly later. This time difference — denoted as Δt (delta-t) — is directly proportional to the average fluid velocity along the acoustic path, which is then multiplied by the pipe’s known cross-sectional area to yield volumetric flow rate.
Where Q is the volumetric flow rate, A is the pipe cross-sectional area, Δt is the transit-time difference, and k is a calibration constant accounting for acoustic path geometry. The elegance of this method is that it contains no moving parts, no pressure-sensing orifices, and — in the clamp-on configuration — no process contact whatsoever.
The Doppler Effect and Transit-Time Methods: What’s the Difference?
These two measurement principles sit within the same ultrasonic family but serve fundamentally different fluid conditions, and confusing them is one of the most common specification mistakes in the industry.
Transit-time ultrasonic meters measure the time difference between upstream and downstream acoustic pulses traveling through the bulk fluid itself. They require the fluid to be acoustically transparent — meaning clean, homogeneous liquids or gases with minimal suspended solids or gas bubbles that would scatter the signal. Transit-time is the dominant technology for clean water, chemicals, petroleum products, natural gas, and virtually all clean-fluid custody transfer applications. Accuracy in well-specified installations reaches ±0.15% to ±0.5% for multi-path inline meters, and ±1.0% to ±2.0% for single-path clamp-on units.
Doppler ultrasonic meters emit a continuous ultrasonic beam and measure the frequency shift of signals reflected back from particles or bubbles moving with the flow — the same physical principle that makes a police radar gun work on a moving car. Crucially, Doppler meters require reflectors in the fluid — suspended solids, entrained gas bubbles, or droplets — to function. This makes them the correct tool for activated sludge (2–8% solids), mining slurries (15–45% by weight), paper pulp, and wastewater streams where transit-time signals are scattered beyond usefulness. Typical accuracy is ±2% to ±5%, which is adequate for process monitoring but not for custody transfer.
| 特徴 | Transit-Time | Doppler |
|---|---|---|
| Fluid requirement | Clean, homogeneous | Dirty, particle-laden |
| Typical accuracy | ±0.15% to ±2% | ±2% to ±5% |
| Custody transfer | Yes (multi-path inline) | いいえ |
| Slurry applications | 限定 | はい |
| Price tier | Mid to premium | Economy to mid |
| Best for | Water, gas, chemicals, petroleum | Wastewater, slurries, pulp |
Key insight for distributors: A surprisingly high percentage of field specification errors involve applying transit-time to slightly contaminated fluids or Doppler to clean-fluid applications. Asking a client the three key questions — “What is the fluid? What is the approximate solids or gas content? What accuracy is required?” — immediately clarifies which technology belongs on the purchase order.
Key Technical Specifications You Need to Know
When evaluating ultrasonic meters for your portfolio or advising clients on procurement, seven specifications define the functional envelope of any product:
Accuracy class is expressed as a percentage of reading (e.g., ±0.5% of rate) or percentage of full-scale. “Of reading” specifications are more meaningful for variable-flow applications — a ±0.5% of reading meter maintains that accuracy from 10% to 100% of full-scale, while a ±0.5% of full-scale meter can deliver 5% effective error at 10% flow. Always check which basis a manufacturer uses.
再現性 indicates how consistently the meter reproduces the same reading for the same flow condition. For custody transfer applications, repeatability matters more than absolute accuracy — a meter that is consistently 0.3% high can be corrected with a calibration factor; a meter that varies ±1.5% around its true reading cannot. Transit-time meters typically achieve repeatability of ±0.1% to ±0.2%.
Turndown ratio (rangeability) defines the ratio between the maximum and minimum flow rates the meter measures accurately. A 100:1 turndown ratio means a meter rated to 10 m/s still meets its accuracy specification at 0.1 m/s. Most transit-time meters achieve 100:1 to 300:1 — far exceeding orifice plates (typically 3:1 to 5:1), which makes ultrasonic meters significantly more versatile for processes with variable demand.
Operating temperature range affects both transducer selection and coupling compound specification. Standard clamp-on meters cover –20°C to 160°C; high-temperature variants with waveguide transducers extend to 250°C or higher. Always verify the transducer temperature rating separately from the transmitter rating — these are often different.
IP (Ingress Protection) rating determines whether the electronics can survive the installation environment. IP67 (dust-tight, immersible to 1m) is the minimum for most outdoor or process plant locations; IP68 and NEMA 4X are required for washdown and submersible applications.
Communication protocol determines integration with existing control infrastructure. The standard set for industrial meters includes 4–20 mA analog, HART 7, Modbus RTU/TCP, and PROFIBUS. Premium meters add PROFINET, Foundation Fieldbus, and wireless (WirelessHART/ISA100).
Hazardous area certification — ATEX/IECEx for European and international markets, FM/CSA for North American markets — is non-negotiable for any installation in classified areas. Confirm zone or division rating, gas group, and temperature class before specifying.
Advantages of Ultrasonic Technology Over Traditional Flow Meters
Non-Invasive Installation and Minimal Pressure Drop
This is the specification advantage that wins the most commercial conversations. Clamp-on ultrasonic meters install on the outside of existing pipe — no cutting, no welding, no process isolation required. A two-person crew completes a typical DN200 installation in under 90 minutes, compared to the 2–3 day planned shutdown a spool-piece inline meter typically requires on an active process line.
The pressure drop argument is equally clear. Differential pressure (DP) flow meters — orifice plates, venturis, annubars — create a permanent obstruction in the flow path. On a large industrial header, the pressure drop across an orifice plate can represent 5–15% of pump operating energy. On a 75 kW process pump running 8,760 hours per year at $0.10/kWh, a 10% pump efficiency penalty costs $6,570 per year — every year — as a direct consequence of the measurement device. Ultrasonic meters produce zero permanent pressure loss. For energy-intensive clients in chemicals, water treatment, or district energy, this single factor can justify the entire capital cost within 12–24 months.

Cost Efficiency and Long-Term ROI for Your Clients
The 10-year total cost of ownership (TCO) comparison below is based on DN100 process liquid service, using compiled industry maintenance records and manufacturer lifecycle data. It illustrates a pattern that repeats consistently across industrial sites: the higher purchase price of a quality ultrasonic meter is typically recovered within 2–4 years through avoided maintenance alone, before energy savings and downtime avoidance are factored in.
| Cost Element | クランプオン超音波 | タービン式流量計 | オリフィスプレート (DP) |
|---|---|---|---|
| 購入価格 | $3,500–$8,000 | $1,500–$4,000 | $800–$2,500 |
| Installation (labor) | $500–$1,500 | $1,500–$3,500 | $1,000–$2,500 |
| Annual energy penalty | $0 | $500–$1,500 | $3,000–$8,000 |
| Maintenance (10-yr) | $200–$500 | $8,000–$18,000 | $4,000–$10,000 |
| Unplanned failure risk | Very low | Moderate–high | Low–moderate |
| 10-year TCO (est.) | $8,000–$15,000 | $25,000–$45,000 | $45,000–$95,000 |
Sources: Compiled from manufacturer lifecycle studies, industry TCO benchmarks, and field maintenance records. DP orifice TCO includes pumping energy cost.
Limitations and Considerations in Ultrasonic Measurement
Fluid Characteristics That Affect Accuracy
Transit-time accuracy degrades progressively as fluid cleanliness decreases. A clamp-on meter on a well-maintained DN200 carbon steel pipe carrying clean water typically delivers ±1.0%–1.5% of reading. The same unit on a pipe with 15%+ wall corrosion variation, an air-gap rubber lining, or a bitumen coating may deliver ±3%–5% or fail to acquire a signal at all. The practical rule: any clamp-on meter specification on aging municipal or industrial piping should be preceded by a pipe condition survey using ultrasonic wall thickness measurement tools.
Fluid viscosity affects velocity profile and therefore measurement accuracy. Transit-time meters calibrated in water produce errors when measuring high-viscosity fluids (>200 cSt) unless the meter includes viscosity correction algorithms or is specifically calibrated for the target fluid. Temperature also shifts acoustic velocity — a 60°C rise in water temperature increases sound velocity by approximately 5%, producing a proportional reading error without temperature compensation. All quality meters include active temperature compensation, but verify this is factory-calibrated and not just a software toggle.
Environmental Factors and Installation Requirements
Clamp-on meters are sensitive to vibration at the pipe. Pumps, compressors, and valve actuation all introduce vibration signals that can be misread as flow by less sophisticated signal processing electronics. Always verify that the selected meter has adequate vibration rejection — check whether the manufacturer publishes a vibration immunity specification, and install the meter at the maximum practical distance from vibration sources.
Electromagnetic interference (EMI) from variable frequency drives (VFDs), high-current cables, and welding equipment can corrupt the low-voltage electronic signals in clamp-on transducer cables. Use shielded transducer cables, maintain physical separation from EMI sources, and ground the meter correctly. Sites with high VFD density — common in modern pump stations and compressor halls — should be assessed during pre-installation survey for EMI levels.
2. Types of Ultrasonic Flow Meters: Choosing the Right Technology
Clamp-On (Portable) Ultrasonic Flow Meters
Clamp-on ultrasonic meters represent the fastest-growing segment of the ultrasonic market — valued at $3.8 billion globally in 2025 and projected to reach $6.2 billion by 2033 at a 7.2% CAGR, according to Dataintelo market research. The growth driver is straightforward: the ability to measure flow on any accessible pipe without process interruption opens retrofit applications that no other technology can address at comparable cost.
Best Applications and Industry Use Cases
Clamp-on meters dominate wherever pipe access is available but process shutdown is not: large-diameter municipal water mains (DN600–DN2400) where excavation and isolation costs exceed the meter price by a factor of 10; chemical plant headers carrying corrosive fluids where any wetted device creates corrosion risk; pharmaceutical water-for-injection systems where any pipe penetration triggers expensive GMP revalidation; and nuclear cooling circuits where maintenance in radiation zones must be minimized.
について Jade Ant Instruments clamp-on ultrasonic meter range covers pipe diameters from DN32 to DN1000 in standard clamp-on configuration and DN50 to DN6000 for large-diameter applications, with V-method mounting (transducers on the same side of the pipe) for DN15–DN200 and Z-method mounting (transducers on opposite sides) for larger diameters or where signal transmission through the fluid is reduced.
Advantages for Temporary Monitoring and Troubleshooting
A portable clamp-on kit — a single transmitter unit with interchangeable transducer sets — is arguably the most valuable tool in a flow instrumentation distributor’s demo and service inventory. One kit covering DN15 to DN3000 can audit an entire process plant, verify permanent meter readings against an independent reference, identify heat exchanger fouling through flow balance measurements, locate leaks in distribution networks, and commission new installations — all without any pipe work. In a single day on a client site, a portable clamp-on meter can identify enough energy waste to justify $50,000–$200,000 in permanent meter investment. Offer this service as part of your technical support package; it generates immediate credibility and downstream sales.
Inline Ultrasonic Flow Meters
Inline (spool-piece) ultrasonic meters replace a section of the existing pipe with a precision-manufactured flow body containing transducers positioned for optimal acoustic path geometry. Unlike clamp-on units, transducer position is fixed and factory-optimized, pipe material and dimensions are precisely known, and the meter can be wet-flow calibrated at an ISO 17025-accredited laboratory before shipment, providing an NIST-traceable accuracy certificate accepted by custody transfer authorities worldwide.
Permanent Installation Benefits and Design Considerations
Multi-path inline meters — using 4, 5, or 8 acoustic chords across different positions in the pipe cross-section — measure the full velocity profile rather than inferring it from a single-chord reading. This delivers accuracy of ±0.15% to ±0.5% under real installation conditions, meeting the requirements of AGA Report No. 9 for gas custody transfer and API MPMS Chapter 5.8 for liquid fiscal metering. For oil terminal operators, gas transmission companies, and power generators where a 0.1% measurement discrepancy on a high-volume line represents hundreds of thousands of dollars annually, this level of performance justifies the higher capital cost and installation complexity.
Integration with Existing Piping Systems
Inline meter integration requires careful pre-engineering: specifying the correct flange standard (ANSI, DIN, JIS), pressure class, face-to-face dimension, and straight pipe run requirements. Most inline ultrasonic meters require 10–20 pipe diameters of undisturbed straight pipe upstream and 5 pipe diameters downstream to ensure a fully developed velocity profile. Where site layout does not permit adequate straight runs, flow conditioners (straightening vanes or tube bundles upstream of the meter) can reduce the upstream requirement to 5 pipe diameters, though with a small accuracy penalty that should be validated by the manufacturer.
Open Channel Ultrasonic Flow Meters
Open channel meters measure flow in non-pressurized channels, rivers, irrigation canals, and partially filled pipes — environments where inline and clamp-on meters cannot function. They operate on a two-component measurement: a level sensor (typically ultrasonic level or radar) measures the fluid depth, and the flow rate is calculated using a hydraulic algorithm (Manning equation or weir/flume equations) that converts depth to volumetric flow based on the channel cross-section geometry.
Applications in Water Treatment and Environmental Monitoring
Municipal wastewater treatment plants use open channel meters on influent and effluent streams, primary clarifier inlets, and stormwater overflow weirs. Environmental monitoring applications include river flow gauging for flood management, irrigation canal flow allocation under water rights agreements, and industrial effluent discharge monitoring for regulatory reporting. The key standard governing open channel ultrasonic measurement is ISO 6416, which specifies acoustic Doppler methods for measuring liquid flow in natural channels.
Specifications for Non-Pressure Pipe Environments
Open channel meters must be specified with sufficient range to handle the site’s maximum flood or surge flow — typically 3 to 5 times average flow — while maintaining measurement accuracy at minimum dry-weather flows. Ingress protection is critical: IP68 submersible ratings are often required for sensors that may be submerged during high-flow events. Solar power options and wireless data transmission are commonly specified for remote gauging sites without grid power or communication infrastructure.
3. Critical Technical Specifications: A Procurement Checklist
Accuracy Ratings and Measurement Uncertainty
Understanding ±2% vs. ±5% Accuracy Standards
These numbers appear in catalogs as simple percentages, but their practical meaning depends critically on how they are measured and under what conditions. A manufacturer claiming ±2% accuracy on a Doppler clamp-on meter may be stating laboratory performance on a new meter installed on a clean, well-characterized pipe at standard conditions. Field performance on an actual client installation — with aged pipe, variable temperature, and vibration — may be ±4% to ±5%. Conversely, a transit-time inline meter claiming ±0.5% accuracy based on factory wet-flow calibration will consistently deliver that performance in field installation if straight pipe requirements are met, because the calibration is traceable and the installation geometry is controlled.
The practical guidance for your product portfolio: quote accuracy as “typical field performance” rather than laboratory maximums, specify the conditions under which accuracy is achieved, and always include the pipe condition and straight run requirements in customer documentation. Clients who receive realistic accuracy expectations make better installation decisions and generate fewer warranty claims.
How to Calculate Total Measurement Uncertainty for Your Clients
Total measurement uncertainty combines multiple error sources in quadrature (square root of the sum of squares). For a clamp-on transit-time meter in a typical process installation:
A typical calculation for a mid-range clamp-on unit:
| Error Source | Uncertainty Contribution |
|---|---|
| Meter electronics (manufacturer specification) | ±1.0% |
| Velocity profile (installation geometry) | ±0.5% |
| Pipe dimension uncertainty (measured at site) | ±0.3% |
| Temperature compensation residual | ±0.2% |
| Total measurement uncertainty (combined) | ≈ ±1.15% |
This exercise is worth doing with clients evaluating clamp-on meters for near-fiscal applications — it demonstrates technical rigor and helps set accurate performance expectations.
Flow Range and Turndown Ratio
Selecting Meters with Adequate Rangeability
The turndown ratio question is frequently under-specified in purchasing decisions. A client specifying a meter based on average flow conditions will often encounter off-design conditions — process startups at 5%–10% of rated flow, production peaks at 110%–120% of design capacity — where a poorly selected meter either fails to read or exceeds its accuracy specification.
Ultrasonic transit-time meters typically achieve 100:1 to 300:1 turndown. In practical terms, a meter rated for a maximum velocity of 10 m/s will meet its accuracy specification down to 0.033–0.1 m/s. This performance is 20–100 times better than differential pressure meters, which begin to lose accuracy rapidly below 30% of design flow, and significantly better than vortex meters, which have a hard minimum velocity below which vortex shedding is not generated.
Implications for Multi-Product Distribution Portfolios
From a distributor portfolio management perspective, high turndown ratio reduces SKU complexity. Rather than stocking three meter sizes to cover a client’s flow range with acceptable accuracy across all conditions, a high-turndown ultrasonic meter can cover the same range with a single correctly sized unit. For distributors managing projects with variable demand profiles — water utilities, batch chemical processes, district energy systems — this simplification reduces inventory cost, simplifies technical documentation, and reduces the risk of field sizing errors.
Pipe Size Compatibility and Frequency Selection
Matching Meter Specifications to Existing Infrastructure
Ultrasonic meters are available for pipe sizes from DN6 (¼ inch) to DN6000 (240 inches) — the widest size range of any flow measurement technology. For clamp-on meters, pipe size determines the required transducer mounting method (V-method for DN15–DN200; W-method for very small pipes with dense materials; Z-method for large diameters and pipe materials with high acoustic attenuation), the required coupling compound type, and the appropriate transducer frequency.
Pipe material and wall thickness affect signal transmission quality. Carbon steel, stainless steel, HDPE, and PVC transmit ultrasound well. Cast iron and concrete attenuate the signal significantly, often preventing clamp-on measurement. Internally lined pipes (rubber, bitumen, PTFE) present a particular challenge: the acoustic impedance mismatch between liner and fluid creates signal reflections that can produce false readings. Always include pipe material and lining information in any pre-sales technical review.
Frequency Options: 0.5 MHz to 8 MHz Explained
Transducer frequency selection is one of the most practically important — and least explained — technical choices in clamp-on meter specification. The general principle is that lower frequencies penetrate larger or more attenuating pipe/fluid combinations, while higher frequencies provide better resolution and accuracy on small, clean-fluid applications.
| Frequency Range | Optimal Pipe DN | Typical Fluid | 申し込み |
|---|---|---|---|
| 0.5 MHz | DN300–DN6000 | Water, crude oil, large-pipe gas | Large municipal mains, offshore headers |
| 1 MHz | DN100–DN500 | Water, chemicals, petroleum products | General industrial process |
| 2 MHz | DN50–DN300 | Clean liquids, light hydrocarbons | Standard industrial, HVAC |
| 4 MHz | DN15–DN100 | Ultrapure water, solvents, low-viscosity | Pharmaceutical, small-bore chemical |
| 8 MHz | DN6–DN50 | High-purity thin liquids | Lab-scale, semiconductor fabrication |
The practical guidance: when in doubt, use the lower frequency within the appropriate range — lower frequencies are more tolerant of pipe condition variation and provide more robust signal coupling. Higher frequencies on large, attenuating pipes will produce weak signals and unreliable measurement.
4. Industry Applications: Where Ultrasonic Flow Meters Excel

Oil and Gas: Custody Transfer and Process Monitoring
Compliance Requirements and Measurement Standards
Oil and gas is the application where measurement accuracy is most directly monetized. At a crude oil loading terminal transferring 500,000 barrels per day at $70/barrel, a 0.1% meter bias represents $350,000 per day in unaccounted product. This financial context explains why fiscal metering in oil and gas is governed by the strictest measurement standards in any industry: AGA Report No. 9 for natural gas (requiring ±0.7% accuracy at minimum flow, ±0.7% at maximum flow) and API MPMS Chapter 5.8 for liquid custody transfer (requiring ±0.25% for multi-path ultrasonic meters with wet-flow calibration).
For distributors with oil and gas clients, these standards are not optional guidance — they are contractual requirements embedded in hydrocarbon sale and purchase agreements. Recommending a product that does not meet the applicable standard creates direct commercial liability for the client and reputational risk for the distributor.
High-Pressure and High-Temperature Applications
Upstream oil and gas applications frequently combine high pressure (up to 150 bar at wellheads), elevated temperature (up to 180°C for produced fluid), and challenging fluid composition — produced water with 10%–30% water cut, entrained sand, and varying gas fractions. These conditions require purpose-designed inline meters with pressure-rated spool bodies (meeting ASME B16.5 Class 600 or 900 flange standards), high-temperature transducers with waveguide isolation, and signal processing algorithms that handle phase fraction variation. Baker Hughes Panametrics, Emerson Daniel, and SICK are the primary technology vendors in this segment; their products carry AGA-9 and OIML certification and are designed for field service lifetimes exceeding 20 years.
Water and Wastewater: Treatment and Distribution
Non-Contact Measurement for Corrosive Environments
Municipal water and wastewater treatment represents the highest-volume application for both clamp-on and open channel ultrasonic meters. In distribution network monitoring, clamp-on meters installed on existing mains without excavation or isolation are standard practice — the installation cost advantage over DP or turbine meters on large pipes (DN600+) is so significant that utilities rarely consider alternatives.
In wastewater treatment, the fluid conditions span the full technology range: raw influent with 2–8% suspended solids (Doppler clamp-on), aerated secondary treatment zones with entrained air (Doppler or correlation), tertiary effluent (transit-time), and chlorine-dosed distribution water (transit-time). A single wastewater treatment plant may specify three different ultrasonic measurement principles across its measurement points — understanding this application map is essential for accurate system-level specification.
Regulatory Compliance and Data Logging Requirements
Water utilities in most jurisdictions are required to meter and report flows under regulatory frameworks (Safe Drinking Water Act in the US; EU Water Framework Directive in Europe). Meters used for billing or regulatory reporting must meet OIML R49 accuracy requirements (Class 1 or Class 2, depending on application) and must maintain calibration traceability to national standards. For distributors supplying to utilities, ensure your product portfolio includes meters with the appropriate OIML certification and check that your local calibration service infrastructure can support the required calibration intervals.
Chemical and Pharmaceutical Manufacturing
Precision Measurement in Process Control
In specialty chemical production, batch recipe accuracy directly determines product quality and yield. A ±1% flow measurement error on a reagent charge line can shift the stoichiometry of a reaction, producing off-spec product that must be reworked or disposed of — at a cost that typically exceeds the annual capital cost of the measurement equipment. This economic reality drives specification of transit-time inline meters (±0.5% accuracy) over clamp-on units for critical batch charging lines, despite the higher installation cost.
Pharmaceutical manufacturing adds the regulatory dimension of FDA 21 CFR Part 211 and EU GMP guidelines, which require all process measurement instruments to be validated, calibrated to a documented schedule, and traceable to national measurement standards. Any meter installed on a water-for-injection or purified water system must not introduce dead legs, crevices, or non-drainable volumes — which is why clamp-on ultrasonic meters have become the de facto standard for flow measurement on validated pharmaceutical water loops.
Integration with SCADA and Automation Systems
Modern pharmaceutical and chemical facilities operate under fully integrated process control — DCS or PLC-based systems with continuous data historian recording, statistical process control (SPC) monitoring, and automated batch documentation. Ultrasonic meters must support the plant’s communication protocol (typically Modbus RTU, PROFIBUS, or EtherNet/IP), deliver multi-variable output (flow rate, flow velocity, signal quality diagnostics), and maintain a time-stamped data record acceptable for 21 CFR Part 11 (electronic records) compliance.
HVAC and District Energy Systems
Heating and Cooling Loop Monitoring
District energy systems — large-scale heating and cooling networks serving campuses, city districts, or industrial parks — require accurate flow measurement of heating water, chilled water, and heat transfer fluids across a complex network of distribution pipes, substations, and consumer connections. Ultrasonic flow meters paired with temperature sensors form BTU (British Thermal Unit) meters — also called energy meters — that measure both the flow rate and the temperature differential (ΔT) across the heat exchanger to calculate actual heat transfer:
This combined flow + energy measurement enables energy billing by consumed heat or cooling rather than by fluid volume — a contractual requirement in most district energy applications and increasingly mandated under EU Energy Efficiency Directive regulations for building heat billing.
Energy Auditing and Efficiency Optimization
A 2025 analysis by Sierra Instruments across 15 facility energy management case studies found an average 10–30% reduction in compressed air and process fluid energy costs attributable directly to accurate flow measurement enabling right-sized pump and compressor operation. In HVAC systems specifically, portable clamp-on meter surveys — using a single portable kit to flow-balance the entire building or campus — routinely identify 15%–25% overcirculation in secondary distribution loops caused by incorrectly commissioned balancing valves, representing direct pump energy waste. For distributors, offering portable meter rental or hire as a service attached to permanent meter sales creates additional revenue and generates pre-sales intelligence on clients’ systems.
Food and Beverage Production
Hygienic Design and Sanitary Applications
Food and beverage manufacturing requires flow meters that comply with 3-A Sanitary Standards (US) or EHEDG guidelines (Europe) — specifications that prohibit crevices, dead legs, and surfaces that cannot be cleaned in place (CIP) or sterilized in place (SIP). Inline ultrasonic meters for food-grade applications use tri-clamp or hygienic flange connections, electropolished internal surfaces (Ra ≤ 0.8 μm), and FDA-compliant wetted materials (316L stainless steel body, PEEK or PVDF transducer faces). These specifications are non-negotiable for dairy, brewing, beverage, and pharmaceutical food supplement manufacturing.
Product Traceability and Batch Documentation
Under FSMA (Food Safety Modernization Act) in the US and EU food law (Regulation EC 178/2002), food manufacturers must maintain complete traceability records for all process inputs — including precise volume records of ingredients, water, cleaning chemicals, and packaging gases. Ultrasonic meters integrated with manufacturing execution systems (MES) via OPC-UA or Modbus TCP provide the real-time, time-stamped flow data required for batch documentation, allergen control programs, and supply chain traceability audits.
5. Leading Manufacturers Compared: Baker Hughes, Endress+Hauser, and Badger Meter
業界の洞察 The global ultrasonic flow meter market is currently consolidating around a tier-1 group of 5–8 manufacturers who invest heavily in multi-path technology, digital integration platforms, and global service networks. For distributors, the commercial question is not just which technology is best, but which manufacturer partnership delivers the best combination of product performance, margin structure, technical support, and long-term supply chain reliability.
Baker Hughes Ultrasonic Solutions
Baker Hughes, through its Panametrics measurement brand — the business that pioneered commercial ultrasonic flow meters over 50 years ago — offers one of the broadest ultrasonic portfolios in the market, spanning clamp-on portables, fixed clamp-on transmitters, inline spool-piece meters, and flare gas systems.
Product Portfolio and Specializations
The Panametrics product line covers three primary segments: portable clamp-on meters (TransPort PT900 for liquids, PT878GC for gases — handheld units for field surveys and commissioning verification); fixed clamp-on meters (AquaTrans AT600 for water utilities, AquaTrans AT868 for municipal applications, DigitalFlow DF868 for process liquids and DigitalFlow GC868 for gas); and inline spool-piece meters (PanaFlow Z1G and Z2G for one- and two-path gas applications, PanaFlow Z3 three-path liquid process meter, and the Sentinel family for liquid custody transfer with OIML R117 certification). The DigitalFlow GS868 is a specialist steam measurement meter — a segment where ultrasonic technology is increasingly replacing traditional DP orifice plates due to zero pressure loss and wider rangeability.
Pricing, Support, and Distribution Network Advantages
Baker Hughes positions Panametrics as a premium industrial brand with global service coverage through its Baker Hughes field service network. List prices for the AquaTrans AT600 clamp-on start around $3,500–$5,000; the PanaFlow Z3 inline process meter ranges from $8,000–$25,000 depending on pipe size and path count; the Sentinel custody transfer family begins at $15,000+ for DN50 and scales to $80,000+ for large fiscal metering stations. Baker Hughes offers structured distributor partnership programs with volume pricing, application engineering support, and factory training. For distributors in oil and gas or large industrial markets, the brand equity of Panametrics in custody transfer applications is a competitive asset.
Endress+Hauser: Premium Technology and Service
Endress+Hauser’s Proline Prosonic Flow range is positioned as the premium general-industrial ultrasonic solution, with particular strength in process industries, water/wastewater, and integrated digital ecosystems.
Advanced Features and Measurement Capabilities
The Prosonic Flow P 500 clamp-on meter — launched with a starting market price around $7,757 (Instrumart list price 2025) — covers DN15 to DN4000 (½” to 160″) and handles medium temperatures from –40°C to +550°C with high-temperature transducers. The W 400 is positioned for water and utilities applications, offering cost-efficient measurement for conductive and non-conductive liquids. The G 300 and G 500 cover gas applications, with the G 500 measuring gas velocities from 0.3 m/s to 40 m/s and temperatures from –50°C to 150°C. Endress+Hauser’s multi-path inline ultrasonic meters (the Proline Prosonic Flow series) achieve ±0.5% accuracy with wet-flow calibration certificates meeting ISO 17089.
Integration Ecosystems and Digital Solutions
Endress+Hauser’s Netilion cloud platform provides remote meter diagnostics, calibration management, and documentation — a significant advantage for large utilities and industrial clients managing hundreds of measurement points. The Heartbeat Technology built into Proline transmitters performs continuous self-diagnostics and generates IFS (In-Service Functional Safety) verification reports without process interruption, meeting IEC 61508 SIL 2 requirements for safety-critical applications. For distributors, E+H’s FieldXpert tablet-based commissioning tool and the myEndress customer portal provide strong post-sale technical support infrastructure.
Badger Meter: Innovation in Smart Metering
Badger Meter occupies a distinctive position — primarily a water utility metering specialist, it has extended its E-Series ultrasonic platform into smart water management with strong IoT integration capabilities.
IoT-Enabled Products and Data Management Platforms
The E-Series G2 ultrasonic water meter uses solid-state technology to eliminate all moving parts — no mechanical register, no rotating parts subject to wear — and transmits real-time consumption data via Badger’s ORION Cellular or ORION Fixed Network AMI (Advanced Metering Infrastructure) platforms. Each meter provides flow rate, flow direction, temperature, and leak detection data — measured continuously, not just at reading intervals. For water utilities managing non-revenue water (NRW), which globally averages 30–35% of total distributed volume, this continuous data enables leak detection response within hours rather than months, directly recovering lost revenue. Badger’s BEACON cloud platform aggregates data from thousands of meters for pattern analysis, predictive maintenance, and regulatory reporting.
Market Position and Distributor Partnership Models
Badger Meter primarily sells through direct utility relationships and water distribution specialists. For flow instrumentation distributors with municipal water clients, Badger’s structured dealer program offers competitive margins on the E-Series platform, strong brand recognition in water utility markets, and the backing of a NASDAQ-listed manufacturer with consistent investment in product development (the company reported R&D spend of 7–8% of revenue in recent years). Note that Badger’s strength is in water metering — it is not the right recommendation for oil and gas, chemical, or industrial process applications.
Comparative Analysis: Performance, Price, and Support
Total Cost of Ownership Across Different Applications
The following matrix provides a side-by-side comparison across the three manufacturers for the key distributor evaluation criteria:
| Evaluation Criterion | Baker Hughes (Panametrics) | Endress+Hauser (Prosonic) | Badger Meter (E-Series) |
|---|---|---|---|
| Best application segment | Oil & gas, custody transfer, industrial | Process industries, water/wastewater | Municipal water utilities |
| Clamp-on accuracy (typical) | ±1.0%–2.0% | ±1.0%–2.0% | ±1.0% (water) |
| Inline accuracy (multi-path) | ±0.15%–0.5% | ±0.5% | Not primary offering |
| Temperature range (max) | 250°C (standard), 500°C+ (special) | 550°C (P 500 with waveguide) | 70°C (water utility) |
| Pipe size range (clamp-on) | DN15–DN3000 | DN15–DN4000 | DN15–DN300 |
| Hazardous area certification | ATEX/IECEx/FM | ATEX/IECEx/FM/CSA | Limited (water focus) |
| Digital integration | HART 7, Modbus, PROFIBUS, EtherNet/IP | HART 7, Modbus, PROFIBUS, Heartbeat, Netilion | AMI, Cellular, ORION, BEACON Cloud |
| Entry price (clamp-on) | ~$3,500 | ~$7,750 | ~$400–$800 (water utility) |
| Distributor margin structure | Standard industrial distribution | Standard industrial distribution | Dealer program |
| Service network | Global (Baker Hughes FSN) | Global (E+H service centers) | US-focused |
Warranty, Training, and Technical Support Evaluation
All three manufacturers offer standard 2-year product warranties, with extended service agreements (3–5 years) available. Baker Hughes provides factory application engineering support through its Panametrics application centers in Houston, Munich, and Tokyo; Endress+Hauser maintains 130+ service centers globally and offers FieldCare asset management software free of charge. Badger Meter’s BEACON platform includes 24/7 cloud-based diagnostics and direct line to application engineers for utility clients. For distributors, evaluate technical support against your clients’ geographic locations — a manufacturer with no local service presence creates field service gaps you will have to fill with your own resources.
6. Product Ranking and Selection Matrix
Top Ultrasonic Flow Meters by Application Category
Best for Custody Transfer and High Accuracy Requirements
The technical requirements for custody transfer — ±0.25% to ±0.7% accuracy with NIST-traceable calibration, AGA-9 or API 5.8 compliance, full diagnostic logging — narrow the field to multi-path inline meters from Baker Hughes Panametrics (Sentinel family), Emerson Daniel (Senior Sonic), SICK (FLOWSIC500), and ABB (WaterMaster with USM option). These products are in the $15,000–$80,000 range for typical custody transfer station configurations, but the measurement stakes are commensurate. For distributors active in oil, gas, or refined products custody transfer, investing in product training and calibration documentation support for one or two of these manufacturers is essential — fiscal meter projects are won or lost on technical credibility.
Best for Cost-Effective Process Monitoring
For general process monitoring applications where ±1%–2% accuracy is adequate, the value segment offers strong options. Mid-range clamp-on transit-time meters from manufacturers including Sino-Inst, Isoil, and the Jade Ant Instruments ultrasonic product range provide working accuracies of ±1.0%–1.5%, full industrial communication protocols (4–20 mA, Modbus RTU), ATEX certification options, and pipe size coverage to DN1000 — at price points 40%–60% below equivalent E+H or Baker Hughes products. For distributors serving mid-size industrial plants, EPC contractors, and system integrators who prioritize total project cost, this segment offers the best margin structure alongside the highest sales volume.
Performance Benchmarking: Specifications Side-by-Side
| 仕様 | Baker Hughes Panametrics AT868 | E+H Prosonic Flow P 500 | Jade Ant JAI-TDS Clamp-On |
|---|---|---|---|
| Pipe size range | DN25–DN3000 | DN15–DN4000 | DN32–DN1000 |
| Accuracy (of reading) | ±1.0% | ±1.0% | ±1.0% |
| 再現性 | ±0.2% | ±0.2% | ±0.2% |
| Fluid temperature | –40°C to +160°C | –40°C to +550°C | –20°C to +160°C |
| IP rating | IP67 | IP67/IP68 | IP67 |
| Output protocols | 4–20 mA, Modbus, HART | 4–20 mA, HART, Modbus, PROFIBUS | 4–20 mA, Modbus RTU |
| ATEX certified | Yes (Zone 1/2) | Yes (Zone 1/2) | Yes (Zone 2) |
| Indicative list price | $4,500–$7,000 | $7,750+ | $1,800–$3,500 |
Value Proposition Analysis for Distributor Margins
Pricing Structures and Competitive Positioning
The ultrasonic meter market has three distinct pricing tiers, each with different margin dynamics for distributors:
について premium tier (E+H Prosonic, Baker Hughes Panametrics top range, Emerson Daniel) commands 15%–30% distributor margins on high-value projects where brand specification and certification requirements make competitive substitution difficult. The commercial challenge is that these manufacturers increasingly pursue direct key account relationships at major oil companies and utilities, leaving distributors in a support rather than lead role on the largest projects.
について mid-market tier (mid-range E+H, ABB, KROHNE mid-range, SICK) offers 20%–35% margins and broader product availability. These manufacturers rely heavily on distributor networks for application coverage and geographic reach, making partnership terms more favorable for active distributors who invest in product training.
について value tier (Jade Ant Instruments and comparable quality manufacturers from established industrial production ecosystems) provides 35%–50%+ distributor margins and positions well in price-sensitive industrial segments where clients need reliable measurement without premium brand pricing. For distributors building volume in emerging markets, EPC project supply, or OEM instrumentation packages, the value tier often generates the highest absolute margin per sales dollar invested.
Customer Support and Technical Resources
Manufacturers who provide comprehensive distributor support — factory training, application engineering access, demo unit programs, co-marketing materials, and lead sharing — generate significantly higher distributor loyalty and performance. When evaluating new manufacturer partnerships, quantify the support infrastructure: How many application engineers are available for pre-sales technical support? What is the average response time for technical queries? Is there a dedicated distributor portal with up-to-date documentation? Is factory training funded or subsidized? The answers to these questions often matter more to long-term distributor success than the initial price point.
7. Installation, Configuration, and Commissioning

Pre-Installation Assessment and Site Evaluation
Pipe Material, Size, and Fluid Characterization
A systematic pre-installation site survey is the single most effective investment in ensuring that a clamp-on meter performs to specification. The survey should capture six data points: pipe outside diameter (measured at the installation point, not taken from engineering drawings — real pipes often differ from nominal by 2%–5%); pipe wall thickness (ultrasonic wall gauge measurement at 4 points around the circumference to check uniformity and detect corrosion); pipe material and any internal lining; fluid type, temperature, and approximate particulate content; available straight pipe runs upstream and downstream; and presence of vibration sources or EMI-generating equipment within 3 meters.
The transducer spacing calculation — which determines how far apart the two clamp-on transducers must be positioned on the pipe — is performed using the meter’s built-in software, which takes the pipe dimensions, fluid sonic velocity, and transducer frequency as inputs. Incorrect transducer spacing is the most common cause of commissioning failures on clamp-on meters; always use the manufacturer’s spacing calculator, not an approximation.
Straight Pipe Requirements and Sensor Placement
Most ultrasonic meters require a defined minimum straight pipe run upstream and downstream of the measurement point — free from elbows, tees, valves, pumps, and other flow-disturbing fittings — to ensure a fully developed, repeatable velocity profile. Standard requirements are 10 pipe diameters (10D) upstream and 5D downstream for single-path clamp-on meters; 15D upstream and 5D downstream for more sensitive multi-path inline meters. Where adequate straight runs are not available, install flow conditioners or relocate the measurement point; do not compromise on this requirement. Field studies confirm that insufficient straight pipe run is the most common cause of ±5%–10% measurement error in installed clamp-on meters — errors that show up only after commissioning and are difficult to diagnose remotely.
Step-by-Step Installation Procedures
Clamp-On Meter Installation Best Practices
The installation sequence for a clamp-on transit-time meter follows eight steps. First, clean the pipe surface at the installation location with a wire brush or sandpaper to remove paint, rust, and scale to bright metal over an area 150mm × 50mm on two positions separated by the calculated transducer spacing. Second, apply the correct coupling compound — standard ultrasonic gel for temperatures up to 60°C, high-temperature epoxy for up to 160°C, grease-based compounds for surfaces subject to vibration — in a uniform layer of 1–2 mm thickness. Third, position and clamp the transducers at the calculated spacing, ensuring both transducers are aligned on the same axial line and both coupling compound layers are fully compressed. Fourth, connect the transducer cables to the transmitter, observing polarity if applicable. Fifth, enter the pipe parameters (OD, wall thickness, material, lining) into the transmitter. Sixth, observe the signal quality indicator — most transmitters display a signal strength percentage; 80%+ indicates good coupling, below 60% indicates a coupling problem requiring investigation. Seventh, allow the meter to stabilize for 5–10 minutes and verify zero reading with the pipe full and flow stopped. Eighth, compare the reading against a reference measurement (portable reference meter, pump curve, or system balance) if available.
Inline Meter Integration and Pressure Testing
Inline meter installation requires proper process preparation: the pipe must be isolated, drained, and depressurized before cutting. The cut-out length must match the meter’s face-to-face dimension exactly — errors create gasket compression problems and potential flange leaks. Use calibrated torque wrenches for all flange bolts, following the meter manufacturer’s specified bolt torque sequence and value. After reassembly, perform a hydrostatic pressure test at 1.5× operating pressure before returning the line to service. Configure the transmitter with the correct pipe parameters, fluid properties, and process conditions — verify that the acoustic signal quality and zero reading are within specification before releasing the installation.
Configuration and Calibration for Optimal Performance
Fluid Velocity Profiling and Zero-Flow Verification
Zero-flow verification — confirming that the meter reads exactly zero flow when the pipe is full but stationary — is the most important commissioning check and the most reliable ongoing calibration reference. A non-zero reading at zero flow indicates either an installation problem (incorrect transducer position, coupling compound contamination) or a transmitter offset that needs correction. The procedure: close isolation valves on both sides of the meter, allow the pipe to fill completely with process fluid, wait 3–5 minutes for any residual flow to dissipate, then record the meter reading. Any reading above ±0.1 m/s at zero flow requires investigation.
Diagnostic Tools and Validation Methods
Modern ultrasonic meter transmitters include built-in diagnostic parameters that provide significant insight into measurement quality — and that are under-utilized by most technicians. Key diagnostic parameters to check at commissioning and during periodic maintenance visits: signal strength (should be >70% for transit-time, with both transducers within ±5% of each other); signal quality factor (a composite SNR indicator — should be >80%); velocity of sound in fluid (can be cross-checked against published acoustic velocity tables for the measured fluid and temperature, providing independent verification that the fluid identification is correct); and delta-T value at known flow rate (can be cross-checked against the theoretical Δt calculation as a transmitter electronics verification). Document these values at commissioning as a baseline for future troubleshooting.
8. Integration and Data Management: Digital Solutions
Communication Protocols and Connectivity Options
4-20mA, Modbus, HART, and Industrial Ethernet Standards
The choice of communication protocol should be driven by the client’s existing control infrastructure, not by meter specification. The practical guide for each protocol:
4~20 mA アナログ is universal and requires no software configuration — the 4 mA corresponds to zero flow, 20 mA to full-scale. It is the lowest-risk option for retrofit into existing control systems but carries only one variable and provides no diagnostic information to the control room. Always include a 4–20 mA output as a fallback even when a digital protocol is the primary integration.
HART (Highway Addressable Remote Transducer) overlays a digital signal on the existing 4–20 mA wiring, enabling remote configuration, multi-variable access, and integration with asset management software (Emerson AMS, E+H FieldCare, ABB Field Information Manager) without additional field wiring. HART 7 supports multi-drop (up to 15 devices on a single pair) and burst mode for high-speed data. For sites with existing 4–20 mA infrastructure, HART is the most cost-effective digital upgrade path.
Modbus RTU/TCP is the standard for industrial SCADA and data historian integration. Modbus TCP over Ethernet enables direct connection to OSIsoft PI, Ignition, Wonderware, and most cloud analytics platforms. For any new installation with a modern DCS or SCADA system, specify Modbus TCP as the minimum digital protocol.
PROFIBUS DP/PA is the Siemens DCS ecosystem standard — mandatory for integration with Siemens PCS7 systems. PROFIBUS PA is the process-plant variant designed for hazardous area installation on an intrinsically safe bus. Specify PROFIBUS only when the client’s DCS architecture explicitly requires it.
Wireless Solutions and Remote Monitoring Capabilities
WirelessHART (IEEE 802.15.4) and ISA100.11a are the two standardized industrial wireless protocols for flow meter integration. WirelessHART is the more widely adopted, supported by most major meter manufacturers, and compatible with the extensive installed base of HART-capable control systems. Battery-powered wireless adapters are available for retrofitting WirelessHART capability onto existing HART meters, enabling remote monitoring on existing meters without cable runs. For remote monitoring applications — pipeline isolation valves, distribution network substations, environmental monitoring stations — wireless significantly reduces installation cost versus cabled communication.
SCADA Integration and System Architecture
Compatibility with Common Control Systems
The compatibility matrix between ultrasonic meter protocols and major control platforms:
| Control System | Preferred Protocol | Notes |
|---|---|---|
| Siemens PCS7 / TIA Portal | PROFIBUS PA / PROFINET | Native driver support; PA for hazardous area |
| Emerson DeltaV | HART 7 / Foundation Fieldbus | Extensive HART device library in AMS |
| Honeywell Experion | HART / Modbus TCP | IDA driver for HART multi-variable |
| Rockwell ControlLogix | Modbus TCP / EtherNet/IP | Add-on instruction (AOI) available |
| Schneider EcoStruxure | Modbus TCP / BACnet/IP | BACnet for HVAC/building automation |
| Generic SCADA (Ignition, AVEVA) | Modbus TCP | Universal driver support |
Data Logging and Historical Trending Features
Ultrasonic meter transmitters typically provide internal data logging — cumulative totalized flow, event logs (power interruptions, alarm conditions, configuration changes), and periodic snapshot logs (hourly or daily average flow). The internal log capacity varies by manufacturer: most premium meters store 60–90 days of hourly data; budget meters may store only 30 days. For applications where meter data must be defended in commercial or regulatory disputes — custody transfer, utility billing, environmental compliance — verify that the meter’s internal log cannot be cleared without creating an audit trail, and that the log entries are timestamped to the second.
Cloud-Based Monitoring and Analytics Platforms
Predictive Maintenance and Anomaly Detection
Cloud-connected meter platforms — Endress+Hauser Netilion, Badger Meter BEACON, Emerson Plantweb — aggregate real-time diagnostic data from multiple meters and apply machine learning algorithms to identify early signs of meter degradation: gradual signal strength decline (indicating transducer coupling deterioration), increasing noise floor (indicating growing pipe vibration or external EMI), or systematic zero drift (indicating changes in pipe condition). These platforms typically identify maintenance requirements 30–90 days before an outage, enabling scheduled maintenance that avoids unplanned downtime.
For distributors, cloud platform capabilities represent a service differentiation opportunity. Clients who subscribe to predictive maintenance monitoring through your service offering become significantly more loyal than those receiving meter supply alone — the recurring service revenue also improves your business’s financial profile and enterprise value.
Regulatory Reporting and Compliance Documentation
Cloud platforms that generate automated compliance reports — daily/monthly flow totals, calibration verification records, alarm event logs — reduce the client’s internal reporting burden substantially. For environmental permit compliance (EPA discharge monitoring, EU IPPC Directive reporting) or ISO 50001 energy management system documentation, automated cloud-generated reports eliminate the manual spreadsheet compilation that currently consumes hours of engineering time per reporting cycle. Position this capability in client conversations not as a technology feature but as an operational cost reduction.
9. Cost Analysis and ROI Justification for Your Clients
Capital Investment vs. Operating Costs
Purchase Price Comparison Across Product Tiers
The following price ranges reflect typical market pricing for industrial ultrasonic meters in 2025, across product tier and installation type:
| Product Category | Typical Price Range | Notes |
|---|---|---|
| Portable clamp-on (liquid) | $2,500–$8,000 | Single kit covers DN15–DN3000 |
| Portable clamp-on (gas) | $4,000–$10,000 | Includes gas transducer set |
| Fixed clamp-on (standard) | $1,500–$5,000 | Budget to mid-range |
| Fixed clamp-on (premium) | $5,000–$12,000 | E+H, Baker Hughes premium |
| Inline single-path | $3,000–$8,000 | DN25–DN150, process quality |
| Inline multi-path (2-4 paths) | $8,000–$30,000 | DN50–DN300, fiscal accuracy |
| Inline multi-path (custody transfer) | $15,000–$80,000+ | AGA-9/API 5.8 certified |
| Open channel (level + flow) | $2,000–$8,000 | Depends on channel size and features |
Installation, Maintenance, and Lifecycle Expenses
Installation cost for clamp-on meters is typically $500–$2,000 for professional installation including site survey, mounting, cable routing, and commissioning. For inline meters, installation cost includes pipe work and typically ranges from $2,000–$15,000 depending on pipe size and access difficulty. Budget a further 10%–15% of purchase price annually for calibration, where custody transfer or regulatory compliance applications require periodic external calibration; for monitoring applications with built-in self-diagnostics, biennial verification with a portable reference meter is typically sufficient.
Return on Investment Calculation Models
Energy Savings and Efficiency Improvements
The most compelling ROI argument for many industrial clients is pump energy optimization. Fan and pump laws dictate that pump power scales with the cube of rotational speed. A pump running 10% faster than necessary consumes 33% more energy; running 20% faster consumes 73% more. Without accurate flow measurement, pump control systems default to conservative setpoints that ensure adequate flow but waste significant energy. With accurate ultrasonic flow measurement feeding a VFD (variable frequency drive), the control system can optimize pump speed continuously, delivering the required flow at minimum energy input.
For a typical 90 kW process pump running continuously at $0.10/kWh:
A $5,000 clamp-on ultrasonic meter on this pump circuit pays back in approximately 6 weeks from energy savings alone. Present this calculation to clients with large pump inventories — it converts the meter procurement conversation from a cost discussion to an investment discussion.
Reduced Downtime and Improved Process Control
In process industries where production throughput is directly tied to flow measurement quality, a single unplanned process upset caused by a failed or drifted flow meter can cost more than the capital cost of the meter itself. A specialty chemical batch reactor that produces $50,000 of product per batch loses the entire batch if reagent flow measurement fails during charging. The avoided downtime cost alone justifies the capital investment in a quality meter with self-diagnostic capabilities — and makes the total cost of ownership argument unambiguous.
Budgeting and Procurement Strategies for B2B Buyers
Volume Discounts and Long-Term Partnership Pricing
Most meter manufacturers offer structured volume pricing tiers — typically 5%–10% discount at 10 units, 10%–20% at 25 units, and 15%–30%+ for annual supply agreements with committed volumes. For distributors, consolidating client purchases into annual supply agreements rather than project-by-project transactions both improves your margin and gives you leverage in manufacturer partnership negotiations. Present annual supply agreements to clients as a cash flow and planning benefit — fixed pricing for budget certainty, priority delivery scheduling, and extended payment terms — rather than solely as a cost reduction.
Financing Options and Capital Equipment Justification
Flow meters are capital equipment with 10–20 year useful lives, qualifying for capital depreciation treatment in most tax jurisdictions. For clients whose procurement process separates capital and operating budgets, positioning meter investment as capital expenditure (with associated depreciation benefit) against the operating cost savings (reduced energy, reduced maintenance) makes the financial case in the language CFOs use. Many equipment financing companies offer lease and hire-purchase arrangements for industrial instrumentation — connecting clients with financing options can unblock procurement decisions that stall on upfront capital budget constraints.
10. Troubleshooting, Maintenance, and Support

Common Issues and Diagnostic Solutions
Signal Loss, Noise, and Measurement Errors
Signal loss — the most common clamp-on field problem — manifests as the meter displaying “no signal,” “signal error,” or a dramatically unstable reading. The systematic diagnostic sequence: first check that transducer cables are fully seated at both the transmitter and transducer ends; second, verify that coupling compound has not dried out or migrated (particularly common on hot pipes above 80°C or in dry/vibrating environments); third, check that the transducers are still positioned at the correct spacing (physical displacement from vibration or thermal cycling); fourth, verify the pipe is full of fluid (clamp-on meters cannot measure in partially filled or gas-pocketed pipes); fifth, use the transmitter’s signal strength diagnostic to determine whether signal is present but weak (coupling problem) or absent (wiring or transducer failure).
Measurement noise — erratic, unstable readings on an otherwise functioning meter — is typically caused by flow-induced turbulence (too close to an elbow or valve), vibration at the pipe (pump cavitation, surge, or resonance), or EMI from nearby VFDs or high-current equipment. Moving the measurement point to a more stable pipe section, adding vibration isolation mounts to the transducers, or increasing the transmitter’s signal averaging time constant are the standard corrective actions.
Environmental Interference and Calibration Drift
Calibration drift — a gradual, progressive change in meter reading over months or years — is most commonly caused by: gradual internal pipe corrosion or scale buildup changing the effective pipe bore (reducing measured cross-section and causing under-reading); transducer frequency shift from prolonged thermal cycling; or firmware changes in connected control systems that alter the zero point or span scaling. Annual zero-flow verification catches the first two; maintaining firmware version records catches the third. For custody transfer applications, annual wet-flow calibration comparison at an accredited laboratory is the definitive drift detection method.
Preventive Maintenance Schedules and Best Practices
Sensor Cleaning and Transducer Care
A structured preventive maintenance schedule extends transducer service life and maintains measurement accuracy. The following schedule is appropriate for standard industrial process applications:
| Frequency | Maintenance Activity | Time Required |
|---|---|---|
| Monthly | Visual inspection of cable condition, mounting clamps, display | 15 minutes |
| Quarterly | Signal strength and zero-flow verification; log values | 30 minutes |
| Annually | Coupling compound inspection and replacement if needed; transducer face inspection; transmitter firmware version check | 2–3 hours |
| Biennially | Calibration verification against portable reference meter; full diagnostic report | 4–6 hours |
| As needed | Transducer replacement (typically 5–10 year MTBF); battery replacement for battery-powered units | 1–2 hours |
Software Updates and Firmware Management
Ultrasonic meter firmware updates occasionally include corrections to measurement algorithms, improvements to signal processing, or updates to protocol stacks (particularly common after Modbus or HART specification updates). Maintain a firmware version log for all installed meters and check manufacturer update notifications annually. Apply firmware updates during planned maintenance windows — never during active production — and document the pre- and post-update reading comparison to confirm the update has not altered the calibration.
Accessing Manufacturer Support and Technical Resources
Training Programs and Certification for Your Team
Manufacturer factory training programs are among the most high-return investments a distributor can make. A 2–3 day factory training at a manufacturer’s application center — covering installation procedures, transmitter configuration, diagnostic interpretation, and calibration — enables your technical team to resolve 80%–90% of field issues without escalating to the manufacturer, dramatically reducing client downtime and improving your service reputation. Most major manufacturers offer factory training as part of distributor partnership agreements, either funded or at reduced cost for authorized partners.
Warranty Coverage and Extended Service Agreements
Standard meter warranties cover manufacturing defects for 24 months. Extended service agreements (ESAs) — available from most manufacturers for 3–5 year terms — typically include annual calibration verification, priority field service response (4–24 hours vs. standard 48–72 hours), discounted replacement parts, and firmware update management. For clients with high-criticality or high-value measurement applications (custody transfer, continuous process control), ESAs are a valuable service offering that you can sell alongside hardware with margins in the 20%–30% range. For distributors, ESA revenue is recurring, contract-based, and significantly more predictable than hardware project revenue.
Embedded Video: Ultrasonic Flow Meter Working Principle Explained
For a clear visual explanation of transit-time ultrasonic flow measurement principles, this video is recommended for your technical team onboarding and client education materials:

Ultrasonic Transit Time Technology Explained — covering the core physics of transit-time measurement, transducer configurations, and typical industrial applications. Suitable for distributor technical teams and client specification presentations.
よくある質問 (FAQ)
1. What is the difference between Doppler and transit-time ultrasonic flow meters?
Transit-time meters measure the difference in travel time between ultrasonic pulses sent upstream and downstream through the bulk fluid — they require clean, acoustically homogeneous liquids or gases. Doppler meters measure the frequency shift of signals reflected by particles or bubbles in the fluid — they require a minimum concentration of suspended solids or entrained gas to function. Transit-time meters achieve ±0.15%–2.0% accuracy and are used for custody transfer, clean process liquids, and gas measurement. Doppler meters achieve ±2%–5% and are used for wastewater, slurries, and mixed-phase fluids. The selection decision is made entirely by fluid cleanliness and particulate content — not by personal preference or brand availability.
2. Can ultrasonic flow meters be used in all pipe materials?
Ultrasonic clamp-on meters work well on carbon steel, stainless steel, HDPE, PVC, and fiberglass pipes. Cast iron, concrete, and heavily corroded pipes attenuate the acoustic signal significantly, often preventing measurement or degrading accuracy to ±5%+. Internally lined pipes (rubber, bitumen, PTFE air-gap liners) present additional signal attenuation challenges. Always conduct a pipe material and condition survey before specifying clamp-on meters. For pipes that are unsuitable for clamp-on measurement, inline insertion or spool-piece meters provide the alternative.
3. What accuracy can I expect from ultrasonic flow meters in real field installations?
Field accuracy is consistently lower than laboratory specifications. Transit-time clamp-on meters typically achieve ±1.0%–2.0% on well-characterized pipes and ±2%–5% on aged or poorly characterized pipes. Multi-path inline meters with wet-flow calibration achieve ±0.25%–0.5% in field conditions that meet straight pipe requirements. Doppler clamp-on meters achieve ±2%–5% on typical wastewater and slurry applications. When specifying for clients, always quote “typical field performance” with a description of the conditions required to achieve it — this sets realistic expectations and prevents specification disputes after installation.
4. How do I determine the correct meter size for my application?
Match the meter to the pipe’s inner diameter and the expected flow velocity range. For transit-time meters, the optimal velocity range is 0.3–10 m/s for liquids; measurement below 0.1 m/s or above 12 m/s degrades accuracy. For a pipe carrying 50 m³/h in a DN150 pipe: velocity = flow rate ÷ area = 50/3600 ÷ (π × 0.075²) = 0.785 m/s — within optimal range. Use the manufacturer’s sizing calculator, available as a free tool on most manufacturer websites, for final sizing verification. Always check the turndown ratio against the client’s minimum expected flow — a meter that reads accurately at average flow but cannot reliably measure 10% of average flow during low-demand periods is an undersized solution.
5. What is the minimum straight pipe requirement for ultrasonic meters?
Standard requirements are 10D upstream and 5D downstream for clamp-on single-path meters (D = pipe inner diameter). Multi-path inline meters require 15D upstream and 5D downstream. Where insufficient straight pipe is available, install a flow conditioner (tube bundle or perforated plate straightener) upstream of the meter — this reduces the upstream requirement to 5D with a slight accuracy penalty (typically +0.2%–0.5%). Insufficient straight pipe is the single most common cause of unexplained measurement error in installed clamp-on meters and is frequently overlooked in procurement specifications.
6. Are ultrasonic flow meters suitable for high-temperature applications?
Standard transit-time clamp-on meters handle up to 130°C–160°C with standard coupling compounds. High-temperature variants with waveguide transducers extend to 250°C or higher (E+H Prosonic Flow P 500 is rated to 550°C with waveguide transducers). Specialized inline meters for steam measurement operate at 300°C+. Above 200°C, standard gel coupling compounds are unsuitable — use high-temperature epoxy or specialized grease compounds rated for the service temperature, or specify a meter designed with integrated waveguide transducer isolation. Always verify the transducer temperature rating independently from the transmitter body rating.
7. How do I integrate ultrasonic meters with my existing SCADA system?
Identify your SCADA system’s communication infrastructure first: 4–20 mA loops (use analog output — universally compatible), HART multiplexer panels (use HART 7 output), Modbus RS485 network (use Modbus RTU), or Ethernet network (use Modbus TCP or EtherNet/IP). For most modern industrial SCADA systems, Modbus TCP is the simplest and most reliable integration path — configure the meter’s Modbus register map to match your SCADA tag structure, verify the IP addressing, and test the connection with a Modbus polling tool before connecting to the production SCADA. For Siemens DCS systems, specify PROFIBUS PA or PROFINET from the purchase order — retrofitting protocol adapters is significantly more expensive and less reliable than specifying the correct native protocol initially.
8. What is the typical lifespan of ultrasonic flow meter transducers?
Quality transit-time transducers have a mean time between failure (MTBF) of 100,000+ operating hours — approximately 11 years at continuous 24/7 operation. Actual service life depends heavily on temperature stability, vibration exposure, and coupling compound maintenance. Doppler transducers in abrasive slurry applications may require replacement every 3–5 years. Implement a transducer health monitoring program using the transmitter’s built-in signal strength diagnostics — a progressive decline in signal strength over months (rather than a sudden drop) indicates gradual transducer deterioration that will eventually result in measurement failure, giving you 3–6 months of advance warning to schedule replacement.
9. Can ultrasonic meters measure bidirectional flow?
Yes — transit-time meters inherently measure both forward and reverse flow with equal accuracy in both directions, because the underlying measurement is the sign of Δt (positive for forward flow, negative for reverse). Most transmitters sum forward and reverse totalizations separately, enabling net flow calculation. Ensure the meter is configured for bidirectional operation before installation, and verify that the SCADA system correctly processes the sign convention for reverse flow (some older systems require an offset or scaling adjustment to display negative flow values correctly). Bidirectional capability is particularly valuable for heat exchanger energy metering, district energy substations, and hydraulic pump test benches.
10. What factors most affect ultrasonic meter accuracy in real-world applications?
The five factors with the greatest impact on field accuracy are: (1) pipe condition — corrosion, scale, and non-uniform wall thickness degrade clamp-on signal quality and alter the pipe bore used in flow calculation; (2) installation geometry — insufficient straight pipe run or transducer misalignment can introduce ±5%–10% errors; (3) fluid characteristics — viscosity, temperature, and particulate content all affect velocity profile and acoustic transmission; (4) vibration and EMI — mechanical vibration at the pipe and electromagnetic interference from VFDs can corrupt measurement; and (5) maintenance — coupling compound degradation and transducer drift over years of service progressively degrade accuracy if not actively managed. A well-executed pre-installation survey and a structured preventive maintenance program address all five factors systematically.
11. How much does a typical ultrasonic flow meter system cost?
Portable clamp-on meters range from $2,500 to $10,000 per kit (covering DN15–DN3000). Fixed clamp-on meters range from $1,500 to $12,000 depending on feature level and brand. Inline process meters cost $3,000 to $30,000 for single- to dual-path configurations; custody transfer multi-path meters start at $15,000 and can exceed $80,000 for large fiscal metering stations. Total installed cost adds $500–$15,000 for installation labor, pipe work, and commissioning depending on application complexity. Budget separately for annual calibration ($500–$2,500 for professional field verification), extended service agreements, and any required cable routing or infrastructure modifications.
12. What compliance standards apply to ultrasonic flow meters?
Key standards include: ISO 6416 (liquid flow in open channels), ISO 17089-1 (gas meters), AGA Report No. 9 (multipath gas ultrasonic for custody transfer), API MPMS Chapter 5.8 (liquid custody transfer), OIML R49 (water meters), OIML R117 (liquid meters for custody transfer), ATEX Directive 2014/34/EU (hazardous area equipment), FM/CSA (North American hazardous area), FDA 21 CFR Part 211 (pharmaceutical process equipment), and ISO 50001 (energy management systems). Verify the specific standard requirements for each application during procurement — a meter certified for process monitoring may lack the required certification for custody transfer or pharmaceutical applications.
13. How do I choose between clamp-on and inline ultrasonic meters?
The decision tree is straightforward. If the process cannot be interrupted for installation: clamp-on is the only option. If ±1%–2% accuracy meets the application requirement: clamp-on provides better economics. If custody transfer, fiscal metering, or regulatory reporting requires ±0.5% or better: inline multi-path is required. If the fluid is corrosive, radioactive, or pharmaceutically sensitive: clamp-on eliminates wetted parts risk. If the pipe is large (DN600+): clamp-on installation cost is far lower than spool-piece fabrication. In practice, 70%–80% of new industrial monitoring installations specify clamp-on; 20%–30% of high-accuracy or regulatory applications specify inline.
14. What maintenance does an ultrasonic flow meter require?
Clamp-on meters require minimal maintenance: visual inspection monthly, signal strength and zero-flow verification quarterly, and coupling compound inspection and replacement annually. Inline meters require periodic calibration verification (annually for custody transfer, biennially for process monitoring) and transducer inspection during planned maintenance shutdowns. Keep a maintenance log for every installed meter, recording signal quality, zero reading, and calibration verification results at each visit. This log is essential evidence of due diligence for regulatory compliance and warranty claims.
15. Can ultrasonic meters measure gas flow?
Yes — specialized transit-time ultrasonic meters are used for natural gas, industrial gases, and compressed air measurement. Gas ultrasonic meters require different transducer configurations (higher acoustic power, specialized impedance matching), PTZ compensation (for pressure, temperature, and compressibility), and calibration against certified gas flow standards. The leading gas ultrasonic products include Baker Hughes Panametrics DigitalFlow GF868, SICK FLOWSIC500, and Emerson Daniel SeniorSonic — all AGA-9 compliant for custody transfer applications. Note that gas measurement requires significantly higher acoustic power than liquid measurement because gases have much lower acoustic density — not all liquid clamp-on meters can be adapted for gas service.
Making the Right Decision for Your Clients
Selecting the optimal ultrasonic flow meter requires balancing technical specifications against application realities, budget constraints, and the long-term support infrastructure that will keep the measurement performing accurately a decade from now. The client who buys the cheapest meter that technically meets their accuracy requirement, but discovers three years later that local service support is non-existent and that the manufacturer’s firmware updates have changed the calibration, has not made a good investment. Your value as a distributor or agent is the ability to navigate these trade-offs systematically — applying the kind of application knowledge this guide provides to recommend solutions that deliver measurable performance and total cost advantages that clients can document in their own maintenance records.
The ultrasonic flow meter market’s growth from $2.08 billion in 2025 toward $3.56 billion by 2032 is being driven by three forces that align directly with the B2B distributor’s opportunity: the global retrofit market for non-invasive measurement on existing infrastructure; the accelerating demand for digital integration and cloud-connected meter data; and the economic pressure on industrial clients to reduce energy consumption, eliminate measurement-related disputes, and extend equipment service life. Each of these drivers creates sales conversations in which distributors with deep technical knowledge of ultrasonic technology — of the kind this guide provides — convert more inquiries into orders than those who simply send a price list.
Whether you are recommending a Jade Ant Instruments clamp-on ultrasonic meter for a cost-sensitive industrial monitoring application, an Endress+Hauser Prosonic for a premium process industry project, or a Baker Hughes Panametrics Sentinel for an oil terminal’s custody transfer station, the selection framework is the same: characterize the fluid, define the accuracy requirement, evaluate the installation constraints, calculate the total cost of ownership, and verify the service infrastructure. Apply that framework consistently, and your clients’ measurement systems will perform — and your commercial results will reflect the trust you have earned.
Ready to expand your ultrasonic flow meter portfolio or win more technical specifications for your clients? The Jade Ant Instruments product catalogue covers clamp-on, inline, and open channel ultrasonic meters with full technical documentation, multi-protocol communication, and competitive OEM/ODM options tailored for distribution partners. Download the detailed product comparison matrix, request factory pricing for your target applications, or schedule a technical consultation with our application specialists. Contact our sales team today to explore distributor partnership opportunities and access exclusive pricing on high-volume orders.
Glossary of Key Technical Terms
Transit-Time Measurement: An ultrasonic measurement principle that calculates fluid velocity from the difference in travel time (Δt) between pulses sent upstream and downstream. Requires clean, acoustically homogeneous fluid. Accuracy: ±0.15%–2.0% depending on path count and installation quality.
Doppler Measurement: An ultrasonic principle measuring the frequency shift of signals reflected by particles or bubbles in the fluid. Requires minimum suspended solids or gas content (>75 mg/L). Accuracy: ±2%–5%. Used for wastewater, slurries, and mixed-phase fluids.
Multi-Path Meter: An inline ultrasonic meter using 4–8 acoustic chords at different positions in the pipe cross-section to measure the full velocity profile. Achieves ±0.15%–0.5% accuracy. Required for AGA-9 gas custody transfer and API MPMS Chapter 5.8 liquid fiscal metering.
Δt (Transit-Time Difference): The time difference between downstream-travelling and upstream-travelling ultrasonic pulses. Proportional to fluid velocity. At zero flow: Δt = 0. At 1 m/s in DN100: Δt ≈ 15 microseconds.
Turndown Ratio (Rangeability): The ratio between the maximum and minimum flow rates the meter measures accurately. Transit-time meters achieve 100:1 to 300:1 — far exceeding differential pressure meters (3:1 to 5:1).
PTZ Compensation: Correction of gas volumetric flow for actual Pressure, Temperature, and compressibility factor (Z) to convert to standard conditions. Essential for accurate mass or standard volumetric flow measurement in gas applications.
AGA Report No. 9: The American Gas Association’s performance standard for multipath ultrasonic meters in natural gas fiscal metering. Specifies ±0.7% accuracy at minimum and maximum flow, diagnostic requirements, and calibration traceability.
ATEX/IECEx: European (ATEX) and international (IECEx) certification frameworks for electrical equipment in explosive atmospheres. Zone 1 = explosive atmosphere expected in normal operation; Zone 2 = only under abnormal conditions. Non-negotiable for installation in classified hazardous areas.
Clamp-On Configuration: Transducers attached to the outside of an existing pipe — no cutting, no process contact, no shutdown required. Accuracy: ±1%–2% (single-path); ±0.5%–1% (dual-path). Standard retrofit solution for process monitoring and corrosive-fluid measurement.
Straight Pipe Requirement: The minimum undisturbed pipe length upstream and downstream of a flow meter needed to ensure a fully developed, stable velocity profile. Typically 10D upstream and 5D downstream for clamp-on meters; 15D upstream for inline multi-path.