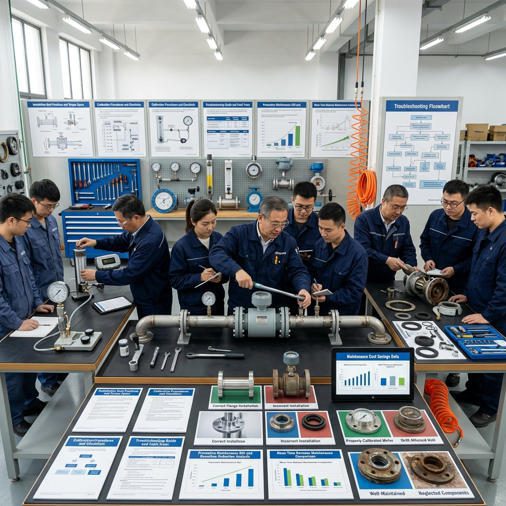

Why Analog Flow Meter Maintenance Determines Your Customer’s Operational Profitability
El mercado mundial de caudalímetros alcanzó USD 11 billion in 2025 and is projected to exceed USD 20 billion by 2035 at a CAGR of approximately 6% (Fortune Business Insights, 2025). Within this market, analog flow meters — rotameters, turbine meters, positive displacement meters, and differential pressure devices — represent the backbone of measurement in thousands of industrial facilities worldwide. They keep running long after their digital counterparts have been replaced, precisely because they are mechanically simple and remarkably durable when properly maintained.
But “durable” is not the same as “self-maintaining.” A turbine meter in a fuel oil line that has never been serviced over 5 years may be reading 6–9% high — costing the end user tens of thousands of dollars annually in billing discrepancies or product waste, without anyone in the plant noticing until an audit fails. That failure didn’t come from a product defect. It came from a skipped maintenance programme.
For distributors and agents, this reality creates a commercial opportunity: the partners who understand maintenance deeply, who can walk a customer through a calibration schedule, who can diagnose a reading drift before it becomes a shutdown — those are the partners who earn long-term contracts, not just one-time transactions.
This guide provides a complete technical and commercial framework for mastering analog flow meter maintenance, from day-one installation through annual overhaul, calibration compliance, predictive monitoring, and cost justification. Every section is built for your role as a distributor or agent, not for the end-user engineer reading a manual in isolation.
Installation Best Practices — Getting It Right From Day One
Pre-Installation Assessment and Planning
Evaluating System Requirements
Every installation problem that emerges 18 months into a meter’s service life can usually be traced back to a question that wasn’t asked at the specification stage. Before a single pipe is cut, the following parameters need clear answers:
Flow rate range: What is the minimum, normal, and maximum flow rate — not the pipe’s theoretical capacity? A 4-inch pipe can carry anywhere from near-zero to over 2,000 L/min. The meter must operate in the 30–80% range of its rated capacity for best accuracy. Operating below 20% of range is where most accuracy specifications become meaningless.
Fluid properties at operating conditions: Water at 20°C behaves very differently from the same water at 85°C, or from a 60% glycol mix, or from a pharmaceutical buffer with fine particulates. Viscosity, density, pH, and solids content all directly affect meter choice and maintenance frequency.
Measurement accuracy requirements: A seal water bypass line needs only ±5% accuracy; a custody transfer billing meter may require ±0.2%. These two applications should never receive the same specification, nor the same maintenance programme.
Site Preparation and Safety Considerations
The physical environment of the installation point shapes long-term meter health more than almost any other factor. Identify and document:
- Vibration sources: Pumps, compressors, and reciprocating machinery within 3 metres create oscillating forces that cause float oscillation in rotameters, bearing wear in turbine meters, and signal noise in all types. Where vibration is unavoidable, specify vibration-damped mounting or metal-tube rotameters rather than glass.
- Maintenance access: Will the technician be able to reach the meter with a torque wrench, a calibration reference, and both hands? A meter installed 3 metres above floor level with no access platform will never be maintained properly. Physical access is a compliance issue, not just a convenience.
- Electrical area classification: ATEX Zone 1, Zone 2, Division 1, or Division 2 ratings must be confirmed before any meter with an electrical output is specified. Non-compliant equipment in hazardous areas is a safety and insurance liability — confirm before order, not after delivery.
Step-by-Step Installation Procedures
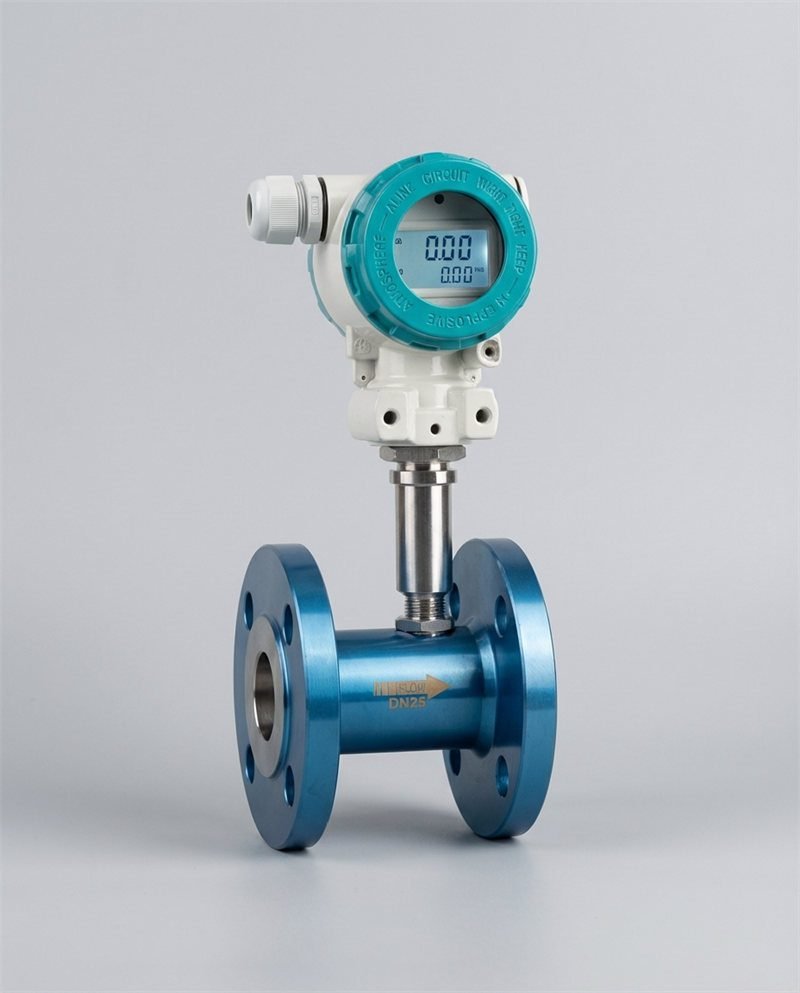
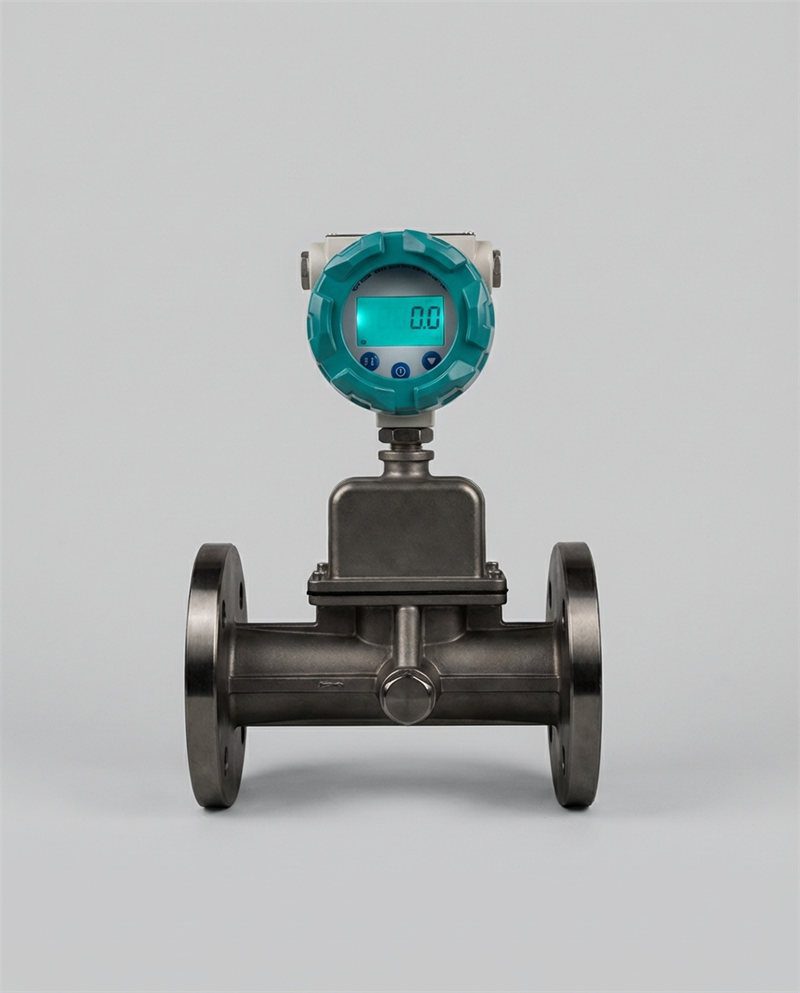
 Upstream straight-pipe run is one of the most frequently violated installation requirements. Turbine and DP meters need 10–20 pipe diameters of undisturbed straight pipe to produce accurate readings.
Proper Pipe Integration and Orientation
The upstream straight-pipe requirement is the rule most frequently violated in the field — and the one most directly responsible for chronic accuracy errors. Here is what each major analog meter type actually requires:
| Tipo de contador | Upstream Straight Run (D = pipe diameter) | Downstream Straight Run | Orientation | Accuracy Impact of Short Run |
|---|---|---|---|---|
| Glass Rotameter | 3–5 D | 3 D | Vertical upward only | ±2–5% FS additional error |
| Metal Tube Rotameter | 5 D | 3 D | Vertical preferred; H possible | ±1–3% FS additional error |
| Turbine Meter | 10–20 D (15 D typical after single elbow) | 5 D | Horizontal preferred | ±2–8% RD accuracy degradation |
| Oval Gear (PD) | None required | None required | H or V (check manufacturer) | Minimal — profile-independent |
| DP / Orifice Plate | 15–50 D (ISO 5167) | 5–8 D | Any (correct tap position) | ±3–10% RD if <10 D upstream |
Pipe size matching: Never connect a DN50 meter directly to a DN100 pipeline without a properly designed reducer section. Abrupt reducers create turbulence that propagates several pipe diameters downstream — always use tapered reducers with a maximum expansion angle of 15° for liquids. Reducer length should be at least 2× the diameter difference.
Air pockets: For liquid meters, installation at the top of a pipe loop creates an air trap that registers as erratic high readings. Rotameters must be vertical and full. Turbine meters must always run full-bore — a partially filled pipe produces readings 15–40% below true flow. Where air pockets are possible, install a bleed valve at the high point upstream of the meter.
Connection and Sealing Techniques
Threaded connections are the most common leak point in analog flow meter installations, and almost all of those leaks result from one of three errors: wrong sealant, wrong torque, or wrong gasket material.
- PTFE thread tape: apply 2–3 wraps clockwise on male threads for water/gas service. Do not use on stainless-to-stainless fittings (galling risk) — use anaerobic pipe sealant instead.
- Torque specifications: follow manufacturer data; typical DN25 stainless flange bolt torques are 40–55 Nm. Over-torquing distorts meter bodies and shifts the calibrated geometry — a common cause of zero shift in new installations.
- Gasket material matching: PTFE gaskets for general chemical service; EPDM for hot water/steam; Viton for petroleum products; FFKM for aggressive solvents. A mismatched gasket that swells or hardens will create a leak within weeks, not years.
Post-Installation Verification
Initial System Checks
- Pressure test to 1.5× operating pressure (hydrostatic) before energising meter electronics
- Verify flow direction arrow on meter body matches actual fluid flow direction in pipe
- Confirm meter orientation matches specification (glass rotameter truly vertical within ±2°)
- Check all electrical connections: correct polarity, cable gland integrity, grounding conductor continuity
- Verify upstream strainer installed and clean (mandatory for turbine and PD meters)
- Bleed all air from liquid lines before taking baseline readings
- Record baseline readings at 25%, 50%, 75%, and 100% of normal operating flow
Commissioning and Documentation
The commissioning record created on Day One is the reference against which every future calibration result is measured. A facility that loses its commissioning data effectively loses the ability to distinguish normal drift from abnormal degradation. Minimum commissioning documentation:
- Installation date, installer name and certification level
- Meter tag number, model number, serial number, and manufacturer calibration certificate number
- Fluid type, operating temperature, pressure, and flow rate at commissioning
- Baseline readings at 25% / 50% / 75% / 100% of range, with reference flow measured independently
- Photograph of installed meter showing pipe connections, orientation, and label plate
- Next scheduled calibration date
Video: Types of flow meters, operating principles, and maintenance considerations across industrial applications.
Calibration Procedures — Maintaining Measurement Accuracy
Understanding Calibration Requirements
Calibration Standards and Compliance
CalibrationCalibration is the controlled process of comparing a meter’s output against a traceable reference standard, then documenting or correcting any deviation. It does NOT mean simply adjusting the meter — documentation of the “as-found” state before any adjustment is a legal requirement in most regulated industries. for analog flow meters is governed by a hierarchy of international standards. Understanding which standard applies to your customer’s application determines calibration frequency, documentation requirements, and acceptable accuracy tolerances.
| Estándar | Scope | Applicable Meter Types | Accuracy Requirement | Record Retention |
|---|---|---|---|---|
| ISO 11631 | General liquid / gas flow meter performance description | Todos los tipos | Per meter class specification | Min. 5 years |
| ISO 9001:2015 (Clause 7.1.5) | Quality management measuring equipment control | All types used in production | Fit-for-purpose per risk assessment | Min. 3 years (audit cycle) |
| OIML R117 | Custody transfer of liquids other than water | PD meters, turbine meters | Class 0.3 = ±0.3%; Class 0.5 = ±0.5% | Min. 5 years (legal metrology) |
| OIML R49 | Water billing meters | Turbine, PD, electromagnetic | Class B: ±2%; Class C: ±1% | Per local utility regulation |
| API MPMS 5.3 / 5.2 | Petroleum custody transfer | Turbine, PD oval gear | ±0.25% for approved meters | Min. 2 years after calibration |
| ASME MFC-3M | DP / orifice measurement | Orifice plate, flow nozzle, venturi | ±0.5–1.0% per geometry | Per plant QMS |
For a practical walkthrough of calibration setup procedures applicable to most analog flow meters, the Jade Ant Instruments calibration setup guide provides step-by-step field methodology.
Calibration Frequency and Intervals
There is no single “correct” calibration interval — but there are well-established frameworks for determining the right one for each application. The Tektronix calibration guide recommends starting with manufacturer recommendations and adjusting based on observed drift history:
| Application Category | Typical Calibration Interval | Trigger for Shorter Interval | Acceptable Extension Condition |
|---|---|---|---|
| Custody transfer / billing (oil, water) | 6–12 months (regulatory mandate) | Drift >0.5% detected at mid-term check | Only with regulator approval + metrological data |
| Revenue metering (non-regulated) | 12 months | Process fluid change; high particulate load | 18 months with documented stable drift history |
| Process control (quality-critical) | 12 months | Yield loss, product quality complaints | 24 months on very stable, clean, single-fluid service |
| Process monitoring (non-critical) | 18–24 months | Visible drift on trend data | 36 months with semi-annual spot checks |
| Utility / seal water / HVAC monitoring | 24–36 months | Significant process changes | Annual visual check sufficient between calibrations |
Pre-Calibration Preparation
Equipment and Tools Needed
- Reference standard: a calibrated reference meter or master meter with current calibration certificate, traceable to NIST or national equivalent. For in-situ verification, a clamp-on ultrasonic meter with ±0.5% accuracy is often used as a reference.
- Pressure gauges: calibrated, uncertainty ≤0.1% FS, for both upstream and downstream pressure measurement.
- Temperature sensor: calibrated thermometer or RTD, ±0.2°C, to correct for viscosity and density effects.
- Data recording system: calibration software or a structured paper form that captures as-found readings, adjustments made, and as-left readings — all signed and dated.
- Meter-specific tools: appropriate spanners, torque wrenches to manufacturer specification, sealants for re-assembly.
System Stabilization Before Calibration
Taking calibration readings on an unstabilised system is one of the most common causes of poor calibration results. The fluid must be at operating temperature (±2°C of normal) and pressure (±1% of normal) for at least 15 minutes before any readings are recorded. Pulsating flow from reciprocating pumps must be damped with a pulsation dampener or measured using a time-averaging technique — a single-point reading on a pulsating line can carry ±8–15% error.
Calibration Execution
Multi-Point Calibration Methodology
A single-point “zero and span” check is adequate only for monitoring applications with minimal accuracy requirements. Any meter involved in billing, custody transfer, or quality-critical process control requires a minimum of four calibration points across its operating range:
- Set flow to 25% of normal operating range. Stabilise for 5 minutes. Record meter reading and reference reading. Calculate deviation.
- Set flow to 50% of normal operating range. Stabilise. Record meter reading, reference reading, deviation. Note any linearity issues between low and mid range.
- Set flow to 75% of normal operating range. Stabilise. Record. This point often reveals whether calibration drift is uniform or load-dependent.
- Set flow to 100% of normal operating range (maximum expected flow). Stabilise. Record. Compare against original commissioning baseline at this flow rate.
- For custody transfer meters: add a repeat pass at 50% after completing 100%, to check for hysteresis (the difference in reading between rising and falling flow).
Adjustment and Correction Procedures
Before making any physical adjustment, document the “as-found” condition at all calibration points. This is the legally and technically important record — it shows what the meter was doing before intervention. Post-adjustment, the “as-left” condition must also be documented.
For most analog meters, the two principal adjustments are:
- Zero adjustment: shifts the entire calibration curve up or down by a fixed amount. Applied when all calibration points show a uniform offset.
- Span adjustment: changes the slope of the calibration curve. Applied when low-range and high-range readings diverge — for example, reading 1% high at 25% flow but 4% high at 100% flow suggests a span error.
Post-Calibration Validation and Certification
After all adjustments, run through the full four-point test sequence again as validation. All points must now fall within the specified accuracy tolerance. If any point remains outside tolerance after two adjustment attempts, flag the meter for repair or replacement — further adjustment will typically mask the underlying mechanical issue.
The calibration certificate must include: meter identification, reference standard identification and certificate number, all as-found and as-left readings, uncertainty of the calibration measurement, technician name and signature, calibration date, and next due date. For ISO 9001 or OIML-regulated applications, a missing signature or traceability reference voids the certificate entirely.
Troubleshooting Common Issues — Diagnosing Problems Quickly
 Systematic diagnosis — working from the most probable cause toward the most complex — is faster and cheaper than replacing a meter that may not be the root cause of the problem.
Troubleshooting Matrix — The 8 Most Common Accuracy Failures
| # | Symptom | Most Likely Root Cause | Diagnostic Step | Corrective Action | Urgency |
|---|---|---|---|---|---|
| 1 | Reading suddenly 10–30% higher | Partial blockage upstream or in meter | Check upstream strainer; inspect float/rotor for debris | Flush system; clean strainer; inspect and clean meter internals | Immediate |
| 2 | Erratic fluctuating readings (±5–15%) | Air entrainment or pulsating flow | Check for bubbles at bleed valve; install pulsation dampener | Bleed air; install dampener; check pump condition | Within 1 week |
| 3 | Gradual upward drift over months (+1–5%) | Bearing wear (turbine) or float wear (rotameter) | Inspect rotor/float for wear marks; compare to commissioning baseline | Replace bearing cartridge or float; recalibrate | At next planned PM |
| 4 | Reading lower than expected (−5–15%) | Partial internal blockage; scale build-up | Disassemble and inspect meter internals; check fluid for scale-forming ions | Chemical clean or mechanical descale; consider water treatment upstream | Within 2 weeks |
| 5 | Zero reading with confirmed flow present | Stuck float (rotameter) or seized rotor (turbine) | Manually verify flow with reference meter; inspect for solid particles or corrosion binding moving parts | Disassemble; clean; replace stuck components; verify fluid compatibility | Immediate |
| 6 | Visible leak at connections or meter body | Failed gasket; loose fittings; corrosion breach | Identify leak point precisely; check gasket material compatibility with fluid | Tighten to spec torque; replace gasket with compatible material; consider meter replacement if body corroded | Immediate |
| 7 | Accuracy good at mid-range, poor at high/low extremes | Non-linearity from wear, contamination, or wrong meter range | Run 5-point calibration check; compare linearity to original data sheet | If linearity degraded >50% from spec: recalibrate or replace; consider re-sizing the meter | Within 1 month |
| 8 | Readings vary with ambient temperature (±3–8% seasonal) | Thermal expansion of components; viscosity shift with temperature | Correlate readings against temperature log; calculate expected viscosity change | Install temperature compensation; consider meter type change for high-viscosity variable-temperature service | Planned improvement |
Identifying Gradual Reading Drift
Trending Analysis for Predictive Maintenance
Drift — a slow, progressive shift in calibration — is the most insidious analog meter problem because it rarely triggers an alarm. A meter drifting at 0.3% per month reaches a 3.6% total error in 12 months, crossing the typical process control tolerance band without any single reading change being obviously wrong.
The tool that catches drift early is a trend chart: a graph of monthly spot readings against known-stable process conditions (e.g., always checked against pump curve calculations at the same flow setpoint). Even a simple spreadsheet with monthly readings will reveal a trend within 3–4 data points. Facilities with this practice in place reduce emergency recalibration events by approximately 60% compared to those relying purely on fixed-interval calibration.
🔀 Drift Diagnosis — Decision Tree
Preventive Maintenance Schedules — Planning for Long-Term Performance
Visual Overview: Recommended Maintenance Schedule
📅 Daily / Weekly
- Read and log flow values
- Visual check for leaks
- Check for unusual noise or vibration
- Confirm readings vs. expected process values
- Inspect connections for signs of seepage
📆 Monthly / Quarterly
- Detailed visual inspection
- Check corrosion, coating condition
- Inspect gaskets and seals
- Review trend data against baseline
- Verify upstream strainer cleanliness
- Check mounting bolts and supports
🔁 Semi-Annual
- Preventive flushing of meter body
- Seal and gasket condition assessment
- Damping device function check
- Full drift check against reference
- Review and update calibration interval
- Check float / rotor condition
🗓️ Annual
- Full multi-point calibration
- Issue calibration certificate
- Planned seal and gasket replacement
- Bearing inspection/replacement (turbine)
- Update maintenance records
- Set next calibration date
- Review meter performance history
Daily and Weekly Maintenance Tasks
Visual Inspections and Monitoring
Daily reading documentation is not busywork — it is the earliest warning system available for a flow measurement system. A plant operator who looks at the rotameter every morning and notices “it usually reads 45 L/min at this time of day but today it reads 52” has just detected a potential blockage or calibration shift before it becomes a problem. That observation is worth more than a scheduled monthly inspection.
In practice, create a simple daily log sheet for each monitored meter that records: time, reading, operator initials, and any unusual observations. Within 4–6 weeks, this data provides a reliable expected-value baseline that makes anomaly detection intuitive even for non-specialist operators.
Quick Performance Verification
Once per shift in critical applications, once per day in standard process monitoring: compare the flow meter reading against an independent check. This could be as simple as comparing the rotameter reading against the pump flow curve (pump speed → expected flow from curve), or checking that tank level is rising at the rate the flow meter predicts. These 30-second spot checks catch major failures — stuck floats, seized rotors, complete blockages — immediately rather than at the next scheduled calibration.
Monthly and Quarterly Maintenance
Comprehensive System Inspections
Monthly inspections should be more thorough than daily visual checks, with the technician specifically looking for conditions that develop slowly and therefore escape daily notice:
- External corrosion progression: Compare photographs from previous inspection. Pitting corrosion on a stainless steel flange, if caught at 0.3 mm depth, is a monitoring item; at 1.5 mm depth it is an imminent failure.
- Seal condition: Soft rubber seals exposed to aggressive chemicals or UV radiation harden over 12–24 months. A hardened seal that still “doesn’t leak” during normal operation will fail during a pressure transient.
- Downstream reading patterns: Unusual downstream conditions (pressure drops, colour changes in transparent piping) often flag meter internals degradation before any reading change appears.
Semi-Annual Maintenance Procedures
Preventive Cleaning and Flushing
Semi-annual flushing removes accumulations that neither daily inspection nor calibration checks catch. For turbine meters in moderate-solids service, flushing with clean water at maximum flow velocity for 5–10 minutes can remove up to 80% of the fine particulate that deposits in rotor bearing channels. For rotameters in chemical service, a brief soak with a compatible solvent (confirmed against gasket material) dissolves scale build-up on the float and tube that gradually shifts the float’s reading upward.
An important caution: never flush with a fluid not compatible with all wetted materials. Confirm solvent compatibility with every seal, gasket, and body material in the meter before any cleaning chemical is introduced.
Component Condition Assessment
At semi-annual inspection, physically remove and examine:
- Upstream strainer element — replace if more than 25% of mesh area is blocked
- Float (rotameter) — check for pitting, edge wear, and surface deposits that alter its hydrodynamic coefficient
- Rotor (turbine) — check blade tip clearance and bearing drag (spin by hand: a healthy turbine rotor spins freely for several seconds; excessive bearing friction causes sub-reading at low flow)
- Damping device (if installed) — confirm damping fluid level and condition
Annual Calibration and Overhaul
Full Calibration Service
The annual calibration is the most significant maintenance event in the analog flow meter lifecycle. It is both a technical and a commercial event: the calibration certificate issued at this point is the documentary evidence that the meter’s data was valid throughout the past 12 months — critical for ISO 9001 audits, OIML compliance, and any contract with measurement accuracy terms.
For distributors, the annual calibration is also the highest-value service interaction. A distributor who provides calibration services — even if using a certified third-party lab — becomes a mandatory touchpoint in the customer’s operation every 12 months. This relationship continuity protects against competitive displacement far more reliably than price alone.
For calibration of variable area flow meters specifically, the Jade Ant Instruments rotameter calibration guide provides step-by-step field methodology with diagnostic pointers for common failure modes.
Fluid Properties and System Compatibility — Ensuring Proper Operation
Understanding Fluid Characteristics
Viscosity and Flow Behaviour
ViscosityViscosity is a fluid’s resistance to flow, measured in centistokes (cSt) or centipoise (cP). Water at 20°C = 1 cSt. Motor oil at 40°C ≈ 100 cSt. Honey ≈ 2,000–10,000 cSt. As viscosity increases, turbine meters over-read at low flow; positive displacement meters are largely unaffected. is the single fluid property with the greatest impact on analog flow meter accuracy, yet it is the one most frequently omitted from specification documents.
Consider a real-world example from a Southeast Asian refinery: a turbine meter was installed on a light fuel oil line, correctly calibrated at 20 cSt (operating temperature of 45°C). During winter shutdowns, the oil temperature dropped to 18°C, raising viscosity to 110 cSt. At that viscosity, the turbine rotor experienced significantly more drag and began reading 7% low — meaning 7% more fuel was flowing through the line than being measured. Over a 3-month season, this represented a USD 28,000 metering shortfall on a single line. Switching to an oval gear positive displacement meter, which is accuracy-independent of viscosity, eliminated the problem entirely.
Contamination and Particulate Matter
Particulate contamination is the leading cause of premature mechanical failure in turbine and positive displacement flow meters. The threshold is approximately 100 mg/L of suspended solids for unprotected turbine meters — above that level, bearing erosion accelerates non-linearly. A Y-type strainer with 100-mesh element installed upstream extends turbine bearing life from a typical 2–3 years in moderate-particulate service to 8–12 years. The cost of an appropriately specified strainer (USD 80–300) versus bearing replacement plus calibration (USD 600–1,500) makes the case straightforwardly.
Material Compatibility and Corrosion Prevention
 Material incompatibility between the meter’s wetted surfaces and the process fluid is a common cause of premature failure. Always verify chemical resistance before installation — not after the first leak.
Selecting Appropriate Meter Materials
| Fluid Type | Recommended Body Material | Recommended Seal / Gasket | Avoid |
|---|---|---|---|
| Clean water / cooling water | 316L SS, cast iron, bronze | EPDM, nitrile | Zinc in low-pH water (dezincification) |
| Dilute acids (pH 3–6) | 316L SS, CPVC, PVDF | PTFE, Viton | Carbon steel, uncoated aluminium |
| Strong acids (H₂SO₄, HCl, HF) | Hastelloy C-276, PTFE-lined | PTFE, FFKM | All standard SS grades (pitting risk) |
| Alkalis (NaOH >20%) | 316L SS, polypropylene | EPDM | Aluminium (accelerated attack) |
| Petroleum / fuel oils | Carbon steel, 316 SS | Viton, NBR | EPDM (swells in hydrocarbons) |
| Food / beverage / pharma | 316L SS (Ra ≤0.8 µm), PEEK | EPDM (FDA), Silicone (FDA) | Standard nitrile (not FDA approved) |
| High-temp steam (>150°C) | Carbon steel, SS with stellite internals | Graphite, spiral wound | Soft elastomers (degrade above 120°C) |
Corrosion Monitoring and Prevention
External corrosion on flanges and fittings is visible at quarterly inspection. Internal corrosion — which affects accuracy by changing orifice dimensions and float characteristics — is only detectable by disassembly or by observing a calibration shift that cannot be explained by process changes. Meters in aggressive service should be disassembled and internally inspected every 3–5 years. Any pitting deeper than 0.2 mm on a metering surface (orifice edge, float body, rotor blade) warrants replacement of that component.
Advanced Maintenance Techniques — Optimizing Performance
Condition Monitoring and Predictive Maintenance
Data Analysis and Trend Recognition
Predictive maintenance — maintaining equipment based on observed condition rather than fixed time intervals — is the most cost-effective approach for a large analog flow meter fleet. The US Department of Energy documents 10× ROI on predictive maintenance programmes compared to purely reactive approaches, with a 70% reduction in breakdown rate and 25–30% overall maintenance cost savings (Oxmaint/DOE data, 2024).
For analog flow meters specifically, the key predictive indicators are:
- Calibration drift rate: if a turbine meter that historically drifted 0.2% per month begins drifting at 0.5% per month, bearing wear has accelerated. Schedule inspection before the next planned calibration date.
- Zero-flow reading: a meter that shows a non-zero reading when the system is confirmed at zero flow has developed a mechanical leak path, float fouling, or electrical offset. Address before returning to service.
- Response lag: an analog meter that takes longer than usual to reach a stable reading after a flow change is showing the first sign of increased internal friction — a bearing approaching its wear limit.
Remote Monitoring Solutions
Modern smart transmitters can convert analog meter outputs (4–20 mA) into HART or Modbus data streams for remote monitoring platforms. This enables continuous trend logging, automatic alarm when readings deviate from expected ranges, and remote calibration verification — without changing the analog meter itself. For distributors, offering this retrofit service adds significant value to an existing customer’s installed base.
For integration guidance connecting flow meters to SCADA and PLC systems, the Jade Ant Instruments product overview covers 4–20 mA, HART, Modbus, and pulse output options across the full meter range.
📊 Maintenance Strategy Impact — Average Outcomes per 50-Unit Analog Meter Fleet (Annual)
Metric: Annual cost impact per 50-unit fleet (USD basis, compiled from DOE / ATS / MaintainX industry data 2024)
Emergency Repair Cost (USD / yr)
Unplanned Downtime Events (per yr)
Average Meter Operational Lifespan (years)
Sources: US Department of Energy; ATS Industrial Services (2024); MaintainX Predictive Maintenance ROI Study (2024). Indicative values — actual results vary by application, fluid type, and maintenance execution quality.
Performance Optimization Strategies
System Design Improvements
Many chronic accuracy problems in analog flow meters are not meter problems at all — they are system design problems that the meter is simply reflecting. Before recommending a meter replacement or more frequent calibration, evaluate:
- Flow conditioning: A tube bundle or perforated plate installed 5D upstream of a turbine meter can reduce the required straight run from 20D to 10D and improve velocity profile symmetry by 40–60%. For retrofit situations where piping cannot be extended, a flow conditioner often costs less than the accuracy error it eliminates.
- Pump pulsation management: Reciprocating pumps create pressure pulses that cause turbine rotors to spin in surges, systematically over-reading by 5–15%. Installing a gas-charged accumulator between the pump and meter reduces pulsation amplitude and recovers accurate measurement without any changes to the meter itself.
- Temperature management: In outdoor installations in variable-climate regions, insulating the meter body and a short section of upstream pipe reduces the viscosity variation the meter experiences, reducing temperature-related drift by 30–50%.
Training and Documentation — Building Operational Excellence
Staff Training Programs
Operator Training Requirements
The operator who reads the meter every day is the first line of defence against undetected drift and mechanical failure. Operator training for analog flow meters does not need to be complex — but it must cover:
- How to read the specific meter type correctly: for rotameters, reading at the float’s equatorial plane (not top or bottom); for turbine meters with local indicators, understanding the totaliser vs. rate display.
- What constitutes a normal reading range: what is the expected reading at this time of day, at this product, at this process condition? Any reading more than 5% outside the expected band requires immediate supervisor notification.
- How to check for common obvious failures: is the float stuck at zero or at maximum? Is there a leak at any connection? Is there an unusual sound from the meter body?
- Safe isolation procedures: how to isolate the meter using bypass valves for maintenance without shutting down the entire process line.
Technician Certification Programs
Maintenance technicians responsible for calibration and repair should be trained to at least the level of the specific manufacturer’s service certification, plus familiarity with the applicable metrology standards (ISO 9001:2015 clause 7.1.5 for most industrial facilities; OIML documents for regulated metering). The investment in technician training returns in reduced calibration errors, fewer compliance non-conformances, and the ability to perform more maintenance in-house rather than relying entirely on third-party service at premium labour rates.
Documentation Best Practices
Creating Comprehensive Records
The minimum documentation set for each analog flow meter in an industrial facility:
- Installation record: date, installer, meter ID, serial number, application tag, baseline readings
- Calibration history: every calibration date, as-found readings, adjustments made, as-left readings, certificate number, next due date
- Maintenance log: every inspection event, findings, corrective actions taken, parts replaced
- Calibration certificates: filed physically or digitally with clear link to meter tag number
- Material test reports: for wetted-part materials in regulated or high-purity applications
- Troubleshooting records: each abnormal event, diagnosis, resolution, and preventive measure implemented
- Spare parts inventory: current stock of critical consumables (seals, gaskets, float, bearing cartridge)
- Regulatory compliance documents: OIML type approval certificate, ATEX/IECEx certificate (where applicable)
Knowledge Management Systems
A calibration management software package — even a well-designed spreadsheet for a small fleet — turns documentation from a compliance burden into a predictive tool. When you can sort all meters by “days since last calibration” and “drift rate at last calibration,” you can prioritise next month’s service schedule rationally, concentrating resources on the meters most likely to exceed tolerance before their nominal due date.
Cost Management and ROI Optimization — Maximizing Value
Calculating Total Cost of Ownership
🥧 Lifetime Cost Distribution — Turbine Flow Meter (DN50, 15-Year Clean Liquid Service)
- Equipment — 20% (USD 700–1,400)
- Installation — 10% (USD 350–700)
- Calibration — 30% (USD 1,050–2,100 over 15 yr)
- Maintenance — 25% (USD 875–1,750 over 15 yr)
- Downtime Risk — 15% (USD 525–1,050 estimated)
Indicative figures for a DN50 turbine meter in clean water service, USD basis, 2025 pricing. Calibration and maintenance costs dominate lifecycle cost — not the initial equipment purchase.
Demonstrating ROI to Customers — Practical Framing
Most customers experiencing reluctance to invest in a preventive maintenance programme are visualising the maintenance cost in isolation — as a cost line on a budget. The conversation changes when you frame it as a cost-reduction measure against a known baseline of reactive expenditure.
A plastics manufacturer in the UK had 30 turbine flow meters on cooling water lines, all on a “run until failure” approach. Average emergency repair cost per failure: £3,200 (including plant time, parts, emergency callout). Average failures per year across 30 meters: 11. Annual reactive cost: £35,200.
Implementing an annual preventive maintenance programme cost £480 per meter × 30 = £14,400 per year. Failure rate dropped to 2 per year. New reactive cost: £6,400. Total annual cost with PM: £20,800. Annual saving: £14,400. Payback: immediate from Year 1.
Optimizing Maintenance Budgets
Service Package Development for Distributors
The most profitable distributor maintenance model is a tiered service contract, offered at the point of meter sale rather than after the first problem occurs. A simple three-tier framework:
| Tier | Package Name | Included Services | Target Customer | Indicative Annual Price (per meter) |
|---|---|---|---|---|
| BASIC | Essential Cover | Annual calibration + calibration certificate + phone support | Non-regulated monitoring applications | USD 150–300 |
| STANDARD | Performance Assurance | Annual calibration + semi-annual inspection + drift trending + priority response | Process control; regulated billing | USD 350–600 |
| PREMIUM | Total Accuracy Management | Full preventive schedule + 2× calibration + compliance documentation + 48hr emergency response + spare parts inventory management | Custody transfer; OIML/API regulated; high-value product lines | USD 700–1,500 |
Compliance, Standards, and Regulatory Requirements — Staying Current
 Calibration certificates and maintenance logs must be organised for instant retrieval during regulatory audits. A missing certificate for a billing meter can result in retroactive measurement disputes covering the entire uncertified period.
Industry Standards and Certifications
ISO and ASME Standards Applicable to Distributors
For ISO 9001:2015 compliance under Clause 7.1.5 — the clause that governs monitoring and measuring resources — your customer must demonstrate that all measuring devices used to verify conformance of products and services are: calibrated at specified intervals against traceable reference standards, identified with calibration status, protected from adjustment that would invalidate results, and protected from damage during handling and storage. This is not optional for ISO 9001 certified organisations — it is an audit point examined in every certification and surveillance audit.
For regulated metering applications, consult the detailed breakdown of applicable standards in the Jade Ant Instruments calibration setup and standards guide.
Documentation and Audit Readiness
- All calibration certificates filed by meter tag number, retrievable in under 5 minutes during an unannounced audit
- Calibration history (minimum 3 years back) available for each meter
- Documented calibration procedures for in-house calibration activities (ISO 17025 principles apply even to non-accredited facilities)
- Evidence of reference standard traceability: the calibration certificate for your reference meter, showing its own traceable calibration
- Corrective action records for any meter found out-of-tolerance at calibration (the “as-found” record is the key document)
- Non-conformance procedure documented: what happens when a meter is found drifted by more than its tolerance? What product was affected? Was it quarantined or verified?
Glossary of Key Maintenance Terms
- As-Found / As-Left
- The meter’s calibration state before any adjustment (as-found) and after all adjustments (as-left). Both must be recorded — as-found is the legally critical data point showing what the meter was doing during the period since the last calibration.
- Calibration Drift
- A slow, progressive shift in a meter’s output relative to the true value, caused by mechanical wear, contamination, temperature cycling, or material ageing. Drift is normal; unchecked drift is a problem.
- Turndown Ratio
- The ratio of maximum to minimum accurately measurable flow. A turbine meter rated 10–100 L/min at ±1% has a 10:1 turndown. Below the minimum (10 L/min in this example), the meter’s accuracy specification no longer applies.
- OIML
- Organisation Internationale de Métrologie Légale. The international body that develops model regulations and recommendations for legal metrology — including requirements for billing and custody transfer flow meters (R117 for liquids, R49 for water).
- Traceability
- An unbroken chain of comparisons from your meter’s calibration back to a national or international measurement standard (e.g., NIST in the USA, NPL in the UK). Each link in the chain must have documented uncertainty. Without traceability, a calibration certificate has no legal standing in regulated applications.
- Hysteresis
- The difference between a meter’s reading at the same flow rate when the flow is increasing versus when it is decreasing. Significant hysteresis in a PD meter typically indicates worn or sticking gears. Acceptable hysteresis is usually <0.1% for custody transfer meters.
- Pulsation Damper
- A gas-charged or diaphragm-type device installed between a reciprocating pump and a flow meter to reduce pressure pulsations. Without dampening, turbine meter rotors oscillate with the pulsation and systematically over-read by 5–15%.
- K-Factor
- A turbine or paddlewheel meter’s calibration constant in pulses per unit volume (e.g., pulses per litre). Bearing wear changes the K-factor over time — which is why turbine meters require periodic recalibration rather than a one-time factory certificate.
- Vena Contracta
- The point of minimum flow cross-section downstream of an orifice plate, where fluid velocity is maximum and pressure is minimum. The pressure difference between the upstream tap and the vena contracta is what DP flow meters measure to determine flow rate.
Empowering Your Customers for Long-Term Success
Analog flow meters are among the most durable and reliable instruments in industrial process measurement. A well-maintained turbine or positive displacement meter, properly installed in a compatible application, will deliver accurate measurement for 15–20 years — often outlasting the process equipment it monitors. The critical word is “maintained.”
The maintenance practices covered in this guide — rigorous installation, multi-point calibration, systematic troubleshooting, preventive scheduling, and compliance documentation — are not technically complex. They require consistency, a structured approach, and a distributor or agent who understands why each step matters and can communicate that clearly to the customer.
Your role as a distributor or agent extends far beyond product supply. When you can deliver a commissioned meter with a baseline data record, follow up with a 6-month drift check, provide an annual calibration with a compliant certificate, and proactively identify a bearing approaching wear before it causes a billing discrepancy — you become operationally irreplaceable to that customer. No price-competitive alternative can replicate that relationship.
For the full product range — including glass and metal tube rotameters, turbine meters, oval gear meters, and differential pressure measurement solutions — backed by comprehensive technical documentation and distributor support, explore the Jade Ant Instruments rotameter range and the complete flow meter selection and support guide.
Take Your Customer Support to the Next Level
Ready to differentiate your distribution or agency business? Implement these maintenance best practices with your customers and position yourself as a trusted technical partner — not just a product supplier.
📋 Calibration Setup Guide 🔧 Installation Best Practices 📞 Contact Technical Support