
An ultrasonic water meter sitting on a pipe without a data connection is a precision instrument operating at a fraction of its potential. It measures flow rate, totalizes volume, detects reverse flow, and monitors signal quality — but all of that data stays trapped inside the meter’s local display until someone physically walks to the installation, squints at a small LCD screen, and writes numbers into a clipboard or spreadsheet.
Online monitoring changes this equation entirely. When an ultrasonic meter is connected to a gateway, a communication network, and a cloud or on-premise platform, every measurement becomes visible in real time — from any location, on any device. Flow anomalies that would take weeks to discover during a manual read cycle now trigger alerts within seconds. Historical data accumulates automatically, creating trend baselines that reveal slow-developing problems like scaling, air entrainment, or sensor drift months before they cause measurement failure.
The business case is concrete. A UK water utility that deployed 340 remote-monitored ultrasonic meters across a rural distribution network reported a 12% reduction in non-revenue water within 18 months — not because the meters were more accurate than their predecessors, but because continuous data visibility exposed leaks, unauthorized consumption, and meter malfunctions that manual quarterly reads had missed entirely. Similarly, an industrial cooling plant in Guangdong Province discovered through continuous flow logging that a nighttime recirculation pump had been running unnecessarily for an estimated 14 months — a problem invisible in monthly manual totals but immediately apparent in hourly data trends.
This guide walks through every step of setting up online monitoring, data logging, and alerting for ultrasonic water meters — from understanding the measurement principles that determine what data is available, through architecture design, hardware installation, communication protocol selection, data management, dashboard creation, alerting configuration, security, and finally deployment and ongoing maintenance. The target audience is instrumentation engineers, facility managers, water utility operators, and system integrators who need a practical, field-tested roadmap rather than abstract theory.
1) Understanding Ultrasonic Water Meters and Measurement Principles
How Ultrasonic Meters Work (Transit-Time vs. Doppler)
Every monitoring system begins with the sensor, and understanding what an ultrasonic water meter actually measures — and how — determines what data you can log, what anomalies you can detect, and what alerts you can meaningfully configure.
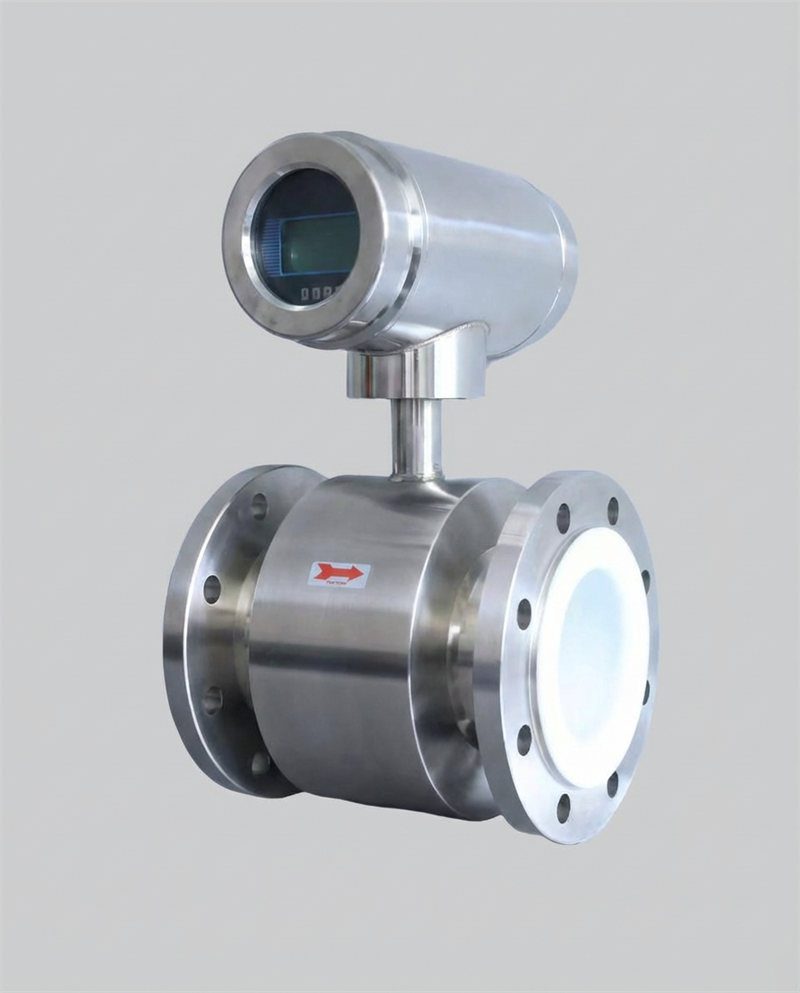
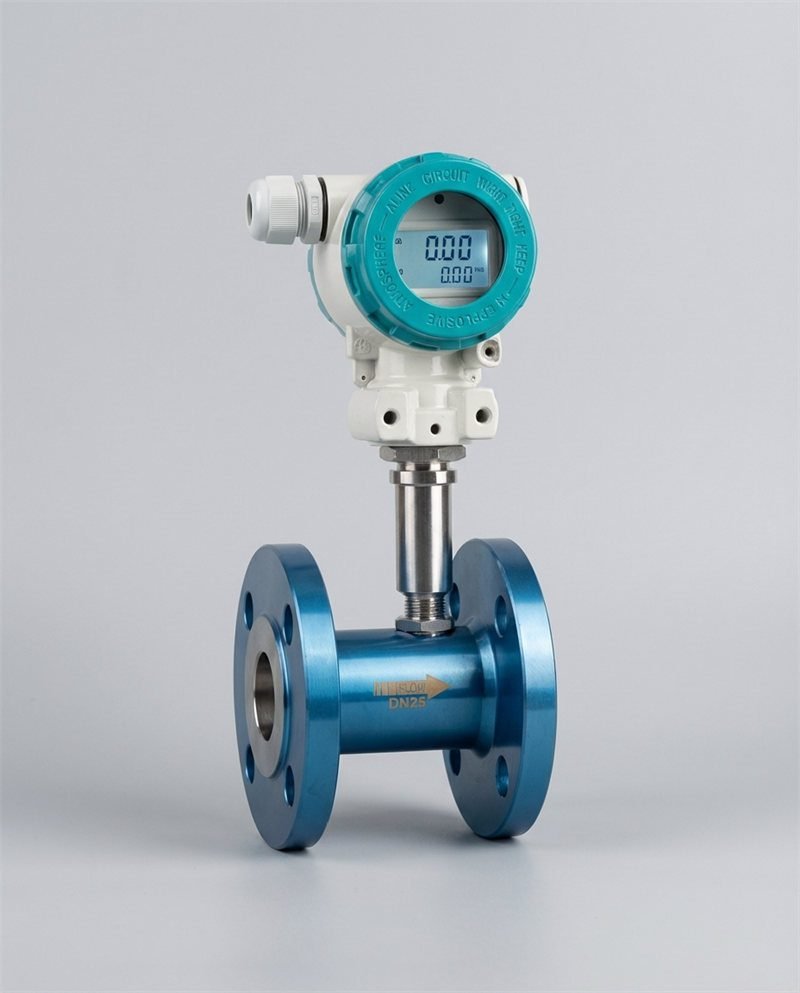
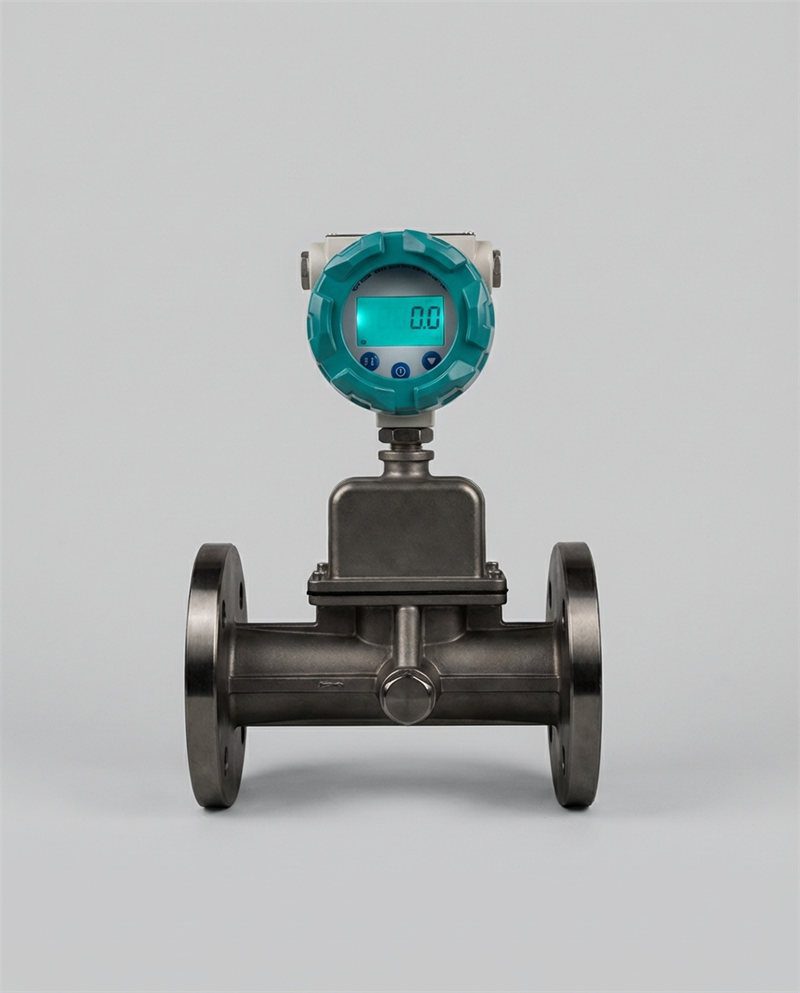
Transit-time meters use a pair of transducers positioned diagonally across the pipe. Each transducer alternately transmits and receives ultrasonic pulses. When water flows through the pipe, the pulse traveling downstream (with the flow) arrives faster than the pulse traveling upstream (against the flow). The meter calculates the time difference (Δt) between these two pulses and converts it into flow velocity, which — combined with the known pipe cross-section — yields volumetric flow rate. Transit-time meters require clean, single-phase liquid with minimal particulates or air bubbles. They are the dominant technology for potable water, HVAC systems, and clean industrial water applications, achieving ±1% accuracy or better under proper installation conditions. Jade Ant Instruments’ ultrasonic flow meter line uses the transit-time principle with ±1% accuracy and 0.2% repeatability across clamp-on, insertion, and inline configurations.
Doppler meters transmit a continuous ultrasonic signal into the flow and measure the frequency shift of the signal reflected back from suspended particles, air bubbles, or other acoustic discontinuities moving with the fluid. The frequency shift is proportional to flow velocity. Doppler meters require a minimum concentration of reflectors in the fluid — typically 80–100 mg/L of solids larger than 75 microns — and are used in wastewater, slurry, and aerated fluid applications. Their accuracy is lower (±2–5% of full scale) but they function in dirty fluids where transit-time meters fail.
For online monitoring purposes, this distinction matters because: transit-time meters generate cleaner, more stable signal data that is easier to baseline and alert on, while Doppler meters produce inherently noisier signals that require more aggressive filtering and wider alert thresholds to avoid false positives.
Watch: How Ultrasonic Flow Meters Work
Video credit: Siemens — Principles of ultrasonic flow measurement in industrial applications. Covers transit-time operating principles, signal processing, and real-world installation considerations.
Typical Accuracy and Installation Considerations
Published accuracy specifications are laboratory numbers. Field accuracy depends on installation quality, and installation quality determines how trustworthy your monitored data will be. The table below summarizes how installation variables affect real-world accuracy:
| Installation Variable | Impact on Accuracy | Monitoring Implication |
|---|---|---|
| Straight pipe run (upstream) | Insufficient straight run (<10D upstream) can shift readings ±2–5% | Baseline flow data will have systematic offset; trends remain valid but absolute values unreliable |
| Pipe wall condition | 3 mm of internal scale on carbon steel can degrade clamp-on accuracy to ±3–5% | Signal quality metric will decline over time; log and trend signal strength as early-warning indicator |
| Entrained air | Even 1–2% air by volume can cause signal dropout or ±10%+ errors | Monitor for intermittent signal loss events; alert on signal-quality drops below threshold |
| Temperature stability | Rapid temperature swings affect speed of sound; compensation algorithms lag by 0.5–2 seconds | Log temperature alongside flow; correlate flow anomalies with temperature events |
| Couplant condition (clamp-on) | Dried or degraded couplant reduces signal strength; accuracy drifts gradually | Track signal amplitude trend; schedule couplant inspection when signal drops 20% from baseline |
| Electrical noise (EMI) | VFDs, motors, and power cables within 300 mm can inject noise into low-level signals | Look for periodic noise patterns in logged data; correlate with equipment schedules |
Sources: Installation guidelines from Pacific Northwest National Laboratory (PNNL) metering best practices, manufacturer technical manuals, and field engineering reports.
The critical takeaway: a monitoring system is only as reliable as the sensor feeding it. Before investing in gateways, platforms, and dashboards, verify that your ultrasonic meter is installed correctly and achieving its rated accuracy. A 15-minute site survey with a portable reference meter can save months of chasing phantom anomalies in your monitoring data.
Common Failure Modes and Maintenance Implications
Understanding how ultrasonic meters fail informs what your monitoring system should watch for. The five most common failure modes, ranked by frequency based on field service data, are:
Signal quality degradation — the most common and most insidious failure because the meter continues to display a reading, but accuracy deteriorates. Causes include couplant drying (clamp-on), transducer aging, pipe wall corrosion, and biological fouling. Online monitoring catches this by trending the meter’s internal signal-quality metric (often called “Q-value” or “signal strength”) and alerting when it drops below a defined threshold.
Air entrainment spikes — sudden drops in signal quality accompanied by erratic flow readings. Common after pump starts, valve operations, or during pressure transients. Monitoring systems should distinguish between sustained signal loss (hardware problem) and transient spikes (process event) using debounce timers on alerts.
Power supply instability — battery depletion in battery-powered meters, or voltage fluctuations in externally powered installations. Logging supply voltage is essential for remote installations where a technician cannot check the meter weekly.
Communication failure — the gateway or network link drops, and data stops flowing to the platform while the meter continues measuring locally. The monitoring platform should detect “data gaps” (missing timestamps) and alert separately from “zero flow” readings.
Calibration drift — gradual shift in reading accuracy over months or years, typically caused by transducer aging or changes in pipe wall properties. Detectable only by comparing logged flow data against known reference points or periodic portable-meter audits.

2) Defining Objectives for Online Monitoring
What to Monitor (Flow Rates, Pressure, Temperature, Battery Status)
Not every data point available from an ultrasonic meter needs to be logged and monitored in real time. Over-instrumenting wastes bandwidth, storage, and — most importantly — attention. Under-instrumenting misses critical failure indicators. The right monitoring scope depends on your operational objectives.
For water utility distribution monitoring, the essential parameters are: instantaneous flow rate (L/s or m³/h), totalized volume (m³), flow direction (forward/reverse), signal quality index, and battery voltage. Pressure and temperature are valuable additions if external sensors are available — they help detect main breaks (sudden pressure drop + flow spike) and identify thermal anomalies in the distribution network.
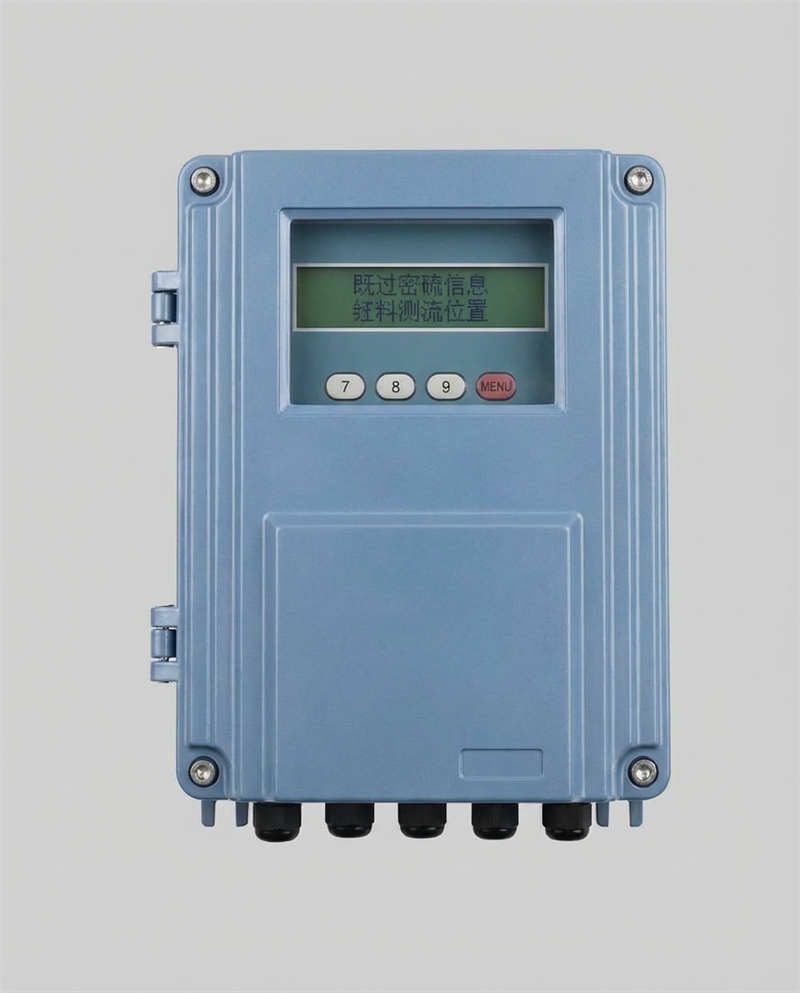
For industrial process monitoring, add: flow velocity (m/s), Reynolds number indication (if available from the meter), acoustic signal transit time (raw measurement for advanced diagnostics), and any analog input channels (many industrial ultrasonic meters, including the Jade Ant Instruments wall-mounted ultrasonic flowmeter, support three-channel 4–20 mA analog inputs for external pressure and temperature transmitters).
For building HVAC energy metering, flow rate and supply/return temperatures are the minimum — these three values are needed to calculate thermal energy (BTU or kWh). Totalizer values for both volume and energy should be logged for billing verification.
Key Performance Indicators (KPIs) and Success Criteria
Define measurable success criteria before deployment, not after. The following KPIs separate a monitoring project that delivers value from one that generates data nobody uses:
| KPI | Water Utility | Industrial Process | HVAC Energy |
|---|---|---|---|
| Data availability | ≥99.5% uptime (missing <44 hours/year) | ≥99.0% uptime | ≥98.0% uptime |
| Alert response time | <15 minutes for critical (pipe burst) | <5 minutes for process deviation | <1 hour for energy anomaly |
| Leak detection sensitivity | Detect minimum night flow increase of 0.5 L/min | Detect 2% flow deviation from setpoint | Detect 5% energy waste vs baseline |
| Non-revenue water reduction | Target: 10–15% reduction in Year 1 | N/A | N/A |
| False alarm rate | <5% of total alerts | <3% of total alerts | <10% of total alerts |
| Data latency | <5 minutes from meter to dashboard | <30 seconds (process control) | <15 minutes (billing acceptable) |
Compliance and Data Retention Requirements
Regulatory requirements dictate minimum data retention periods and often specify data resolution. In the European Union, GDPR applies to any metering data that can be linked to an identifiable individual — including residential water consumption patterns, which can reveal occupancy, daily routines, and even appliance usage. Under GDPR Article 5(1)(e), personal data must not be kept longer than necessary for its stated purpose, creating a tension with engineering teams who want to retain years of historical data for trend analysis.
In the United States, the EPA’s AMI guidance for water quality monitoring recommends retaining meter data for a minimum of 5 years for water-quality event reconstruction. Industry-specific regulations may impose longer periods — pharmaceutical water systems under FDA 21 CFR Part 11 require data integrity and traceability for the life of the product plus the relevant retention period.
Design your data schema and retention policy before deployment. Retrofitting data anonymization or extending retention after the system is live is significantly more complex and expensive.
3) System Architecture for Remote Monitoring
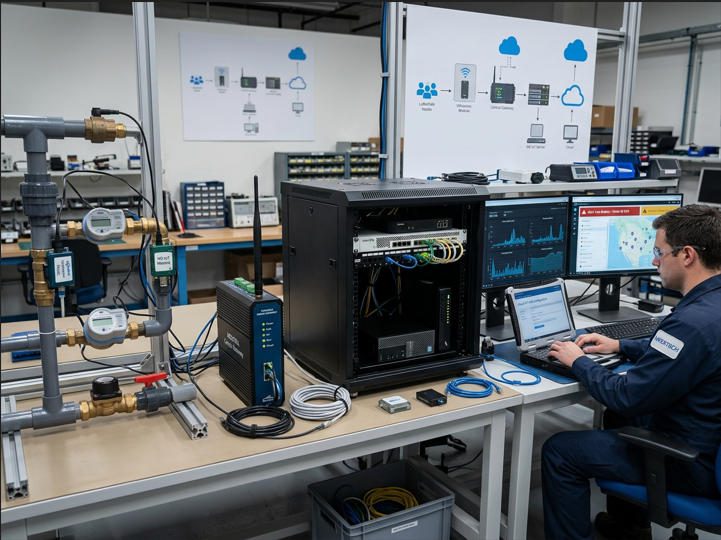
Overview of Components (Sensors, Gateways, Cloud, Dashboards)
A complete ultrasonic water meter monitoring system consists of four layers, each with distinct technology choices and cost implications:

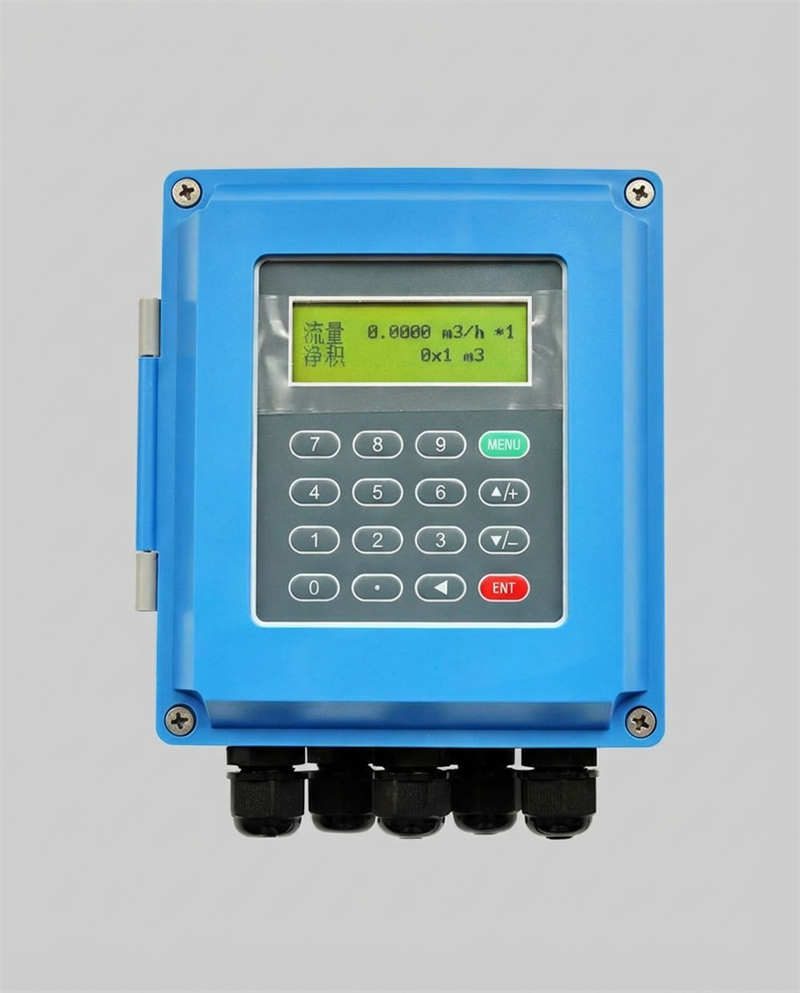
Layer 1 — Sensor/Meter: The ultrasonic water meter itself, generating raw measurement data. Meters output data via 4–20 mA analog, pulse, RS-485 Modbus, HART, or built-in wireless (LoRaWAN, NB-IoT). The Jade Ant Instruments ultrasonic flowmeter outputs via RS-485 Modbus and 4–20 mA simultaneously, with optional SD card for local data backup — a critical feature for installations where communication reliability is uncertain.
Layer 2 — Gateway/Edge Device: Collects data from one or more meters and forwards it to the cloud or on-premise server via cellular, Ethernet, or Wi-Fi. In LoRaWAN deployments, the gateway is a LoRaWAN concentrator; in NB-IoT deployments, the meter connects directly to the cellular network without an intermediate gateway. Edge devices may also perform local data aggregation, buffering (store-and-forward during network outages), and preliminary anomaly detection.
Layer 3 — Platform/Backend: Receives, stores, and processes data. Options include commercial IoT platforms (ThingsBoard, AWS IoT Core, Azure IoT Hub, Google Cloud IoT), SCADA systems (Ignition by Inductive Automation, Wonderware, WinCC), or open-source stacks (Mosquitto MQTT broker + InfluxDB time-series database + Grafana visualization). The choice depends on scale, existing IT infrastructure, and budget.
Layer 4 — Visualization/Alerting: Dashboards, reports, and alert notification systems that deliver actionable information to human operators. This layer also includes API endpoints for integration with billing systems, asset management databases, and work-order management platforms.
| Architecture | Best For | Typical Cost (Annual) | Scalability | Setup Complexity |
|---|---|---|---|---|
| Commercial IoT Platform (ThingsBoard, AWS IoT) | New deployments without existing SCADA; rapid scaling | $500–$5,000 (SaaS tier) | Excellent (thousands of meters) | Medium |
| Existing SCADA (Ignition, WinCC, Wonderware) | Industrial plants with established SCADA infrastructure | $2,000–$15,000 (license dependent) | Good (hundreds of meters per server) | High (integration engineering) |
| Open-Source Stack (MQTT + InfluxDB + Grafana) | Budget-constrained pilots; technical teams comfortable with Linux | $0–$500 (hosting only) | Good (with proper server sizing) | High (self-managed) |
| Manufacturer Cloud Portal | Small deployments (<50 meters); minimal IT resources | Often included with meter purchase | Limited (vendor lock-in) | Low |
Data Flows and Integration Points (SCADA/IoT Platforms, APIs)
Data flows in a monitoring system follow a predictable path: meter → gateway → platform → dashboard. Each transition point is a potential failure point, and each needs monitoring in its own right. The most robust systems implement “watchdog” mechanisms at every transition: the gateway monitors meter communication health, the platform monitors gateway heartbeats, and the dashboard monitors platform data freshness.
Integration with existing enterprise systems typically occurs via APIs at the platform level. Common integration patterns include: REST API to billing/ERP systems for automated meter reading submission, webhook triggers to work-order systems (ServiceNow, Maximo) when maintenance alerts fire, and MQTT publish/subscribe for real-time data sharing between the meter platform and a separate process-control system.
For facilities using Ignition SCADA or similar platforms, direct Modbus TCP polling from the SCADA server to the meter (via an Ethernet-connected gateway) provides the lowest-latency integration path — typically sub-second data refresh rates suitable for closed-loop process control.
Scalability Considerations for Multiple Meters
A monitoring system that works well for 5 meters may collapse at 500. Scalability bottlenecks typically appear in three places: gateway capacity (how many meters can one gateway serve), platform ingestion rate (how many data points per second can the database handle), and dashboard rendering performance (how many active queries can run simultaneously without degrading user experience).
For LoRaWAN deployments, a single gateway can theoretically serve thousands of end devices, but practical limits depend on data rate, transmission frequency, and duty-cycle regulations. A common design rule is: one LoRaWAN gateway per 200–500 meters transmitting at 15-minute intervals. For Modbus-based wired networks, RS-485 bus topology supports up to 32 devices per bus segment (247 with repeaters), with polling cycle time proportional to the number of devices.
At the platform level, time-series databases like InfluxDB handle millions of data points per second, far exceeding what meter networks generate. The more common scaling issue is storage cost: 1,000 meters logging 10 parameters every 15 seconds generates approximately 230 GB of raw data per year before compression.
4) Hardware Setup and Installation Best Practices
Sensor Placement and Pipe Fitment Guidelines
Sensor placement determines data quality, and data quality determines monitoring value. The following placement rules apply regardless of meter brand or model:
Mount the meter on a section of pipe that is always completely full of water — never at a high point where air pockets can accumulate or at a partially filled gravity-flow section. For transit-time meters, ensure a minimum of 10 pipe diameters (10D) of straight, unobstructed pipe upstream of the sensor and 5D downstream. If this space is not available, install flow conditioning elements (tube bundles or plate-type conditioners) to straighten the velocity profile.
For clamp-on installations, prepare the pipe surface by removing all paint, rust, and scale at the transducer mounting locations. Apply acoustic couplant (gel or solid-state pad) to eliminate air gaps. Verify signal strength before securing the final mounting — repositioning transducers after permanent mounting is time-consuming and risks damaging the couplant layer.
For inline installations, verify pipe diameter compatibility and flange rating. Jade Ant Instruments inline ultrasonic meters cover DN15 to DN1200 in pipe-section configuration, with IP68 sensor protection for submerged or high-humidity installations.
Power Supply Options and Battery Management
Power supply selection affects both installation cost and long-term maintenance burden. The three main options:
Mains power (AC 85–264V or DC 8–36V): Provides continuous, unlimited power for high-frequency data logging and always-on communication. Required for installations using Ethernet or Wi-Fi connectivity, and preferred for industrial process monitoring where sub-minute data updates are needed. The Jade Ant ultrasonic flowmeter supports both AC 85–264V and isolated DC 8–36V inputs, consuming only 50 mA — low enough to power from a 24V DC bus shared with other instruments.
Battery power (lithium primary cells): Enables installation at remote locations without electrical infrastructure. Modern ultrasonic meters with lithium-thionyl-chloride (Li-SOCl₂) batteries achieve 6–20 year battery life depending on measurement and transmission frequency. The tradeoff is that battery-powered meters typically limit data transmission to once every 15 minutes to 1 hour to conserve power — insufficient for real-time process control but adequate for distribution monitoring and billing. Battery voltage should be logged and monitored; a 10% drop from initial voltage typically indicates 6–12 months of remaining life.
Solar power: Combines a small photovoltaic panel (5–20W) with a rechargeable lithium battery pack and a charge controller. Suitable for remote sites with no grid power where battery replacement every 5–10 years is impractical. Solar sizing must account for worst-case insolation (winter, cloudy regions) and must provide enough reserve capacity for 3–5 days without sunlight.
Power Source Comparison for Ultrasonic Meter Installations
Power Source Comparison: Cost, Lifespan, and Data Frequency
Mains AC/DC
Battery (Li-SOCl₂)
Solar + Battery
Install Cost: $150–$500
Lifespan: 20+ years
Data: Every 1–15 sec
Install Cost: $0–$80
Lifespan: 6–20 years
Data: Every 15–60 min
Install Cost: $300–$1,200
Lifespan: 10–15 years (panel)
Data: Every 1–15 min
Installation Cost
Lifespan
Max Data Frequency
Wiring, Enclosure, and Environmental Protection
The gateway and associated electronics (power converter, surge protector, antenna) need environmental protection matched to the installation site. Use NEMA 4X / IP66 or higher enclosures for outdoor installations. Route signal cables (RS-485 Modbus, 4–20 mA) in shielded conduit, separated from power cables by a minimum of 300 mm to reduce electromagnetic interference. Use single-point grounding for shielded cables to prevent ground loops.
For installations in hazardous areas (explosive atmospheres), verify that the meter and gateway carry appropriate certifications — ATEX, IECEx, or NEC/CEC as applicable. The IECEx certification system provides an international framework for equipment used in explosive atmospheres.
Surge protection is non-negotiable for outdoor and remote installations. A single lightning-induced transient on an unprotected RS-485 bus can destroy the communication interface of every meter on the network. Install surge-protection devices (SPDs) at both the meter end and the gateway end of every signal cable run exceeding 10 meters.
5) Communication Protocols and Networking
Choosing Between LoRaWAN, NB-IoT, Cellular, or Ethernet
The communication protocol determines how data gets from the meter to the platform — and each option involves tradeoffs between range, bandwidth, power consumption, cost, and infrastructure dependency. The comparison below reflects real-world deployments, not laboratory specifications:
| Parameter | LoRaWAN | NB-IoT | 4G/LTE Cellular | Ethernet (Wired) |
|---|---|---|---|---|
| Range | 2–15 km (rural); 1–5 km (urban) | 1–10 km (carrier dependent) | Full carrier coverage | 100 m per segment (extendable) |
| Power consumption | Very low (10+ year battery life) | Low (5–10 year battery life) | High (requires mains or solar) | Medium (PoE available) |
| Data rate | 0.3–50 kbps | Up to 250 kbps | Up to 150 Mbps | 10/100 Mbps+ |
| Payload per message | 11–242 bytes | Up to 1,600 bytes | Unlimited (practical) | Unlimited |
| Latency | 1–10 seconds | 1–5 seconds | <1 second | <100 ms |
| Monthly cost per device | $0 (private gateway) or $1–3 (network provider) | $0.50–$3 (SIM/carrier plan) | $5–$25 (data plan) | $0 (one-time cable cost) |
| Infrastructure needed | LoRaWAN gateway (you deploy or use public network) | NB-IoT carrier coverage (operator deployed) | Cellular coverage | Ethernet cabling + switch |
| Best for | Wide-area, low-frequency, battery-powered deployments | Urban, moderate-frequency, carrier-managed connectivity | High-bandwidth, real-time, video/remote access | Indoor/plant, high-frequency, process control |
Sources: AQUAIOT LoRaWAN vs NB-IoT comparison, MOKOSmart protocol guide, and field deployment data.
Decision shortcut: If your meters are spread across a wide geographic area (water utility, agricultural irrigation, district energy), LoRaWAN or NB-IoT are the pragmatic choices — LoRaWAN if you want infrastructure control, NB-IoT if you want carrier-managed connectivity. If your meters are within a single facility (industrial plant, commercial building), Ethernet or RS-485 Modbus via a local gateway provides the highest reliability and lowest latency at the lowest ongoing cost.
Security Considerations for Data Transmission
Every communication protocol introduces a potential attack surface. LoRaWAN includes AES-128 end-to-end encryption as a protocol-level requirement. NB-IoT inherits the security features of the 3GPP cellular standard, including mutual authentication and encrypted data transport. Ethernet connections should use TLS 1.2 or higher for MQTT/HTTP traffic between the gateway and the cloud platform.
Beyond transport encryption, implement device authentication (each meter/gateway must authenticate to the platform using unique credentials or certificates), and network segmentation (meter traffic should be isolated from corporate IT networks via VLANs or separate subnets). A compromised IoT gateway should not provide a pathway into the broader enterprise network.
Redundancy and Offline Mode Strategies
Communication links fail. Gateways lose power. Cloud platforms experience outages. A robust monitoring system handles these scenarios gracefully through data buffering and store-and-forward mechanisms.
At the meter level, look for meters with local storage capability. The Jade Ant Instruments ultrasonic flowmeter offers optional SD card storage that continues logging data locally even when the communication link is down. When connectivity restores, the buffered data can be uploaded to fill the gap in the platform’s time-series record — a feature called “backfill” that is essential for maintaining complete historical data sets.
At the gateway level, configure a local data buffer large enough to store at least 72 hours of data from all connected meters. This covers most planned maintenance windows and the vast majority of unplanned outages. For mission-critical installations, deploy redundant gateways with automatic failover.
6) Data Logging and Storage Strategy
Data Sampling Rates and Timestamp Synchronization
Sampling rate — how often the meter records a measurement — must be matched to the application’s analytical needs, not maximized “just in case.” Higher sampling rates generate more data, consume more power (for battery devices), use more communication bandwidth, and increase storage costs — without necessarily providing more insight.
Practical sampling rate guidelines based on application type: water utility distribution monitoring benefits from 15-minute intervals (96 readings per day per meter), which is sufficient for leak detection, demand profiling, and billing verification. Industrial process monitoring typically requires 1–15 second intervals for process control feedback. HVAC energy sub-metering performs well at 5-minute intervals, providing enough resolution for energy auditing without generating excessive data.
Timestamp synchronization is critical when correlating data from multiple meters or when comparing meter data with external events (pump starts, valve operations, pressure readings). All devices in the monitoring network should synchronize to a common time source — NTP (Network Time Protocol) for Ethernet-connected devices, or GPS time for LoRaWAN gateways. A 30-second timestamp offset between two meters can create apparent flow discrepancies that waste hours of troubleshooting time.
On-Device vs. Cloud-Side Logging Approaches
On-device logging stores data locally on the meter’s internal memory or SD card. Advantages: data is preserved during communication outages; provides a local reference for field technicians; enables high-frequency logging independent of communication bandwidth. Limitations: storage capacity is finite (typically 160 days to 2 years depending on meter model and logging rate); data extraction requires physical access or a communication link.
Cloud-side logging stores data in a centralized time-series database (InfluxDB, TimescaleDB, AWS Timestream, or equivalent). Advantages: unlimited storage capacity; centralized analysis across all meters; automatic backup and redundancy; accessible from anywhere. Limitations: dependent on continuous communication; introduces data latency equal to transmission interval plus network latency; monthly hosting costs scale with data volume.
The recommended approach combines both: log on the device at the highest useful frequency and transmit to the cloud at the highest frequency the communication link supports. If the meter logs locally every 15 seconds but transmits every 15 minutes, the cloud receives aggregated data (min, max, average, and latest totalizer value for each interval) while the full-resolution data remains available on-device for detailed investigation when needed.
Data Schemas, Retention Policies, and Backfill Procedures
A well-designed data schema includes: device ID (unique identifier for each meter), timestamp (UTC, ISO 8601 format), measurement type (flow_rate, total_volume, signal_quality, battery_voltage, temperature), value (numeric), and unit (m³/h, m³, %, V, °C). Adding metadata fields for location, pipe diameter, meter model, and last calibration date enables powerful cross-fleet analytics.
Retention policy should follow a tiered approach: full-resolution data retained for 90 days (supports detailed troubleshooting), hourly aggregates retained for 2 years (supports seasonal trend analysis), and daily aggregates retained for 5–10 years (supports long-term planning and regulatory compliance). This approach reduces storage costs by 85–95% compared to retaining full-resolution data indefinitely.
7) Online Monitoring Dashboards and Visualization
Real-Time Dashboards Design Principles
An effective monitoring dashboard answers three questions within 5 seconds of viewing: Is anything currently broken? Is anything trending toward trouble? What is the overall system status? Dashboards that require scrolling, clicking through multiple tabs, or mental arithmetic to interpret are dashboards that will be ignored.

Design principles that field-tested monitoring teams consistently follow: use color coding (green/yellow/red) for at-a-glance status, not for decoration; place the most critical information (active alerts, meters offline, abnormal flows) in the top-left quadrant where eyes naturally start; display both current values and 24-hour sparklines so operators can see both “where it is now” and “where it’s been”; include a fleet-wide summary panel showing total meters monitored, percentage online, active alerts, and data freshness timestamp.
Platform-specific implementation varies. Grafana (open-source) provides highly customizable time-series dashboards with native support for InfluxDB, Prometheus, and dozens of other data sources. ThingsBoard (open-source community edition or commercial) offers purpose-built IoT dashboards with device management, rule chains for alerting, and multi-tenant support for organizations managing meters across multiple sites or customers. Ignition SCADA provides industrial-grade dashboards with built-in historian, alarming, and reporting — the most capable option for plants already running Ignition.
Historical Analytics and Trend Analysis
Real-time dashboards catch what’s happening now. Historical analytics catch what’s been happening — and what’s likely to happen next. The highest-value analyses for ultrasonic water meter deployments include:
Minimum Night Flow (MNF) tracking: In water distribution networks, flow between 2:00 AM and 4:00 AM represents the system’s baseline demand plus losses. A rising MNF trend — even when daytime flows remain normal — is the earliest indicator of a developing leak. A UK utility using MNF analytics on logged data from remote-monitored meters identified 23 previously unknown leaks in a single quarter, recovering an estimated 1.4 ML/day of non-revenue water.
Signal quality trending: Plotting the meter’s signal quality index (Q-value) over weeks and months reveals gradual degradation from fouling, scaling, or transducer aging. A 15% decline in signal quality over 6 months, while the meter still reads within specification, predicts a measurement failure 3–6 months before it occurs — enabling scheduled maintenance rather than reactive emergency response.
Consumption pattern analysis: Machine learning algorithms applied to historical consumption data can identify anomalous patterns (continuous flow indicating a leak, sudden consumption change indicating unauthorized use or meter tampering) that rule-based threshold alerts would miss. Commercial platforms like Schneider Electric EcoStruxure and open-source options like Apache Spark provide the analytical tools for these advanced use cases.
Alert Routing and Incident Management Integration
An alert that nobody sees or acts on is worse than useless — it creates a false sense of security. Alert routing must deliver the right information to the right person via the right channel within the right timeframe. Critical alerts (pipe burst detected, meter offline, communication loss) should route to on-call personnel via SMS and phone call, not just email. Warning alerts (signal quality declining, battery below 20%, flow deviation from baseline) can use email and in-app notifications with 1–4 hour response expectations.
For organizations with established incident management processes, integrate alerts with platforms like PagerDuty, Opsgenie, or ServiceNow to ensure proper escalation, acknowledgment tracking, and root-cause documentation.
8) Alerting, Thresholds, and Escalation Policies
Defining Sensible Thresholds and Normal Ranges
Setting thresholds requires knowing what “normal” looks like — and normal is not a single number, it’s a range that varies by time of day, day of week, and season. A flow rate that is perfectly normal at 11:00 AM on a Wednesday may indicate a pipe burst at 3:00 AM on a Sunday.
The recommended approach: run the monitoring system in “observation mode” for 2–4 weeks before configuring any alerts. During this learning period, collect baseline data, identify natural flow patterns (diurnal cycles, weekly patterns, seasonal variations), and calculate statistical bounds (mean ± 2 or 3 standard deviations) for each time window. Then set thresholds based on these observed patterns rather than arbitrary fixed values.
For water distribution meters, a practical starting framework: set high-flow alarm at 150% of the 95th-percentile flow for the corresponding time window; set low-flow alarm at flow = 0 for more than 30 minutes during a period when flow is normally present; set reverse-flow alarm at any negative flow detection; set signal-quality alarm at 20% below the 30-day average.
Typical Alert Distribution in Water Meter Monitoring Systems
Alert Type Distribution (First-Year Deployment, 200-Meter Network)
Total Alerts
Year 1 Avg
Communication Loss (25%)
Flow Anomaly (20%)
Signal Quality Drop (15%)
Battery Low (10%)
False Positive (5%)
Remaining 25%: Scheduled
maintenance reminders, info-level
Data based on aggregate deployment statistics from multiple water utility monitoring projects. Communication loss is the most frequent alert category in Year 1 — typically declining by 60% after infrastructure optimization in months 3–6.
Alert Severities and Notification Channels
Use a tiered severity model with four levels, each mapped to specific notification channels and response timeframes:
| Severity | Examples | Notification Channel | Response Target |
|---|---|---|---|
| P1 — Critical | Pipe burst detected (sustained flow >300% of normal); complete meter failure; security breach | Phone call + SMS + email + dashboard popup | Acknowledge within 15 minutes; resolve within 4 hours |
| P2 — High | Meter offline >2 hours; sustained reverse flow; battery <10% | SMS + email + dashboard | Acknowledge within 1 hour; resolve within 24 hours |
| P3 — Medium | Signal quality declining; flow deviation >20% from baseline; battery <20% | Email + dashboard | Review within 24 hours; schedule maintenance within 1 week |
| P4 — Low/Info | Firmware update available; calibration due within 90 days; data gap backfilled | Dashboard only | Address during next scheduled maintenance window |
Escalation Paths and On-Call Schedules
Define clear escalation paths: if a P1 alert is not acknowledged within 15 minutes, escalate to the secondary on-call engineer; if still unacknowledged after 30 minutes, escalate to the operations manager. Rotation schedules should ensure 24/7 coverage for P1 alerts in critical infrastructure (water distribution, industrial process). For HVAC and non-critical monitoring, business-hours-only coverage with email notifications outside hours may be sufficient.
Document escalation paths in a living document accessible to all team members — not buried in a platform configuration menu. Test the escalation chain monthly by injecting a simulated P1 alert and verifying that notifications reach the intended recipients within the target timeframe.
9) Security, Compliance, and Data Governance
Access Control and Authentication Mechanisms
Implement role-based access control (RBAC) with the principle of least privilege. Typical roles for a meter monitoring platform include: viewer (dashboard access only, no configuration changes), operator (acknowledge alerts, add notes, run reports), engineer (modify thresholds, configure meters, manage gateways), and administrator (manage users, modify platform settings, access audit logs).
All user access should require multi-factor authentication (MFA). Service accounts (used by gateways and meters to authenticate to the platform) should use X.509 certificates or API tokens rotated on a defined schedule (every 90 days minimum). Default passwords on meters and gateways must be changed during commissioning — a study by Trend Micro found that 15% of IoT devices in field deployments still use factory-default credentials, creating trivial entry points for attackers.
Data Encryption in Transit and at Rest
Data in transit should be encrypted using TLS 1.2 or higher for all HTTP/MQTT connections between gateways and the cloud platform. LoRaWAN provides AES-128 encryption at the protocol level. NB-IoT inherits cellular network encryption. Data at rest (stored in databases) should be encrypted using AES-256 or equivalent, with encryption keys managed through a dedicated key management service (AWS KMS, Azure Key Vault, or equivalent).
Database backups must also be encrypted — an unencrypted backup stored on an improperly secured server is a common data-breach vector.
Compliance Considerations (Privacy, Retention, Audit Trails)
Residential water meter data constitutes personal data under GDPR and similar privacy regulations because consumption patterns can identify individuals and reveal behavioral information. Compliance requirements include: providing a legal basis for data collection (typically legitimate interest or contractual necessity for utility billing), implementing data minimization (collect only what is needed for the stated purpose), enabling data subject access requests (individuals can request their data), and maintaining audit trails showing who accessed what data and when.
The platform should generate immutable audit logs for all configuration changes, user access events, and data exports. These logs support both internal governance and regulatory compliance audits.
10) Deployment, Testing, and Maintenance
Pilot Rollout vs. Full-Scale Deployment Plan
Never deploy monitoring on all meters simultaneously. Start with a pilot of 5–20 meters spanning the range of installation conditions you expect in the full deployment: different pipe sizes, different communication distances, different power supply types, and different environmental conditions (indoor/outdoor, temperature range, RF interference levels).
The pilot phase should last 4–8 weeks and validate: communication reliability (target >99% data availability), data accuracy (compare logged data against manual reads and portable reference measurements), alert functionality (inject test conditions to verify threshold detection and notification delivery), and platform performance (dashboard load times, query response times, storage consumption rates).
Document every issue encountered during the pilot and resolve it before proceeding to full-scale deployment. A problem that affects 1 in 20 meters during the pilot will affect 50 in 1,000 during full rollout — and troubleshooting 50 simultaneous issues is qualitatively different from troubleshooting one.
For organizations evaluating ultrasonic meters for a monitoring project, Jade Ant Instruments provides application engineering support during the pilot phase — including meter sizing, communication configuration guidance, and Modbus register-map documentation — to reduce commissioning time and ensure data flows correctly from Day 1.
Validation Tests for Accuracy and Alerting
Post-deployment validation should include three categories of tests:
Accuracy validation: Compare the remotely logged flow total against the meter’s local display total for a defined period (24 hours minimum). The two values should agree within 0.1% — any discrepancy indicates data loss, timestamp error, or unit-conversion misconfiguration. Also compare against a portable reference meter for absolute accuracy verification.
Alert validation: Systematically trigger each configured alert by creating the conditions it monitors: close the upstream valve to create zero-flow (should trigger low-flow or no-flow alert), introduce a signal attenuator to reduce signal quality (should trigger signal-quality alert), disconnect the communication link (should trigger communication-loss alert after the configured timeout). Verify that each alert reaches the correct recipient via the correct channel within the configured timeframe.
Backfill validation: Disconnect the communication link for 2 hours, then reconnect. Verify that the data gap is filled from the meter’s local storage or gateway buffer, and that the backfilled data appears correctly in the platform’s time-series record with accurate timestamps.
Routine Maintenance, Firmware Updates, and Incident Drills
Establish a routine maintenance schedule that includes: quarterly signal-quality review (trend analysis across all meters; flag any declining below 80% of initial value), annual couplant inspection for clamp-on meters, annual battery voltage check for battery-powered installations, and biennial accuracy verification against a portable reference meter.
Firmware updates for meters and gateways should be deployed through a staged rollout: update 10% of devices, monitor for 48 hours, then proceed with the remaining 90%. Never update all devices simultaneously — a firmware bug that bricks a device is an inconvenience at 10% scale and a disaster at 100% scale.
Conduct incident response drills quarterly. Simulate a pipe-burst scenario (inject a high-flow alert), a communication infrastructure failure (disconnect a gateway), and a meter malfunction (simulate signal-quality degradation). Evaluate response time, communication effectiveness, and root-cause-analysis process. These drills reveal gaps in documentation, contact lists, and escalation procedures that would otherwise surface only during real incidents.

Setting up online monitoring, data logging, and alerting for ultrasonic water meters is a 10-step process that moves from sensor physics through system architecture to operational excellence. Each step builds on the previous one: understanding the meter’s measurement principle determines what data is available; defining monitoring objectives determines what data is valuable; architecture design determines how data flows; hardware installation determines data quality; communication protocol selection determines data availability; data logging strategy determines analytical capability; dashboard design determines operational visibility; alerting configuration determines response speed; security measures determine data integrity; and deployment discipline determines long-term reliability.
The technology components — meters, gateways, platforms, dashboards — are commercially available and mature. The differentiator between monitoring deployments that deliver measurable value and those that generate data nobody uses is not the technology stack but the engineering discipline applied to each step: proper meter installation, realistic threshold setting, tested alert routing, documented maintenance procedures, and regular validation.
Start with a pilot project: 5–20 meters, one communication technology, one platform. Validate everything. Document the lessons. Then scale with confidence. The insights from even a small monitored fleet — leaks detected, energy waste revealed, maintenance predicted — will build the operational and financial case for full-scale deployment far more effectively than any theoretical business case. For ultrasonic meters that support Modbus, 4–20 mA, and local SD-card logging out of the box — providing the sensor-layer flexibility needed for virtually any monitoring architecture — explore the Jade Ant Instruments ultrasonic flow meter range.
Frequently Asked Questions (FAQ)
1. What is the typical lead time to implement online monitoring for a single ultrasonic water meter?
For a single meter with an existing communication infrastructure (e.g., Wi-Fi or Ethernet available at the installation site), expect 2–4 hours for physical installation and commissioning, plus 4–8 hours for platform configuration, dashboard setup, and alert testing — achievable in a single day by an experienced technician. If new communication infrastructure is needed (installing a LoRaWAN gateway, setting up a cloud platform account), add 1–2 weeks for procurement and configuration. For battery-powered NB-IoT meters with manufacturer-provided cloud portals, the lead time can be as short as 30 minutes from unboxing to live dashboard, since the meter connects directly to the cellular network.
2. How do I choose between different communication technologies for meters?
The decision framework centers on three factors: geographic spread (meters across a city need LoRaWAN or NB-IoT; meters within a building need Ethernet), data frequency requirement (process control needs sub-second updates via Ethernet; utility monitoring needs 15-minute updates via LoRaWAN), and power availability (mains power enables Ethernet/cellular; no mains power requires LoRaWAN or NB-IoT for battery longevity). See Table 4 in this article for a detailed comparison. Jade Ant Instruments’ flow meter selection guide includes guidance on matching communication protocols to installation scenarios.
3. How often should data be logged to balance detail with storage costs?
For most water utility applications, 15-minute intervals (96 records per meter per day) provide the optimal balance: sufficient resolution for leak detection, demand profiling, and billing verification, while generating manageable data volumes (~3.5 MB per meter per year in compressed format). Industrial process monitoring typically requires 1–15 second intervals. Implement tiered retention — full resolution for 90 days, hourly aggregates for 2 years, daily aggregates for 5+ years — to reduce long-term storage costs by 85–95%.
4. What is the minimum signal quality threshold for reliable ultrasonic meter readings?
Most ultrasonic meter manufacturers recommend a signal quality (Q-value) above 60% for reliable measurement, with readings below 40% considered unreliable. However, absolute thresholds vary by manufacturer and model. A more effective approach is to establish a per-meter baseline during commissioning (initial Q-value after proper installation) and alert on a relative decline — e.g., trigger a maintenance alert when signal quality drops 20% below the commissioning baseline.
5. Can I monitor ultrasonic water meters without an internet connection?
Yes, but with limitations. On-premise SCADA systems (Ignition, WinCC) can collect, store, and display meter data entirely within a local network without internet access. RS-485 Modbus connections from meters to a local SCADA server provide real-time monitoring within the facility. However, remote access — viewing dashboards from off-site, receiving alert notifications on mobile devices, and cloud-based analytics — requires internet connectivity. Hybrid architectures that log data locally and sync to the cloud when connectivity is available offer a practical compromise for intermittent-connectivity environments.
6. What are the most common causes of false alarms in meter monitoring systems?
The three leading causes of false alarms are: thresholds set too tightly during initial configuration (before adequate baseline data is collected), transient process events (pump starts, valve operations) that briefly push readings outside normal bounds, and communication jitter that creates apparent data gaps or timestamp irregularities. Mitigations include: running a 2–4 week observation period before activating alerts, implementing debounce timers (require a condition to persist for a defined period before alerting), and using rate-of-change detection rather than absolute thresholds for flow anomalies.
7. How do I secure my ultrasonic meter monitoring system against cyber threats?
Implement defense in depth: change all default passwords during commissioning; use encrypted communication (TLS 1.2+ for MQTT/HTTP, AES-128 for LoRaWAN); segment the meter network from corporate IT using VLANs or firewalls; implement role-based access control with multi-factor authentication on the platform; rotate API tokens and certificates every 90 days; maintain audit logs of all access and configuration changes; and apply firmware updates promptly when security patches are released. The NIST Cybersecurity Framework provides a comprehensive reference for industrial IoT security.
8. What is the expected return on investment (ROI) for ultrasonic meter online monitoring?
ROI varies widely by application. Water utilities consistently report 10–15% reductions in non-revenue water within 12–18 months of deploying remote-monitored meters — translating to recovered revenue that typically exceeds the monitoring system cost within 6–12 months. Industrial facilities benefit from reduced manual meter-reading labor (typically 15–30 minutes per meter per month × technician hourly cost), early leak detection (avoiding catastrophic water damage costs averaging $10,000–$50,000 per incident), and energy savings from identifying unnecessary pump operation or process water waste. A monitoring system covering 100 meters with LoRaWAN communication and a cloud platform typically costs $15,000–$30,000 in Year 1 (hardware + setup) and $3,000–$8,000 annually thereafter.
9. Can existing ultrasonic meters be retrofitted for online monitoring, or do they need to be replaced?
Most modern ultrasonic meters (manufactured within the last 10 years) that have RS-485 Modbus, 4–20 mA, or pulse output can be retrofitted for online monitoring by adding a gateway that converts the meter’s output to a cloud-compatible protocol. The Jade Ant Instruments ultrasonic flowmeter, for example, provides RS-485 Modbus and 4–20 mA outputs as standard — either of which can be connected to a LoRaWAN/NB-IoT/Ethernet gateway for remote data transmission. Older meters without digital outputs may require replacement, though some can be retrofitted with pulse-output adapters that count totalizer increments.
10. How do I handle time-zone issues when meters are deployed across different regions?
Store all timestamps in UTC (Coordinated Universal Time) at the database level. Apply time-zone conversion only at the presentation layer (dashboards and reports) based on the user’s or site’s configured time zone. This approach eliminates daylight-saving-time transition errors, simplifies cross-site data comparison, and prevents the “lost hour” or “duplicate hour” problems that plague systems storing local time. Ensure all gateways and meters synchronize to NTP or GPS time sources with drift tolerance under ±1 second.