
In a 2024 audit of 340 process plants across North America and Asia, approximately 38% of installed flowmeters were found to be operating outside their stated accuracy specification — not because of product defects, but because of selection mismatches, installation errors, or ignored fluid conditions. That single finding translated to an estimated $4.7 million in aggregate annual losses from overbatching, energy waste, and regulatory non-compliance across the surveyed facilities.
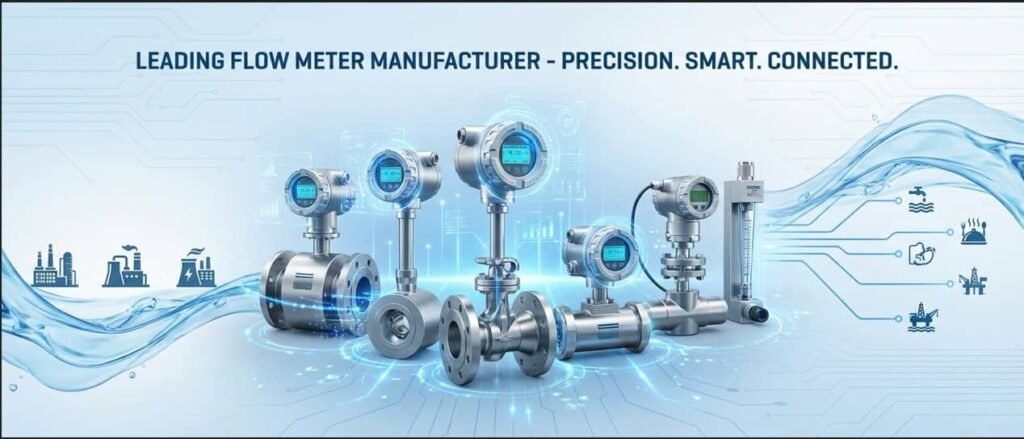
The right flowmeter sensor does more than count liters or cubic feet — it anchors every decision your control system makes about dosing, blending, custody transfer, and energy management. Get the selection wrong, and every downstream number inherits that error. Get it right, and the meter quietly pays for itself through reduced waste, tighter process control, and fewer unplanned shutdowns.
This guide walks through the critical factors that determine flowmeter success: fluid type and behavior, measurement range and accuracy targets, environmental and installation constraints, communication protocol compatibility, and total lifecycle economics. Whether you are specifying a meter for a new greenfield plant or replacing a chronically underperforming unit, the framework here will help you arrive at a shortlist grounded in engineering reality rather than catalog assumptions.
Understanding Flowmeter Basics
What a Flowmeter Does and Common Sensing Principles
A flowmeter measures the rate or total quantity of fluid — liquid, gas, or steam — moving through a pipe or open channel. The measurement may express volumetric flow (liters per minute, gallons per hour), mass flow (kilograms per second), or velocity (meters per second), depending on the sensing principle and the application’s engineering requirements.
At the core, every flowmeter exploits a physical relationship between fluid motion and a detectable signal. Differential pressure meters create a restriction (an orifice plate, Venturi tube, or flow nozzle) and measure the resulting pressure drop, which is proportional to the square of velocity per ISO 5167. Electromagnetic meters apply Faraday’s law of induction: a conductive liquid moving through a magnetic field generates a voltage proportional to velocity. Ultrasonic meters use transit-time differences or Doppler shifts in sound waves. Coriolis meters detect phase shifts in vibrating tubes caused by the Coriolis force, yielding direct mass flow and density readings. Vortex meters count pressure oscillations generated by a bluff body placed in the flow stream — the frequency of vortex shedding scales linearly with velocity.
Types of Flowmeters at a Glance: Inline, Insertion, and Common Technologies
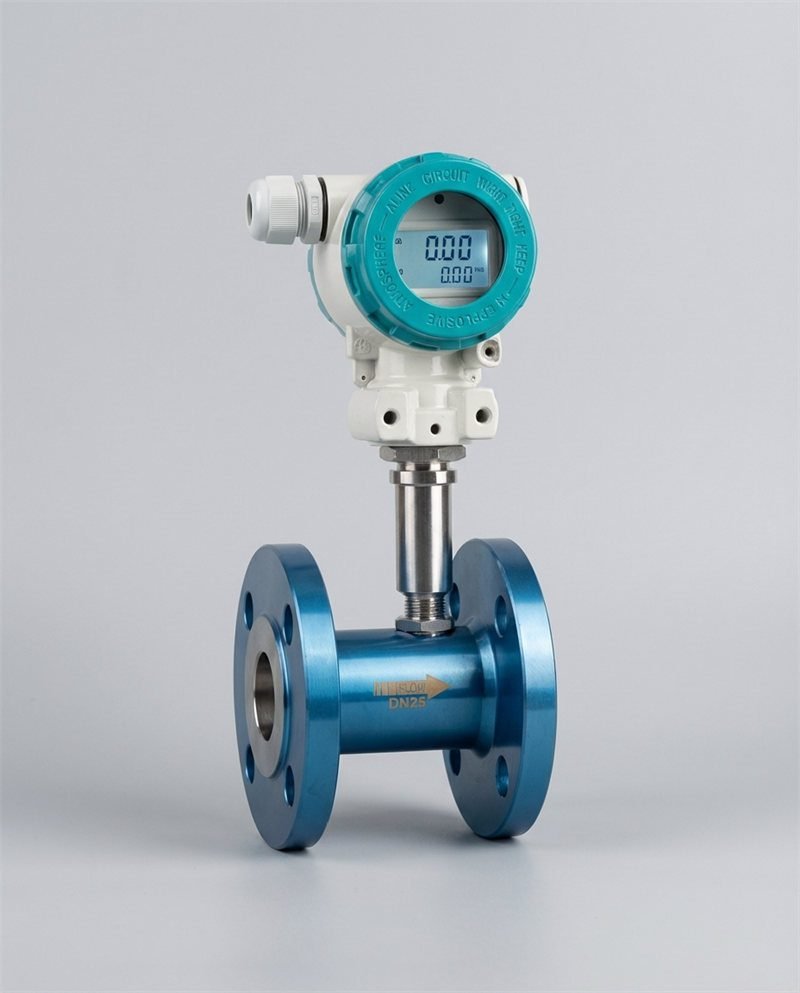
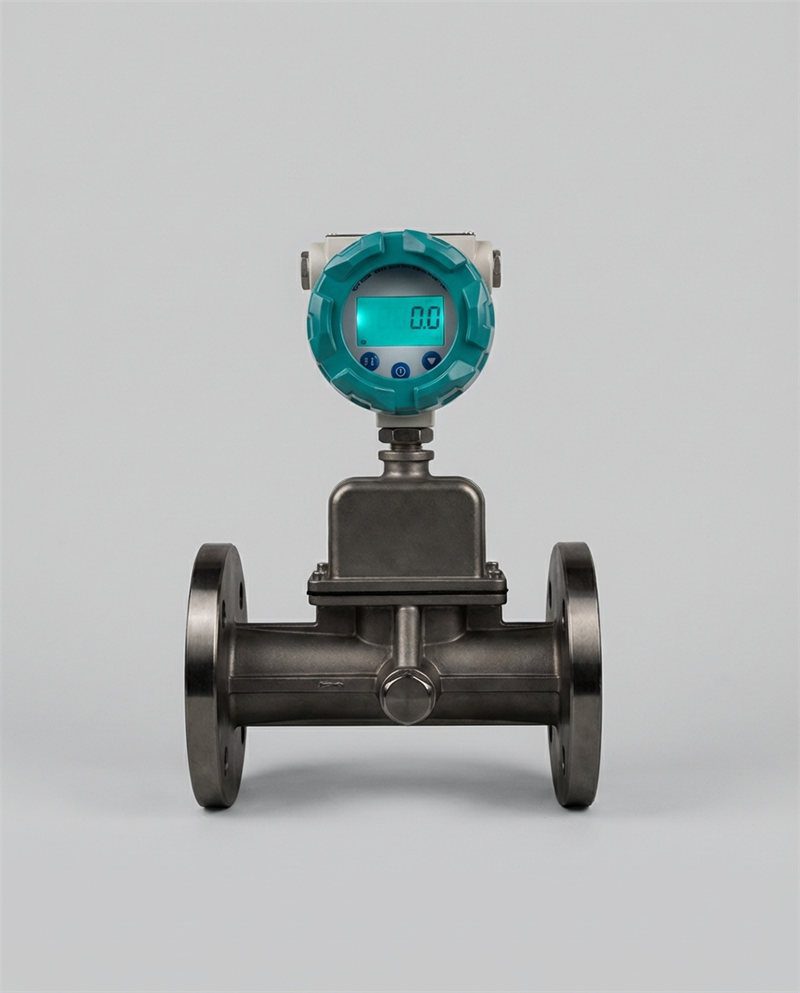
Flowmeters are broadly categorized by how they interface with the pipe. Inline (full-bore) meters are installed as part of the piping — the fluid passes entirely through the meter body. This category includes electromagnetic, Coriolis, turbine, positive displacement, and inline ultrasonic meters. Insertion meters place a probe or sensor into the flow stream through a tap, sampling velocity at one or more points and inferring total flow. Clamp-on ultrasonic meters mount externally on the pipe wall and require no pipe penetration at all, making them attractive for retrofits or corrosive services.
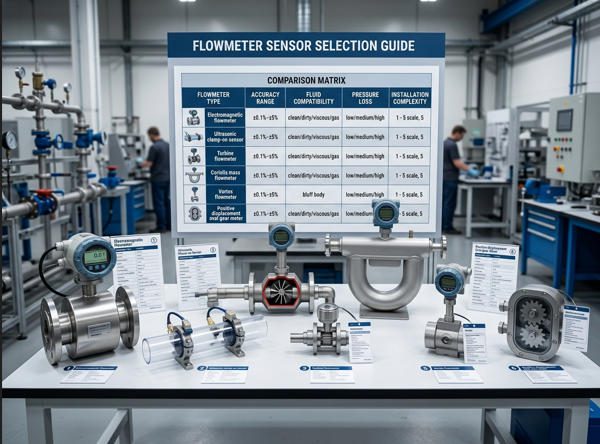
The table below provides a snapshot of the six most widely deployed industrial flowmeter technologies, their typical accuracy ranges, and primary application strengths.

| Technology | Typical Accuracy | Turndown Ratio | Moving Parts | Best For | Key Limitation |
|---|---|---|---|---|---|
| Electromagnetic | ±0.2–0.5% | Up to 1000:1 | No | Conductive liquids, slurries, wastewater | Requires fluid conductivity ≥5 µS/cm |
| Coriolis | ±0.1–0.2% | Up to 100:1 | No | Mass flow, custody transfer, batching | High cost for large sizes; pressure drop |
| Ultrasonic (Transit-Time) | ±0.5–1.0% | Up to 200:1 | No | Clean liquids & gases; large pipes; clamp-on retrofits | Sensitive to particles, pipe wall condition |
| Vortex | ±0.5–1.0% | Up to 30:1 | No | Steam, gas, clean liquids | Minimum velocity requirement; vibration sensitivity |
| Turbine | ±0.15–0.5% | Up to 35:1 | Yes | Clean, low-viscosity liquids; custody transfer | Wear from solids; viscosity dependent |
| Differential Pressure (Orifice) | ±0.5–2.0% | 3:1 to 5:1 | No | Steam, gas, general-purpose; wide industrial base | Narrow rangeability; permanent pressure loss |
Sources: Emerson Flow Measurement, Engineering Toolbox, manufacturer datasheets.
Key Performance Metrics to Track: Range, Accuracy, Turndown, Repeatability
Four metrics define whether a flowmeter will perform in your specific application — and they are not interchangeable. Range defines the upper and lower flow limits the meter can handle. Accuracy describes how close the reading is to the true value under stated conditions. Turndown ratio (rangeability) is the span from maximum to minimum measurable flow at acceptable accuracy — a turndown of 100:1 means the meter can read reliably at 1% of its full scale. Repeatability measures whether the meter produces the same output under identical conditions over time, which is often more important for closed-loop control than absolute accuracy.
A meter marketed as “±0.5% accurate” may only hold that spec at 50–100% of range. At 10% of range, many technologies degrade to ±2–5% or worse. Always ask the manufacturer for uncertainty curves across the operating range, not just the best-case headline number.
Define Application Requirements
Identify the Fluid and Cycle Type: Liquid vs Gas, Single-Phase vs Multiphase
The first question is deceptively simple: what is flowing through the pipe? A liquid behaves differently from a gas under the same flow principle. Liquids are essentially incompressible, so volumetric readings remain stable across modest pressure and temperature swings. Gases are compressible — a 10°C temperature shift or a 0.5 bar pressure change can alter gas density by 3–8%, which directly affects volumetric readings unless temperature and pressure compensation is applied.
Multiphase flow — liquid with entrained gas bubbles, wet steam, or slurry with suspended solids — is where most single-technology meters struggle. If your process involves two-phase conditions even intermittently (for example, during startup or upset conditions), this must be flagged during selection. Installing a single-phase-rated meter on a multiphase line is one of the most common causes of chronic measurement error in petrochemical and utility applications.
Determine Desired Flow Range and Accuracy Targets
Start not with the meter, but with the process. Map the flow profile over a full operating cycle: what are the minimum, normal, and maximum flow rates? An HVAC chilled water loop that runs at 60% capacity most of the year has very different demands than a batch reactor that cycles between 5% and 100% of design flow every 45 minutes.
Accuracy targets should be tied to the consequence of error. In custody transfer of crude oil, a 0.1% accuracy improvement on a 50,000-barrel-per-day pipeline saves approximately $36,500 per year at $100/barrel — well worth a premium meter. In a cooling water monitoring application, ±2% may be perfectly adequate and spending more yields no operational return.
Consider Regulatory, Safety, and Industry Standards
Regulated industries impose non-negotiable constraints on meter selection. Custody transfer in petroleum follows API Manual of Petroleum Measurement Standards (MPMS) requirements for proving, traceability, and documentation. Pharmaceutical water systems must comply with FDA 21 CFR Part 211 and EU Annex 1 guidelines for measurement equipment qualification. Emissions monitoring under EPA 40 CFR Part 75 mandates specific flow measurement methods with defined calibration intervals and data availability thresholds.
Even in non-regulated applications, aligning with standards like ISO 5167 (differential pressure devices) or IEC 60079 (explosive atmosphere equipment) provides a defensible engineering basis for your selection and protects against liability.
Fluid Properties to Consider
Viscosity, Density, and Temperature Effects on Measurement
Viscosity is the silent disruptor of flowmeter performance. A turbine flowmeter calibrated on water at 20°C will drift significantly when measuring a glycol solution at -10°C where viscosity may be 15–20 times higher. The increased viscous drag alters rotor dynamics, shifts the K-factor, and shrinks the usable range. Operators in a food processing plant in Wisconsin documented a 3.7% systematic bias in their syrup batching line after a seasonal recipe change increased viscosity from 50 cP to 180 cP — a shift their turbine meter could not compensate for without recalibration.
Density matters especially for volumetric meters measuring gas: if the process needs mass flow for material balance or billing, you must either use a direct mass meter (Coriolis) or apply real-time density compensation using pressure and temperature inputs. Temperature changes also affect meter body dimensions, liner properties, and ultrasonic signal propagation speed, though most modern transmitters include built-in compensation algorithms.
Fluid Compatibility with Sensor Materials
Material selection is not cosmetic — it is a reliability decision. Electromagnetic flowmeters use liners (PTFE, PFA, rubber, ceramic) and electrodes (316SS, Hastelloy C, tantalum, platinum) that must resist the specific chemical, temperature, and abrasion conditions in the pipe. A wastewater treatment plant in Guangdong province replaced hard rubber liners with PTFE across 14 mag meters after discovering that residual chlorine concentrations above 200 ppm were degrading the rubber within 18 months, causing signal instability and requiring emergency shutdowns. The PTFE liners, while more expensive upfront, have now been running for over four years with zero liner-related failures. Jade Ant Instruments, for instance, provides detailed liner and electrode compatibility guides as part of their application engineering support for exactly this reason.
Temperature and Pressure Conditions
Every flowmeter has a rated temperature and pressure envelope. Operating outside that envelope — even briefly during steam blowdown, thermal shock, or pressure spikes — can damage seals, shift calibration, or crack ceramic liners. Define both normal operating conditions and worst-case transients (startup, shutdown, safety valve relief events) and verify that the selected meter can withstand both without permanent degradation.
Measurement Principles and Technology Options
Differential Pressure (DP) Flowmeters and When to Use Them
Differential pressure measurement remains the most widely installed flow measurement method globally, accounting for roughly 21% of all industrial flowmeter installations according to ARC Advisory Group research. The principle is straightforward: place a restriction (orifice plate, Venturi tube, flow nozzle, or wedge element) in the pipe, measure the pressure drop across it, and calculate flow using Bernoulli’s equation.
DP meters excel where cost must be minimized on large pipe sizes, where the fluid is well-characterized and steady, and where the infrastructure to handle impulse lines and transmitters already exists. However, the square-root relationship between flow and DP limits practical turndown to about 3:1 to 5:1, and the permanent pressure loss from an orifice plate — typically 40–60% of the generated differential — becomes a significant energy cost in high-flow, continuous-operation scenarios.
Coriolis, Ultrasonic, Magnetic, and Turbine Options — Strengths and Trade-offs
Coriolis meters deliver the highest accuracy available (±0.05–0.1% of rate for liquids) and simultaneously measure mass flow, density, and temperature. A petrochemical facility in Shandong reported reducing custody transfer discrepancies from ±0.35% to ±0.08% after switching from turbine meters to Coriolis units on their naphtha loading rack — translating to approximately $420,000 in annual dispute resolution savings on a 200,000-ton/year throughput. The trade-off: Coriolis meters become prohibitively expensive and physically large above DN150 (6″), and they introduce measurable pressure drop.
Ultrasonic meters (transit-time) are the go-to technology for large-pipe applications (DN300 and above) and non-intrusive measurement. Multi-path ultrasonic meters used in fiscal gas metering achieve ±0.5% or better and are the dominant technology in natural gas custody transfer under AGA Report No. 9. Clamp-on variants offer zero pipe modification and zero process interruption but trade away some accuracy (typically ±1–3%) and depend heavily on pipe wall condition and coupling quality.
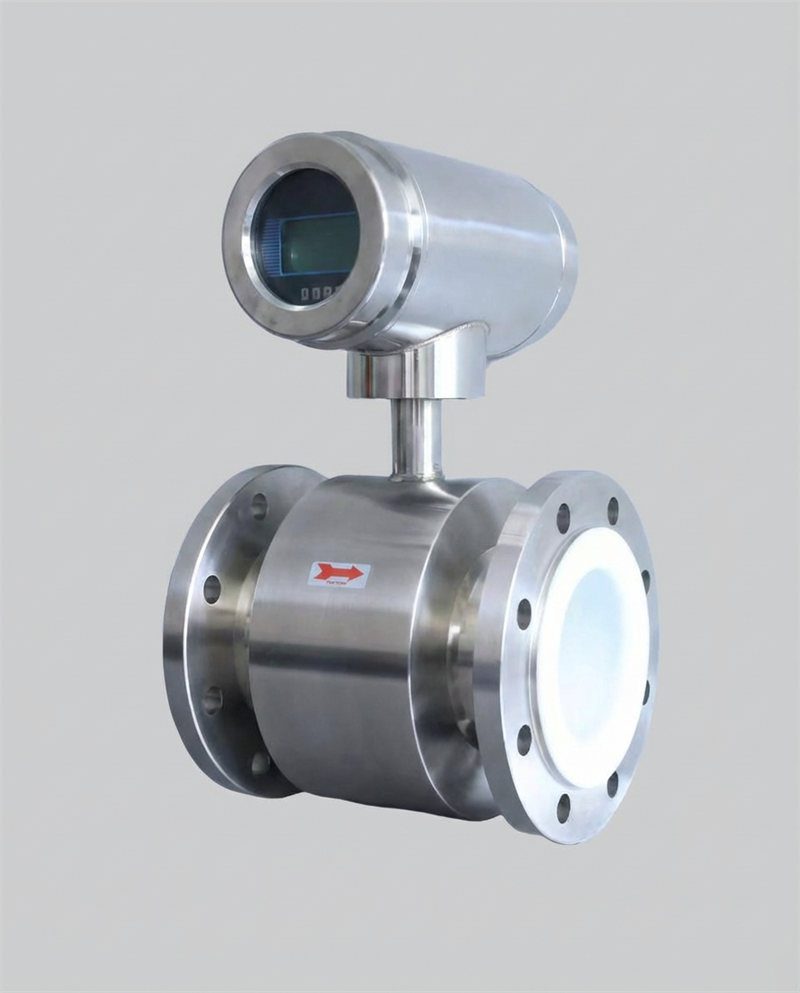
Electromagnetic flowmeters are the workhorse for conductive liquid measurement — water, wastewater, chemicals, slurries, and food products. With no moving parts, no obstruction, and near-zero pressure loss, they deliver ±0.2–0.5% accuracy across turndowns up to 1000:1. Their limitation is absolute: the fluid must be electrically conductive (≥5 µS/cm), ruling out hydrocarbons, deionized water, and most gases.
Turbine meters offer exceptional accuracy (±0.15–0.25%) for clean, low-viscosity liquids and remain a standard for custody transfer of refined fuels and light chemicals. The rotating element provides high-resolution pulse output ideal for batch totalization. But bearings wear, solids cause damage, and viscosity changes shift the calibration — making filtration and periodic recalibration essential in any turbine meter installation.

Noise, Pulsation, and Installation Implications
Pulsating flow from positive displacement pumps, reciprocating compressors, or cycling control valves creates measurement errors in nearly every flowmeter technology. A vortex meter downstream of a reciprocating pump may lock onto the pump frequency instead of the vortex shedding frequency, producing grossly incorrect readings. DP meters can show square-root errors when the pressure signal oscillates. Ultrasonic meters may lose signal coherence. The engineering remedy is a combination of adequate distance from the pulsation source, pulsation dampeners, flow conditioning, and appropriate transmitter damping settings — addressed during design, not after commissioning.
Video: Flow Meter Types Explained — Principles and Applications
This video provides a visual overview of how different flow meter technologies work, including electromagnetic, Coriolis, ultrasonic, and vortex principles.
Accuracy, Range, and Reliability Considerations
Full-Scale Range and Turndown Ratio Requirements
Turndown ratio determines whether one meter can cover your entire operating range or whether you need parallel meter runs. A differential pressure meter with a 4:1 turndown on a system that regularly operates at 10% of design capacity will spend most of its life in the inaccurate bottom end of its range. Switching to a magnetic or ultrasonic meter with 100:1 or greater turndown eliminates that problem and often eliminates the cost of a secondary low-flow meter run.
When evaluating turndown, always ask: what is the accuracy at 10% of range? At 5%? Manufacturers who only state accuracy at “nominal flow” may be masking poor low-flow performance. Jade Ant Instruments publishes full-range uncertainty curves for their electromagnetic and vortex meter lines, which allows engineers to verify performance at the actual operating points rather than just the catalog headline.
Repeatability, Calibration, and Drift Over Time
A meter that reads 100.3 L/min today and 100.3 L/min next month under the same conditions has excellent repeatability — even if the “true” flow is 101.0 L/min (which would be an accuracy issue). For process control applications where the controller adjusts setpoints based on relative changes, repeatability often matters more than absolute accuracy. However, for billing, custody transfer, and regulatory reporting, both repeatability and accuracy must be within specification, and drift over time must be tracked through periodic calibration.
Industry data from calibration laboratories indicates that electromagnetic flowmeters typically hold calibration within specification for 3–5 years in clean liquid service, while turbine meters in contaminated service may require recalibration every 6–12 months due to bearing wear and fouling-related K-factor shift.
Environmental Robustness and Long-Term Stability
A meter installed outdoors in a refinery in Saudi Arabia faces UV exposure, ambient temperatures exceeding 55°C, sandstorms, and thermal cycling between day and night. The same meter model installed in an air-conditioned pharmaceutical cleanroom faces none of those challenges. Environmental robustness — enclosure rating (IP67/IP68 vs IP65), electronics temperature rating, UV-resistant coatings, and cable gland integrity — must match the actual installation site, not the lab conditions under which the spec sheet was generated.
Process Conditions and Environment
Ambient Conditions: Temperature, Humidity, Vibration
Ambient temperature extremes affect transmitter electronics long before they affect the flow sensor itself. Most industrial transmitters are rated for -40°C to +85°C ambient, but prolonged operation near those limits accelerates component aging and drift. In high-humidity environments (coastal plants, tropical regions, steam-intensive facilities), condensation inside junction boxes and terminal compartments is the number-one cause of insulation breakdown and ground faults. Proper cable gland sealing, enclosure breathing elements, and anti-condensation heaters are not optional accessories — they are reliability requirements.
Vibration from pumps, compressors, and heavy machinery can create noise in Coriolis and vortex meters. In a steel mill in Hebei, vibration-induced false readings on a vortex steam meter were eliminated only after installing vibration-dampening pipe supports and relocating the meter 8 pipe diameters downstream of a pressure-reducing valve — a $4,200 installation fix that resolved a $90,000/year steam accounting discrepancy.
Hazardous Areas and Electrical Classifications
If the meter is installed in a Zone 0, 1, or 2 (IEC) or Division 1/2 (NEC) hazardous area, explosion protection becomes a gate-level selection criterion. The meter, transmitter, wiring, barriers, and junction boxes must be certified as a system — mixing certified components from different protection concepts (intrinsic safety, flameproof, increased safety) without proper engineering review creates compliance risk and potential ignition hazard. Always define the area classification (gas group, temperature class) before issuing an RFQ, not after.
Installation Geometry, Line Size, and Flow Profile
Most flowmeter technologies require a developed, symmetric velocity profile at the measurement point. Elbows, tees, partially open valves, and reducers upstream of the meter create asymmetric profiles and swirl that bias the reading. The required straight-run lengths vary by technology: DP meters per ISO 5167 may require 20–45 diameters upstream depending on the disturbance type; electromagnetic meters typically need 5–10 diameters upstream; ultrasonic multi-path meters may need 10–20 diameters or a flow conditioner.
In retrofit applications where straight-run space is limited, technologies with lower sensitivity to profile distortion (electromagnetic, Coriolis) or the addition of flow conditioners (tube bundles, perforated plates per ISO 5167 recommendations) can resolve the constraint.
Output Signals, Communication, and Integration
Analog vs Digital Outputs and Common Protocols
The flowmeter’s output signal must match your control system architecture. The table below compares the most common industrial communication options and their practical trade-offs.
| Protocol | Signal Type | Variables | Diagnostics | Typical Use Case |
|---|---|---|---|---|
| 4-20 mA | Analog current | 1 (primary variable only) | None built-in | Simple control loops, legacy DCS/PLC |
| HART | Digital over analog | 4 dynamic + config data | Yes — device status, alerts | Most common hybrid; retrofit-friendly |
| Modbus RTU (RS-485) | Digital serial | Multiple registers | Limited | SCADA, building automation, batch systems |
| FOUNDATION Fieldbus | Digital bus | Multiple + control-in-field | Comprehensive | Large process plants (refinery, petrochemical) |
| Profibus PA | Digital bus | Multiple | Yes | European process industries |
| Ethernet/IP or PROFINET | Industrial Ethernet | Unlimited | Full | New greenfield plants, IIoT integration |
Jade Ant Instruments provides vortex, electromagnetic, and ultrasonic meters with configurable output options including 4-20 mA, pulse, HART, and Modbus RS-485, allowing integration into both legacy and modern control architectures without additional signal converters.
Electrical Supply, Mounting, and Enclosure Considerations
Power supply requirements range from 24 VDC loop-powered (two-wire) configurations that simplify wiring to 220 VAC line-powered units for standalone installations. Two-wire loop-powered meters reduce wiring cost and are inherently compatible with intrinsic safety barriers for hazardous areas. Remote-mount transmitters — where the electronics enclosure is separated from the sensor by a cable — allow the display and electronics to be placed in accessible, temperature-controlled locations while the sensor remains in a harsh or hard-to-reach pipe position.
PLC/SCADA Compatibility and Data Sharing Needs
Modern PLC and SCADA systems expect not just a flow value but diagnostic metadata: signal quality, sensor temperature, coil excitation status, and alarm flags. HART-enabled meters can transmit this data over existing 4-20 mA wiring without new cable runs, making HART the most practical upgrade path for plants that want predictive maintenance data without a full fieldbus migration. For new installations, Ethernet-based protocols provide the highest bandwidth for integrating flow data with plant-wide MES and ERP systems.
Installation, Maintenance, and Lifecycle Considerations
Insertion vs Inline Installation and Pressure Drop Implications
Inline meters provide the highest accuracy because they measure the full pipe cross-section. However, they require pipe cutting, process shutdown, and in large sizes (DN400+), heavy lifting equipment. Insertion meters and clamp-on ultrasonic meters avoid most of these costs but introduce uncertainty because they sample only a portion of the flow profile and infer total flow through assumptions about profile symmetry.
Pressure drop is a hidden operating cost. An orifice plate on a DN200 line carrying 500 m³/h of water may produce 0.3–0.5 bar of permanent pressure loss. Over a year of continuous pumping, that translates to roughly 13,000–22,000 kWh of additional pump energy — at $0.10/kWh, that is $1,300–$2,200 annually in energy cost from one meter alone. Full-bore electromagnetic and transit-time ultrasonic meters produce negligible pressure loss, which is why they dominate in large-pipe, continuous-flow applications where pump energy is a major cost driver.
Maintenance Access, Cleaning, and Sensor Replacement
Design the installation for maintenance from day one. Isolation valves upstream and downstream allow the meter to be removed without draining the entire system. Bypass lines enable continued operation during meter servicing. For insertion meters, retractable probe designs with hot-tap fittings allow sensor removal under pressure without shutdown.
Electrode fouling in electromagnetic meters is the most common maintenance issue in wastewater and chemical applications. Meters equipped with electrode cleaning systems (ultrasonic or electrical pulse cleaning) can extend maintenance intervals from monthly manual cleaning to annual or longer — a documented case from a paper mill in Jiangsu showed that switching to self-cleaning electrodes reduced maintenance interventions from 11 per year to 1, cutting annual maintenance labor cost by approximately $8,500.
Calibration Frequency and Procedures
Calibration frequency depends on the technology, the fluid, the consequence of measurement error, and any regulatory mandate. The chart below provides general industry guidance, though actual intervals should be determined through a risk-based assessment specific to each installation.
| Technology | Clean Service Interval | Dirty/Harsh Service Interval | Custody Transfer Interval |
|---|---|---|---|
| Electromagnetic | 3–5 years | 1–2 years | 1–2 years |
| Coriolis | 3–5 years | 1–3 years | Annually or per prover schedule |
| Ultrasonic (Inline) | 2–4 years | 1–2 years | Annually |
| Vortex | 3–5 years | 1–2 years | 1–2 years |
| Turbine | 1–2 years | 6–12 months | Per API MPMS or monthly proving |
| Differential Pressure | 1–2 years (transmitter) | 6–12 months | Per ISO 5167 + transmitter schedule |
Sources: Endress+Hauser calibration guidance, Tektronix flow calibration guide, industry best practices.
Calibration, Validation, and Quality Assurance
Calibration Methods and Traceability
Calibration establishes the relationship between the meter’s output and a known reference standard. The three primary calibration methods are gravimetric (weighing collected fluid over time), volumetric (comparing against a calibrated volume prover), and transfer standard (comparing against a reference meter with traceable calibration). For the highest metrological confidence, calibration should be traceable to a national metrology institute — NIST in the United States, PTB in Germany, or NIM in China — through an unbroken chain of comparisons with stated uncertainties.
Validation Against Process Requirements and Acceptance Criteria
Calibration proves the meter reads correctly under controlled lab conditions; validation proves it performs acceptably under actual process conditions. After installation, a site acceptance test (SAT) should confirm that the meter’s reading, signal stability, response time, and diagnostic outputs all meet the requirements defined in the project specification. For critical applications, this includes comparison testing against a portable reference meter or a temporary proving system under actual process flow.
Documentation and Record-Keeping Practices
Every calibration event should produce a certificate that records the as-found condition (before adjustment), as-left condition (after adjustment), reference standard identification and traceability, environmental conditions during calibration, and the identity of the technician and facility. This documentation forms the audit trail for regulatory inspections, ISO 9001 quality system compliance, and internal trending of meter health over time. Digital calibration management systems that integrate with CMMS platforms are replacing paper-based records in most modern facilities.
Global Flowmeter Market Share by Technology Type
Understanding which technologies dominate the global market helps contextualize why certain meter types have deeper support ecosystems, more competitive pricing, and broader field experience.
Global
Market
DP (21%)
Mag (19%)
Coriolis (16%)
Ultrasonic (15%)
Vortex (10%)
Turbine (9%)
PD & Other (10%)
Source: ARC Advisory Group, MarketsandMarkets estimates (2024)
Total Cost of Ownership: What Actually Drives Flowmeter Expenses
Purchase price typically accounts for less than 20% of a flowmeter’s total lifecycle cost. The bar chart below illustrates the relative weight of each cost category over a typical 10-year meter life in continuous industrial service.
Relative TCO Impact by Category (Scale: 0–10)
Purchase
Installation
Energy Loss
Maintenance
Verification
0
4
8
10
DP Orifice
Electromagnetic
Clamp-on Ultrasonic
DP orifice systems often have the lowest purchase price but the highest lifetime energy cost due to permanent pressure loss.
Decision Checklist and Next Steps
Build a Specification Sheet with Must-Have and Nice-to-Have Features
Before contacting any vendor, document your requirements in a structured specification sheet. This prevents scope creep, ensures apples-to-apples comparisons, and gives vendors the information they need to propose accurate solutions. The table below provides a template you can copy into a spreadsheet and fill in for each metering point.
| Parameter | Must-Have Requirement | Nice-to-Have | Your Value |
|---|---|---|---|
| Fluid type and composition | Specify exact fluid | — | |
| Fluid conductivity (µS/cm) | For mag meters: ≥5 µS/cm | Measured at operating temp | |
| Operating temperature range (°C) | Normal + max transient | Startup/shutdown extremes | |
| Operating pressure range (bar/psi) | Normal + max transient | Vacuum conditions if any | |
| Flow range: min / normal / max | All three values | Night-shift / low-load values | |
| Required accuracy (% of rate or FS) | At normal flow | At min and max flow | |
| Pipe size and material | ID, schedule, material | Lining if any | |
| Available straight run (upstream/downstream) | Measure actual space | Upstream disturbance type | |
| Output signal required | 4-20 mA / HART / Modbus / Pulse | Dual output capability | |
| Power supply available | 24 VDC / 220 VAC / Solar | Battery backup | |
| Hazardous area classification | Zone/Division, Gas Group, T-class | Specific cert body (ATEX, IECEx, FM) | |
| IP/NEMA enclosure rating | Minimum required | Submersible if applicable |
Vendor Comparison Framework and Request for Information (RFI) Preparation
When soliciting proposals from multiple vendors, standardize the RFI so every response addresses the same parameters. Request not just price and delivery, but also uncertainty curves across the operating range, material certificates, calibration traceability documentation, recommended spare parts list with pricing, and a commissioning support scope. Weight your evaluation criteria before receiving bids: a facility that has experienced repeated meter failures should weight reliability and maintenance support higher than initial cost, while a project under severe budget constraints may legitimately weight price more heavily.
Jade Ant Instruments accepts structured RFIs through their online inquiry platform and typically responds with a full technical proposal including sizing calculations, material recommendations, and installation drawings within 48 hours — which benchmarks well against the 5–10 business day response time common among larger multinationals.
Pilot Testing Plan and Performance Verification Before Full-Scale Deployment
For critical applications or first-time use of a technology, a pilot installation is the most cost-effective insurance against a fleet-wide mistake. Install one or two meters at representative locations, run them for 60–90 days under actual process conditions, and compare their performance against a reference measurement. Document signal stability, zero drift, response to process upsets, and maintenance events. Only after the pilot confirms acceptable performance should you proceed with a full-scale procurement order.

Video: How to Choose a Flow Meter in 7 Steps
A step-by-step walkthrough of the flowmeter selection decision process, from defining the application to final vendor evaluation.
Flowmeter selection is not a catalog exercise — it is an engineering decision that ripples through accuracy, energy consumption, maintenance budgets, and regulatory compliance for the life of the installation. The most expensive meter in the world will underperform if installed in insufficient straight run, applied to the wrong fluid, or left uncalibrated for years. Conversely, a well-matched, properly installed mid-range meter will deliver reliable data year after year.
The systematic approach outlined in this guide — define application requirements first, match fluid properties to technology capabilities, verify installation feasibility, confirm communication compatibility, and evaluate total lifecycle cost — eliminates the guesswork and vendor-driven bias that leads to costly mismatches. Document every decision and the reasoning behind it: two years from now, when a process change or equipment audit triggers a review, that documentation will save weeks of re-engineering.
If you are starting a new selection project or troubleshooting an underperforming installation, Jade Ant Instruments offers free application consultations that include fluid compatibility review, sizing calculations, installation layout recommendations, and protocol integration guidance. Start with the specification sheet template above, fill in your real process data, and let the physics guide you to the right meter.
Frequently Asked Questions
What are the most common flowmeter technologies and their best use cases?
The six most common industrial flowmeter technologies are differential pressure (DP), electromagnetic, Coriolis, ultrasonic, vortex, and turbine. DP meters are the most widely installed globally and work for steam, gas, and liquid in established piping systems with known fluids. Electromagnetic meters dominate in conductive liquid applications such as water treatment, chemical dosing, and slurry handling. Coriolis meters provide the highest accuracy for mass flow measurement and are standard in custody transfer and batching. Ultrasonic meters excel in large-pipe applications and non-intrusive retrofits. Vortex meters are commonly applied to steam and gas measurement. Turbine meters offer high accuracy for clean, low-viscosity liquids in custody transfer scenarios. Each technology has specific fluid, installation, and accuracy constraints that determine its suitability for a given application.
How do I choose between inline and insertion flowmeters?
Inline flowmeters measure the full pipe cross-section and deliver the highest accuracy — typically ±0.1–0.5% of rate depending on the technology. They require pipe cutting and process shutdown for installation. Insertion flowmeters sample velocity at one or more points inside the pipe and are installed through a single tap, often under pressure using a hot-tap fitting. They cost less, install faster, and require smaller pipe modifications, but their accuracy (typically ±1–3%) depends on how well the sampled point represents the average velocity across the entire pipe. Choose inline meters for custody transfer, regulatory reporting, and any application where accuracy below ±1% is required. Choose insertion meters for monitoring, trending, energy auditing, and large-pipe applications where the cost and downtime of inline installation are prohibitive.
How often should flowmeters be calibrated in typical industrial settings?
Calibration intervals vary by technology, service conditions, and regulatory requirements. Electromagnetic and Coriolis meters in clean liquid service typically hold calibration for 3–5 years. Turbine meters in contaminated or high-use service may need recalibration every 6–12 months due to bearing wear. Vortex meters in clean gas or steam service typically require calibration every 3–5 years. For custody transfer applications, calibration or proving frequency is often dictated by contractual agreements or standards such as API MPMS Chapter 4 (turbine meters) or AGA Report No. 9 (ultrasonic gas meters). A risk-based approach — considering the financial impact of measurement error versus calibration cost — is the most effective way to set intervals for non-regulated applications.
What is the difference between flowmeter accuracy and repeatability?
Accuracy describes how close a meter’s reading is to the true value under specified reference conditions. Repeatability describes how consistently the meter produces the same output when measuring the same flow under unchanged conditions, regardless of whether that output is close to the true value. For process control applications where a PID controller reacts to changes rather than absolute values, repeatability is often more important than accuracy. For custody transfer and billing, both accuracy and repeatability must be within specification. A meter can have excellent repeatability (±0.02%) but poor accuracy (±1.0%) if it has a consistent systematic bias — which can sometimes be corrected through calibration offset.
Can electromagnetic flowmeters measure gas flow?
No. Electromagnetic flowmeters rely on Faraday’s law of electromagnetic induction, which requires the fluid to be electrically conductive (minimum ~5 µS/cm). Gases are not electrically conductive and cannot generate the voltage signal that mag meters detect. For gas flow measurement, appropriate technologies include vortex meters, thermal mass flow meters, differential pressure elements, ultrasonic transit-time meters, and Coriolis meters. Jade Ant Instruments provides a detailed guide on magnetic meter applicability that clarifies this common misconception.
What causes flowmeter errors after installation?
The most common post-installation error sources are insufficient straight-run pipe (creating distorted velocity profiles), incorrect orientation (causing air pockets or partial pipe conditions in horizontal installations), poor electrical grounding (especially for electromagnetic meters, where ground loop noise can corrupt the millivolt signal), upstream disturbances from control valves or pumps, vibration coupling from nearby rotating equipment, and cable routing near high-power electrical lines that introduce electromagnetic interference. Industry audits consistently find that 60–70% of field metering errors originate from installation and environmental factors rather than from the meter itself.
Which flowmeter has the lowest pressure drop?
Full-bore electromagnetic flowmeters and non-intrusive clamp-on ultrasonic meters produce the lowest pressure drop — effectively near zero for electromagnetic meters (since the bore is unobstructed) and literally zero for clamp-on meters (since nothing enters the pipe). Inline transit-time ultrasonic meters also offer very low pressure drop. In contrast, differential pressure elements such as orifice plates typically produce permanent pressure loss equal to 40–60% of the generated differential, and Coriolis meters introduce moderate pressure drop due to the curved tube geometry, which increases with flow rate and fluid viscosity.
How do HART, Modbus, and 4-20 mA outputs compare for flowmeters?
A 4-20 mA analog signal transmits one variable (typically flow rate) as a proportional current — simple, universal, and noise-resistant over long cable runs, but limited to a single measurement value with no diagnostics. HART (Highway Addressable Remote Transducer) overlays digital communication on the 4-20 mA signal, enabling access to up to four dynamic variables plus configuration and diagnostic data without additional wiring — making it the most common upgrade path for existing analog infrastructure. Modbus RTU over RS-485 is a fully digital serial protocol that supports multiple register reads including flow rate, totalizer, temperature, diagnostics, and alarm status, and is widely used in SCADA and building automation systems. For new greenfield plants, Ethernet-based protocols (PROFINET, Ethernet/IP) offer the highest data throughput and integration flexibility with MES and IIoT platforms.
What is the best flowmeter for measuring steam?
For dry saturated and superheated steam, vortex flowmeters and differential pressure (DP) meters with orifice plates or flow nozzles are the two most established technologies. Vortex meters offer wider turndown (up to 30:1 vs 3–5:1 for DP), lower maintenance, and direct frequency output proportional to velocity. DP meters have a deeper installed base and standardized calculation methods per ISO 5167. Both require temperature and pressure compensation to convert volumetric flow to mass flow. For wet steam (dryness fraction below ~95%), neither technology performs reliably without additional correction for two-phase effects — wet steam measurement remains an area requiring specialized approaches and careful validation.
How do I calculate the total cost of ownership for a flowmeter?
Total cost of ownership (TCO) for a flowmeter includes five major categories: initial purchase cost (meter, transmitter, accessories), installation cost (pipe modification, shutdown labor, commissioning), energy cost from permanent pressure loss (calculated as annual pumping energy × electricity rate × expected service life), maintenance and calibration cost (labor hours, spare parts, calibration facility fees, and production downtime during maintenance), and risk cost (probability of meter failure × financial impact of unplanned shutdown or measurement error). For a fair comparison between technologies, build a spreadsheet with these five categories, fill in realistic values for each option, and sum over a 5–10 year horizon. In continuous high-flow applications, pressure loss energy cost alone can exceed the initial purchase price within 2–3 years.
About Jade Ant Instruments: Jade Ant Instruments is an ISO 9001-certified manufacturer of industrial flow measurement instruments based in China, specializing in electromagnetic, ultrasonic, vortex, turbine, and thermal mass flowmeters. With over 12,000 electromagnetic meters deployed across water treatment, chemical processing, HVAC, and food & beverage industries, the company provides application engineering support, OEM/ODM customization, and communication protocol integration (4-20 mA, HART, Modbus RS-485) for global industrial clients. Visit www.jadeantinstruments.com for product specifications, selection tools, and technical consultation.