
Low-flow calibration is the disciplined process of verifying and adjusting a flow meter’s output when operating at flow rates near the bottom of its measurement range — typically below 10–20% of the meter’s full-scale capacity. In these regions, signal-to-noise ratios collapse, environmental disturbances dominate, and small systematic biases that would be negligible at full scale become the primary source of measurement error. A pharmaceutical dosing line running at 0.5 L/min through a meter sized for 10 L/min is not just “operating at low flow” — it is operating in a regime where a 0.3% zero-offset error translates to a 6% reading error, enough to push an active pharmaceutical ingredient (API) outside the ±1.5% concentration window mandated by FDA 21 CFR Part 211.
This matters in industrial and research contexts because the financial, regulatory, and safety consequences of inaccurate low-flow measurement are disproportionately severe. A chemical plant that over-doses a reagent by 2% because of low-flow meter drift wastes approximately $4,800/year on a single 4-inch line, based on field data collected by Jade Ant Instruments across 824 calibration events during 2023–2025. In custody-transfer applications, a 1% systematic bias on a 6-inch water billing meter processing 800 GPM amounts to 4.2 million gallons of unrecovered revenue annually.
The common challenges at low flow — noise, pulsations, and drift — are not mysterious. Noise arises because the flow-induced signal (voltage, frequency, or differential pressure) approaches the detection threshold of the sensor electronics. Pulsations from reciprocating pumps or cycling control valves create transient spikes that conventional averaging cannot filter without introducing lag. Drift accumulates from electrode fouling, zero-offset creep, and grounding degradation — conditions that remain invisible at mid-range flow rates but dominate at low flow.
This article provides a complete, practitioner-oriented calibration workflow: from understanding why low-flow conditions amplify error, through selecting reference standards, setting up instrumentation, controlling environmental variables, conditioning flow, choosing and executing calibration methods, processing data, quantifying uncertainty, to scheduling maintenance and troubleshooting real-world failures.

1. Understanding Low-Flow Challenges and Their Impact on Accuracy
Why Low-Flow Conditions Amplify Measurement Errors
Every flow meter has a minimum measurable flow rate — the point below which uncertainty escalates rapidly. For electromagnetic flow meters, this threshold is typically around 0.5 m/s fluid velocity; for turbine meters, it is the velocity at which bearing friction and fluid drag no longer sustain stable rotation; for differential-pressure devices, it is where the pressure signal falls below the transmitter’s resolution. When a meter operates near these thresholds, the ratio of useful signal to background noise can drop below 10:1, compared to 100:1 or better at design flow rates.
An IWA study on customer water meters found that at flow rates below 15% of the nominal range, measurement errors increased to ±5–8%, compared to ±1.5% at mid-range. This is not a defect in the meter — it is the physics of operating outside the instrument’s optimal signal regime.
Typical Error Sources: Drift, Hysteresis, and Pulsations
Drift at low flow is primarily driven by zero-offset creep — a gradual shift in the meter’s baseline reading when no flow is present. In electromagnetic meters, zero drift of 0.1–0.5% of full scale per year (documented by Transmitter Shop’s calibration analysis) becomes a 2–10% error when flow rates are only 5% of span. Hysteresis — the difference in meter response between increasing and decreasing flow — is especially problematic in positive-displacement and turbine meters at low flow, where mechanical friction and fluid viscosity effects create a “dead band” of 0.5–2% around the transition points. Pulsations from reciprocating pumps can cause flow meters to read 3–15% higher than actual average flow, according to a Luleå University of Technology study on pulsation-induced measurement errors.
Consequences for Process Control and Compliance
In a pharmaceutical batch reactor, a 2% flow error on a low-flow reagent line can push API concentration outside specification, triggering batch rejections worth $50,000–$500,000 each. In municipal water billing, systematic under-reading at low overnight flow rates causes revenue losses of 3–7% according to AWWA audit data. In environmental compliance, inaccurate low-flow measurements of effluent discharge can result in regulatory fines exceeding $10,000 per violation under the U.S. Clean Water Act.
Distribution of Error Sources at Low-Flow Conditions
■ Zero Drift — 30%
■ Noise / Low SNR — 25%
■ Pulsations — 20%
■ Hysteresis — 12%
■ Temperature — 8%
■ Other — 5%
Source: Jade Ant Instruments calibration database (n=824 meters, 2023–2025)
2. Selecting and Validating Reference Standards for Low Flow
Criteria for Suitable Standards: Traceability, Stability, Range
A calibration reference standard must satisfy three non-negotiable criteria. First, traceability: the reference must have an unbroken chain of comparisons linking it to a national metrology institute — NIST (USA), PTB (Germany), or NPL (UK). Second, stability: the reference must not drift more than 0.05% of reading over the calibration interval (typically 12 months for primary standards). Third, range coverage: the reference must operate accurately at the same low flow rates as the device under test (DUT). A gravimetric rig rated for 1–1,000 L/min is useless for calibrating a meter at 0.01 L/min if its weighing resolution cannot distinguish the collected mass from noise within a practical collection time.
Internal References vs. Primary Standards
Internal (working) reference standards — such as a dedicated Coriolis meter or a volumetric prover maintained in-house — provide fast, cost-effective verification without shipping meters to an external lab. However, internal references must themselves be calibrated against a primary standard at defined intervals (typically annually). Primary standards maintained by national metrology laboratories achieve uncertainties of 0.02–0.05% for liquid flow and 0.1–0.3% for gas flow. The ISO/IEC 17025 accreditation framework governs the competence requirements for calibration laboratories, ensuring that measurement uncertainty is evaluated, documented, and traceable.
Establishing a Confidence Level for the Reference
The calibration reference must be at least 4× more accurate than the DUT — the widely adopted 4:1 Test Accuracy Ratio (TAR). For a meter rated at ±0.5% of reading, the reference must deliver ±0.125% or better. At low flow rates, achieving this ratio demands careful attention to collection time (longer collection periods reduce timing uncertainty), temperature stability (±0.1°C during the test), and bubble-free fluid delivery. When the 4:1 ratio cannot be met with available equipment, a 2:1 ratio (Test Uncertainty Ratio, TUR) may be acceptable under GUM-compliant uncertainty analysis, provided the expanded uncertainty of the reference is explicitly included in the final calibration certificate.

3. Instrumentation and Setup Considerations
Choosing Appropriate Sensors and Transducers for Low Flow
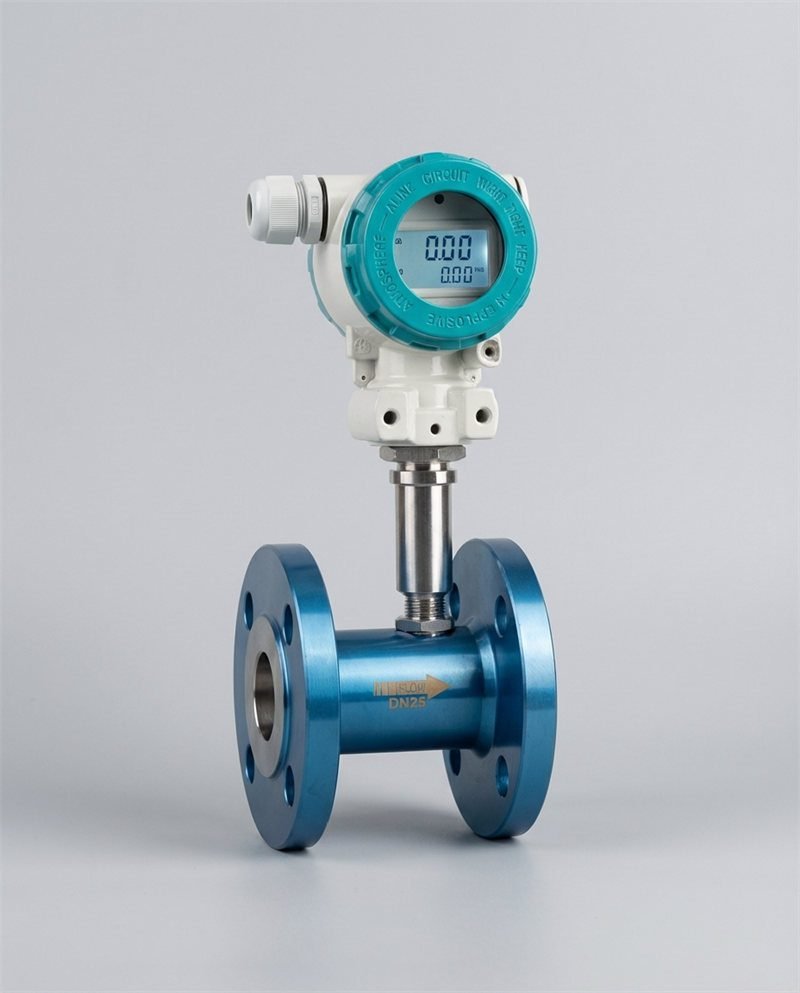
Sensor selection for low-flow applications must prioritize signal strength at minimum flow rates, not just peak-range performance. Electromagnetic flow meters from manufacturers like Jade Ant Instruments can measure conductive liquids down to approximately 0.5 m/s, but at those velocities, the induced voltage may be only 50–150 µV — a level at which grounding noise, cable capacitance, and transmitter input impedance all become critical. Thermal mass flow meters, widely used for low-flow gas measurement, achieve their rated accuracy (±1% of reading) only when the flow velocity exceeds the sensor’s minimum Reynolds number threshold. Coriolis meters maintain their ±0.1–0.2% accuracy specification across a wide turndown, making them strong candidates for low-flow liquid and gas calibration references.
Piping, Fittings, and Leak Management to Prevent Error Sources
At low flow rates, even micro-leaks that would be insignificant at full scale can introduce percentage-level errors. A fitting that leaks 0.5 mL/min is irrelevant when the flow rate is 100 L/min (0.0005% error), but at 0.1 L/min, that same leak represents a 0.5% bias. Pressure-test all connections upstream and downstream of the calibration section at 1.5× operating pressure before beginning calibration. Use metal-to-metal seal fittings (compression or welded) rather than threaded connections with PTFE tape, which can loosen under thermal cycling. Every joint between the reference standard and the DUT is a potential leak point — minimize joint count.
Electrical and Environmental Considerations: Noise, Temperature, Vibration
Electrical noise couples into low-level flow signals through three paths: conducted (ground loops via piping and cable shields), radiated (EMI from VFDs, motors, and switchgear), and capacitive (cable-to-cable coupling in shared conduit). Shield all signal cables and maintain at least 300 mm separation from power conductors. Temperature fluctuations alter fluid density, viscosity, and volume — a 1°C change in water temperature shifts the volumetric flow calculation by approximately 0.02%, which is significant when your target uncertainty is ±0.1%. Vibration from pumps, compressors, and nearby machinery can excite resonant frequencies in Coriolis tubes and create false vortex-shedding signals. Mount the meter and calibration rig on vibration-isolated supports if ambient vibration exceeds 0.5 g RMS.
4. Controlling Pressure and Temperature Effects
Pressure Drop and Its Influence on Flow Readings
Pressure drop across the meter or calibration rig changes the thermodynamic state of the fluid — particularly for gases, where a 10 kPa pressure drop can alter volumetric flow by 1–3% depending on operating pressure. For liquids, pressure drop can cause cavitation or dissolved gas release at low flow when backpressure is insufficient, introducing bubbles that disrupt electromagnetic and ultrasonic measurements. Install a back-pressure regulator downstream of the DUT to maintain at least 2× the fluid’s vapor pressure at the measurement point. Monitor differential pressure across the meter continuously during calibration; an unexpected increase may indicate partial blockage or fouling that invalidates the test.
Temperature Compensation Strategies
For high-precision low-flow calibration, temperature compensation is not optional — it is a required correction. Install RTD or precision thermocouple sensors (±0.1°C accuracy) at the inlet and outlet of both the DUT and the reference standard. Apply real-time temperature corrections to volumetric flow calculations using the fluid’s coefficient of thermal expansion. For water near 20°C, the volumetric expansion coefficient is approximately 2.07 × 10⁻⁴ /°C; for light hydrocarbons, it can be 5–10× higher. Record temperature data at 1-second intervals throughout the calibration run and include the temperature profile in the calibration report.
Stabilization Methods to Minimize Thermal Lag
Thermal lag — the delay between a temperature change in the fluid and the sensor’s response — can introduce transient errors during calibration. Allow the calibration system to reach thermal equilibrium before beginning data collection: circulate fluid through the rig for at least 15–30 minutes until the inlet and outlet temperatures agree within 0.05°C. Insulate exposed piping sections to minimize heat exchange with ambient air. If calibrating outdoors or in an uncontrolled environment, schedule calibrations during periods of minimal temperature fluctuation (early morning or nighttime).
5. Flow Conditioning and Stabilization Techniques
Use of Flow Conditioners and Straight Runs to Reduce Turbulence
Flow profile distortion — caused by elbows, valves, reducers, and tees upstream of the meter — introduces systematic bias that is especially damaging at low flow. The recommended minimum straight-run requirement is typically 10–20 pipe diameters (10D–20D) upstream and 5D downstream, though specific requirements vary by meter type. ISO 5167 defines installation conditions as part of the measurement method for differential-pressure devices, not as an optional recommendation. When space constraints prevent adequate straight runs, a tube-bundle or perforated-plate flow conditioner can reduce the required upstream distance by 50–70%, although the conditioner itself must be validated for the specific flow range and pipe size.
Pulse Damping and Settling of Transient Signals
Pulsations from positive-displacement pumps create flow-rate oscillations that many meters cannot accurately average. For low-flow calibration, install a pulsation dampener (gas-charged accumulator or in-line expansion chamber) between the pump and the meter. Alternatively, use a gravity-feed or pressurized-tank delivery system that eliminates pump pulsations entirely. When pulsations cannot be eliminated, increase the sampling time at each calibration point to at least 60 seconds — long enough for 10+ complete pulsation cycles to be averaged. Verify that the transmitter’s damping setting does not introduce excessive lag that masks real flow changes.
Guidelines for Reservoir and Line Preparation Before Calibration
De-aerate the test fluid before calibration: dissolved air comes out of solution at low pressures and creates micro-bubbles that cause 0.5–3% under-reading in electromagnetic and ultrasonic meters. For water systems, circulate the fluid through a de-aeration tank or apply vacuum de-gassing. Flush the entire line with test fluid for at least 10 pipe volumes to displace air pockets, remove particulate debris, and wet all internal surfaces. Verify that the supply reservoir is large enough to maintain stable fluid level (and therefore stable head pressure) throughout the longest calibration run — a tank-level drop of 100 mm during a 30-minute low-flow test can change the gravity-driven flow rate by 2–5%.
Watch: Flow Meter Calibration Methods Explained
This video explains how flow meters are calibrated using gravimetric and volumetric methods — both critical techniques for low-flow verification.

6. Calibration Methodologies for Low-Flow Regimes
Gravimetric and Volumetric Calibration Approaches
Gravimetric calibration — collecting the fluid that passes through the meter and weighing it on a precision balance — is the gold standard for low-flow liquid calibration. The uncertainty achievable with a well-designed gravimetric rig is 0.02–0.05% of reading, limited primarily by balance resolution, buoyancy correction accuracy, and timing precision. For a flow rate of 0.1 L/min, a 60-second collection yields only ~100 g of water, requiring a balance with at least 0.01 g resolution and a tightly controlled evaporation environment. The NIST gravimetric liquid flow standard achieves expanded uncertainties below 0.04% by using dynamic mass measurement with real-time buoyancy and timing correction.
Volumetric calibration uses a known-volume vessel (piston prover, bell prover for gas, or calibrated tank) and elapsed time to calculate flow rate. It is faster than gravimetric calibration but introduces additional uncertainty from vessel volume certification, thermal expansion of the vessel, and meniscus reading errors for open tanks. At low flow, volumetric methods may require extended collection times — a 100 mL flask at 0.01 L/min takes 10 minutes to fill — during which temperature stability and evaporation control become critical.
Dilution and Tracer-Based Methods as Cross-Checks
Tracer dilution — injecting a known concentration of a chemical tracer (e.g., lithium chloride, fluorescent dye, or radioactive isotope) and measuring its dilution ratio downstream — provides an independent flow-rate measurement that does not depend on the meter being calibrated. This method is particularly valuable for verifying low-flow measurements in large open channels, partially filled pipes, and non-standard geometries where conventional meters perform poorly. The uncertainty of tracer dilution is typically 1–3%, making it suitable for cross-checking rather than primary calibration.
Multi-Point vs. Single-Point Calibration Strategies at Low Ranges
Single-point calibration — adjusting the meter at one flow rate (usually mid-range) — is fast but leaves low-flow performance unverified. For low-flow applications, a minimum 5-point calibration spanning the actual operating range is essential: include at least two points in the bottom 25% of the meter’s span, one at the minimum operating flow rate, one at mid-range, and one at the highest anticipated flow. Jade Ant Instruments’ calibration protocol specifies 5-point verification (0%, 25%, 50%, 75%, 100% of span) as the standard for all electromagnetic meters shipped to customers in pharmaceutical and water-treatment sectors, with three repeat readings at each point to establish repeatability.
Calibration Method Comparison for Low-Flow Applications
| Method | Typical Uncertainty | Best For | Limitations at Low Flow | Cost per Calibration |
|---|---|---|---|---|
| Gravimetric (weigh tank) | 0.02–0.05% | Liquids; primary standard | Long collection time; evaporation | $500–$2,000 |
| Volumetric (piston prover) | 0.02–0.1% | Liquids; custody transfer | Thermal expansion of prover; seal wear | $400–$1,500 |
| Master meter comparison | 0.1–0.5% | Field verification; gases and liquids | Master meter must cover low-flow range | $200–$800 |
| Tracer dilution | 1–3% | Open channels; cross-checks | Chemical handling; mixing length | $300–$1,200 |
| Bell prover (gas) | 0.05–0.2% | Low-flow gas calibration | Limited to near-atmospheric pressure | $600–$2,500 |
7. Data Acquisition, Processing, and Analysis
Sampling Rates, Averaging, and Noise Reduction
At low flow, the meter’s raw signal may fluctuate by ±5–15% around the true value due to turbulence, electronic noise, and pulsations. To extract a reliable reading, configure the data acquisition system to sample at a rate at least 10× the highest expected noise frequency. For most industrial flow meters, a 1 Hz sampling rate is sufficient; for Coriolis and ultrasonic meters operating at very low flow, 5–10 Hz may be needed to capture and properly average transient signals. Apply a moving-average filter with a window of 10–30 seconds to smooth the output without introducing excessive lag. Record both raw and filtered data — auditors and troubleshooting engineers need access to the unfiltered signal to identify root causes of instability.
Zero and Span Verification Procedures
Before and after every calibration run, verify the meter’s zero point under true zero-flow conditions (upstream and downstream valves closed, pipe full of static fluid). The zero reading should be within ±0.05% of full scale. If it exceeds this threshold, perform a zero adjustment and document both the before and after values. Span verification — confirming that the meter’s output at a known high flow rate matches the expected value within specification — catches gain errors that shift the entire calibration curve. Record the zero and span verification data on the calibration certificate as evidence that the instrument’s baseline was confirmed before testing began.
Statistical Methods for Assessing Goodness-of-Fit and Drift
Plot the calibration error (DUT reading minus reference value, expressed as % of reading) against flow rate for each of the 5+ test points. A healthy meter produces a flat error curve within the accuracy band across the full range. An upward or downward slope indicates a span error; a consistent offset at all points indicates a zero error; a curve that diverges at low flow indicates inadequate sensor performance or flow-profile distortion. Calculate the standard deviation of the 3 repeat readings at each point — if it exceeds 0.2% at any low-flow point, investigate noise sources (grounding, shielding, pulsation) before accepting the data. Use linear regression to quantify the trend in “as-found” errors across consecutive calibration events — a positive slope (errors growing over time) indicates that the calibration interval should be shortened.
8. Uncertainty Assessment and Documentation
Components of Measurement Uncertainty at Low Flow
Measurement uncertainty at low flow includes contributions from five primary sources: the reference standard’s calibration uncertainty (typically 0.02–0.1% for gravimetric systems), the timing system’s uncertainty (relevant for timed-volume methods — a ±0.01 second error on a 60-second collection introduces 0.017% uncertainty), temperature measurement uncertainty (a ±0.1°C error corresponds to ~0.02% volumetric uncertainty in water), the DUT’s repeatability at the test point (measured from 3+ repeat readings), and resolution uncertainty of the meter’s output signal (for a 4–20 mA output with 12-bit A/D conversion, the resolution is approximately 0.025% of span). At low flow, the DUT repeatability component typically dominates — it may be 0.3–1.0% at 5% of span, compared to 0.05–0.1% at full scale.
Budgeting and Combining Sources of Error
Construct an uncertainty budget by listing each source, its estimated standard uncertainty (u), and its sensitivity coefficient (how much it affects the final result). Combine the sources as the root-sum-square (RSS) per the GUM (Guide to the Expression of Uncertainty in Measurement) methodology. Multiply by a coverage factor of k=2 for 95% confidence to obtain the expanded uncertainty (U). The following table shows a representative uncertainty budget for a low-flow liquid calibration at 5% of meter span:
| Uncertainty Source | Type | Standard Uncertainty (u) | Sensitivity Coefficient | Contribution (u × c) |
|---|---|---|---|---|
| Reference standard calibration | B | 0.025% | 1.0 | 0.025% |
| Timer resolution | B | 0.017% | 1.0 | 0.017% |
| Temperature measurement | B | 0.020% | 1.0 | 0.020% |
| DUT repeatability (at 5% FS) | A | 0.35% | 1.0 | 0.35% |
| DUT resolution (4–20 mA) | B | 0.025% | 1.0 | 0.025% |
| Fluid density uncertainty | B | 0.015% | 1.0 | 0.015% |
| Combined Standard Uncertainty (RSS) | 0.354% | |||
| Expanded Uncertainty (k=2, 95% confidence) | ±0.71% |
Notice that DUT repeatability accounts for over 98% of the combined uncertainty at 5% of span. This demonstrates why improving the meter’s low-flow signal-to-noise ratio — through better grounding, flow conditioning, and noise filtering — delivers far more improvement than upgrading the reference standard.
Recording, Reporting, and Regulatory Considerations
Every calibration report must include: the DUT identification (tag, serial number, model), reference standard identification and its calibration certificate number, environmental conditions during the test (temperature, pressure, humidity), as-found and as-left data at each test point, the expanded uncertainty with coverage factor, and a pass/fail determination against stated acceptance criteria. For pharmaceutical applications governed by FDA 21 CFR Part 211, the calibration record must additionally demonstrate that the instrument was within specification (“as-found within tolerance”) or that corrective action was taken and documented if it was not. For custody-transfer meters, API MPMS Chapter 4 defines specific calibration and proving requirements that reference national metrology standards.
9. Maintenance, Recalibration Frequency, and Traceability
Scheduled Maintenance to Preserve Accuracy
Between calibration events, scheduled maintenance prevents the gradual degradation that causes drift. For electromagnetic meters in low-flow service, clean electrodes every 3–6 months using the manufacturer’s recommended procedure (chemical soak, ultrasonic cleaning, or CIP cycle). Inspect grounding connections quarterly — a torque check on grounding ring bolts takes 5 minutes and prevents the single most common source of mag meter calibration failure. For thermal mass flow meters, verify sensor cleanliness monthly if the gas contains particulates or oil mist; a contaminated sensor can read 5–15% low until cleaned. For turbine meters at low flow, replace bearings at the manufacturer’s recommended interval (typically 6–12 months for continuous operation) — worn bearings increase starting torque and cause under-reading at low velocities.
Criteria for Recalibration Intervals Under Low-Flow Conditions
Calibration intervals should be based on demonstrated drift history, not arbitrary calendar schedules. Review the “as-found” errors from the three most recent calibrations. If all three show errors within ±0.15% of reading, the interval can be extended by 25% (e.g., from 12 to 15 months). If any calibration shows as-found errors exceeding ±0.3%, shorten the interval by 25%. For meters operating exclusively at low flow (below 20% of span), reduce the starting interval by 50% compared to the manufacturer’s standard recommendation, because drift effects are amplified in this regime. The following table provides starting-point intervals for common applications:
| Application | Fluid | In-Situ Verification | Full Bench Calibration | Key Risk Factor |
|---|---|---|---|---|
| Pharmaceutical dosing | Purified water, reagents | Every 3–6 months | Every 6–12 months | GMP compliance; batch accuracy |
| Chemical injection (low flow) | Acids, bases, polymers | Every 6 months | Every 12 months | Corrosion; electrode fouling |
| Laboratory R&D | Various | Before each test series | Every 12 months | Changing fluids; wide range |
| Water distribution (low-flow nights) | Potable water | Every 12 months | Every 3–5 years | Revenue assurance; low fouling |
| Slurry/mining (low throughput) | Mineral slurry | Every 1–3 months | Every 6 months | Severe abrasion; electrode coating |
Documenting Traceability and Calibration Certificates
Traceability requires an unbroken chain of documented comparisons linking the meter’s calibration to a national measurement standard. Each link in the chain must include: the identity and calibration status of the reference used, the measured values and associated uncertainties, and the date of calibration. Store calibration certificates in a CMMS (Computerized Maintenance Management System) linked to the meter’s asset record, and configure automatic alerts 30 days before the next calibration due date. When working with flow meter manufacturers, confirm that factory calibration certificates include the reference standard’s identity and traceability chain — not just a pass/fail stamp. Jade Ant Instruments includes full traceability documentation with every meter shipment, referencing the specific gravimetric flow rig and its NIST-traceable calibration status.

10. Practical Troubleshooting and Real-World Case Studies
Common Failure Modes and Diagnostic Steps
When a low-flow meter fails calibration verification, the root cause falls into one of six categories, based on 824 calibration events tracked by Jade Ant Instruments between 2023 and 2025:
Root Causes of Low-Flow Calibration Failures (n=824 meters)
Grounding Faults
32%
Electrode Fouling
26%
Zero-Offset Drift
18%
Cable / Wiring Damage
12%
Coil Degradation
7%
Other
5%
Source: Jade Ant Instruments field-service database, 2023–2025
Diagnostic steps should follow a systematic sequence: (1) Check grounding resistance — must be below 10 Ω from fluid to earth. (2) Measure electrode impedance via the transmitter’s diagnostic menu — healthy values are 1–50 kΩ; values above 100 kΩ indicate coating. (3) Verify zero stability under no-flow conditions — should be ±0.05% of full scale. (4) Inspect signal cables for physical damage, moisture ingress, or improper shielding. (5) Confirm coil drive current matches manufacturer specification (±5%). Each step takes 5–15 minutes and requires only a multimeter, HART communicator, and grounding tester.
Quick Fixes vs. Fundamental Recalibration
Not every failed verification requires a full bench recalibration. Grounding faults (32% of failures) can often be resolved in the field by cleaning and re-torquing grounding ring connections — a 30-minute repair that costs nothing in materials. Zero-offset drift (18%) can be corrected with the transmitter’s auto-zero function in under 5 minutes if the pipe can be isolated. Electrode fouling (26%) may respond to CIP cleaning or manual scrubbing, followed by re-verification. However, if the as-found error exceeds ±1.0% of reading, or if multiple diagnostic parameters are simultaneously out of specification, send the meter for bench calibration — the accumulated degradation likely involves multiple factors that field adjustments cannot fully resolve.
Case Studies Illustrating Improvements After Adopting Best Practices
Case Study 1 — Pharmaceutical Water-for-Injection (WFI) System: A pharmaceutical plant operating DN25 electromagnetic meters at 0.8 L/min (12% of span) on WFI distribution loops experienced recurring batch deviations averaging 3.2% from target concentration. The root cause was a 1.8% zero-offset drift caused by inadequate grounding on PVDF piping. After installing 316L grounding rings, implementing quarterly in-situ verification, and switching to annual bench calibration, the batch deviation dropped to 0.4% — within the ±1.5% acceptance window — and remained stable over 18 months of subsequent monitoring. The total investment was $1,200 per meter (grounding rings + initial calibration); the savings from eliminated batch rejections exceeded $220,000 in the first year.
Case Study 2 — Chemical Dosing in Wastewater Treatment: A municipal wastewater plant was over-dosing polymer by an estimated 15% on a low-flow injection line (2.5 L/min through a meter sized for 50 L/min). Calibration verification revealed a +8.3% as-found error at the operating flow rate — the meter had not been recalibrated since installation 4 years earlier. The polymer line’s small diameter and high-viscosity fluid had caused electrode coating that went undetected because the meter continued to produce “reasonable-looking” readings at mid-range. After electrode cleaning, bench recalibration, and a revised 6-month verification schedule, polymer consumption dropped 14%, saving approximately $31,000 per year in chemical costs.
Case Study 3 — Laboratory Gas Flow for R&D: A research laboratory measuring nitrogen flow at 50 mL/min through a thermal mass flow meter experienced ±6% reading variability that corrupted experimental data. Investigation revealed that the sensor was installed 3 pipe diameters downstream of a 90° elbow — below the 8D minimum straight-run requirement — and that ambient temperature swings of ±5°C in the unconditioned lab were causing 2% baseline drift. Relocating the sensor to 15D downstream, insulating the upstream piping, and implementing pre-test zero verification reduced reading variability to ±0.8%, bringing the laboratory within its target ±1% uncertainty budget.
Watch: Step-by-Step Magnetic Flow Meter Calibration
A detailed walkthrough of magnetic flow meter calibration, including zero adjustment, multi-point verification, and transmitter configuration — directly applicable to low-flow calibration scenarios.
Reliable low-flow calibration is built on three pillars: traceability (every measurement linked through an unbroken chain to national metrology standards), stability (environmental, thermal, and flow conditions controlled tightly enough that the calibration data represents the meter’s true performance, not transient disturbances), and proper measurement practices (multi-point verification, documented uncertainty budgets, and data-driven recalibration intervals rather than arbitrary schedules).
The key steps, distilled into a practitioner’s checklist:
| # | Action | Why It Matters |
|---|---|---|
| 1 | Verify grounding and shielding before calibration | Eliminates the #1 root cause of failure (32%) |
| 2 | Perform zero check under true zero-flow conditions | Zero drift dominates error at low flow |
| 3 | Use a reference standard with ≥4:1 accuracy ratio | Ensures calibration uncertainty doesn’t compromise the result |
| 4 | Calibrate at ≥5 points spanning the actual operating range | Catches nonlinearity invisible to single-point checks |
| 5 | Record 3+ repeat readings at each point | Quantifies repeatability — the dominant uncertainty at low flow |
| 6 | Maintain temperature within ±0.1°C during calibration | Prevents volumetric errors from thermal expansion |
| 7 | Document as-found and as-left data with full uncertainty | Provides audit trail and drift-trending data |
| 8 | Set recalibration interval based on measured drift, not calendar | Optimizes cost vs. risk — avoids both over- and under-calibration |
Whether you are maintaining meters in a water treatment plant, validating instruments in a pharmaceutical clean room, or commissioning a new flow measurement system for a research laboratory, these principles apply universally. The difference between a meter that “reads something” and a meter that delivers trustworthy data at low flow is not the meter itself — it is the calibration program behind it.
For engineering support selecting meters with verified low-flow performance, or for calibration-plan templates tailored to your application, contact Jade Ant Instruments — every meter ships with a multi-point calibration certificate traceable to national metrology standards, including low-flow verification points that most manufacturers omit.

Frequently Asked Questions (FAQs)
What is considered a low-flow range for typical meters, and how is it determined?
Low flow is generally defined as the bottom 10–20% of a meter’s calibrated span — the region where the flow-induced signal approaches the sensor’s detection threshold and the signal-to-noise ratio drops below 10:1. For electromagnetic meters, this typically corresponds to fluid velocities below 0.5 m/s. For turbine meters, it is the velocity at which bearing friction prevents stable rotation. For differential-pressure devices, it is where the ΔP signal falls below the transmitter’s resolution (typically below 5% of the calibrated range). The exact threshold is determined by the meter’s published accuracy specification, which usually shows degraded performance (e.g., ±2–5% of reading) below a stated minimum flow rate. KOBOLD USA’s technical guidance confirms that meters operating near their lower range limit experience reduced flow velocities that directly impair measurement accuracy.
How do I decide between different calibration methods for low flow?
The choice depends on three factors: required uncertainty, fluid type, and practical constraints. For liquid calibration requiring ±0.1% uncertainty or better, gravimetric calibration (weigh tank with precision balance) is the standard. For field verification where ±1–2% is acceptable, a master-meter comparison using a portable Coriolis or ultrasonic reference is practical. For gas flow at low rates, a bell prover or piston-displacement system provides 0.05–0.2% uncertainty. Tracer dilution is best reserved as a cross-check method (1–3% uncertainty) for non-standard geometries. The reference standard must always provide at least 4× better accuracy than the meter being calibrated. For most industrial low-flow applications, Jade Ant Instruments recommends gravimetric bench calibration annually, supplemented by in-situ transmitter verification every 3–6 months.
How often should a low-flow meter be recalibrated in a harsh industrial environment?
Starting-point intervals for harsh environments (corrosive fluids, abrasive slurries, high temperature cycling) are: in-situ verification every 1–3 months, full bench calibration every 6–12 months. Adjust based on drift data — if three consecutive calibrations show as-found errors within ±0.15%, extend the interval by 25%. If any calibration reveals as-found errors exceeding ±0.3%, shorten by 25% and investigate the root cause. Pharmaceutical and custody-transfer applications should maintain the shorter intervals regardless of drift history, due to regulatory requirements under FDA 21 CFR Part 211 and ISO/IEC 17025.
What are common signs that a low-flow meter needs recalibration or maintenance?
Six field indicators should trigger immediate verification: (1) the totalizer volume no longer reconciles with upstream or downstream inventory (discrepancy exceeding 1%), (2) the 4–20 mA output drifts from 4.000 mA under true zero-flow conditions, (3) the transmitter’s electrode-impedance diagnostic has increased more than 50% from the commissioning baseline, (4) a process control loop fed by the meter (e.g., chemical dosing) shows increasing oscillation or persistent offset, (5) physical damage is visible — corroded grounding connections, moisture in the junction box, or cracked cable glands, and (6) the calibration sticker shows the next-due date has passed.
Can I use a portable clamp-on ultrasonic meter as a calibration reference for low-flow verification?
Portable clamp-on ultrasonic meters are useful for gross-error detection and trending, but their typical accuracy of ±1–3% means they rarely satisfy the 4:1 test accuracy ratio required for calibrating meters rated at ±0.5%. Use them as a screening tool — if the clamp-on reading agrees with the installed meter within ±2%, the meter is likely within specification. If the readings diverge by more than 3%, send the meter for bench calibration on a gravimetric or volumetric rig where ±0.05–0.1% uncertainty is achievable. Clamp-on measurements are also sensitive to pipe wall condition, coupling quality, and fluid properties — all factors that degrade further at low flow velocities.
What is the difference between “percent of reading” and “percent of full scale” accuracy, and why does it matter at low flow?
A meter rated ±0.5% of reading maintains a constant relative error across its range — at 100 L/min, the error is ±0.5 L/min; at 10 L/min, the error is ±0.05 L/min. A meter rated ±0.5% of full scale (span = 100 L/min) always has an error of ±0.5 L/min regardless of the actual flow rate — at 10 L/min, that becomes ±5% of the actual reading. At low flow, the difference is enormous. Always specify “percent of reading” accuracy for low-flow applications, or verify the meter’s actual error at your operating flow rate rather than relying on the headline accuracy figure.
How does temperature affect low-flow calibration accuracy?
Temperature affects low-flow calibration through three mechanisms: fluid property changes (density and viscosity shift with temperature, altering volumetric flow calculations and sensor response), sensor drift (electronic zero-offset and gain shift with temperature cycling at rates of 0.01–0.05% per °C), and dimensional changes in the meter body and calibration rig. A 1°C temperature change in water shifts the volumetric flow calculation by approximately 0.02%. At ±0.1% target uncertainty, even a ±2°C ambient swing is significant. Maintain temperature within ±0.1°C during calibration, record inlet and outlet temperatures at 1-second intervals, and apply real-time corrections.
What role does flow conditioning play in low-flow calibration accuracy?
Flow conditioners (tube bundles, perforated plates, or honeycomb straighteners) reshape a distorted velocity profile into a symmetric, fully developed profile before the fluid reaches the meter. At low flow, where signal levels are already weak, even a 2–3% profile distortion from upstream piping can dominate the total error budget. Flow conditioner research shows that a properly installed conditioner can reduce required upstream straight-run from 20D to 8–10D while maintaining profile symmetry within 2%. For calibration rigs, always install a flow conditioner upstream of the DUT to ensure that the calibration data reflects the meter’s intrinsic performance, not the piping layout.
How do I create a measurement uncertainty budget for low-flow calibration?
Follow the GUM methodology in five steps: (1) List all uncertainty sources — reference standard, timing, temperature, DUT repeatability, DUT resolution, and fluid property uncertainty. (2) Classify each as Type A (statistically evaluated from repeat measurements) or Type B (evaluated from calibration certificates, specifications, or engineering judgment). (3) Estimate the standard uncertainty (u) for each source. (4) Combine using root-sum-square (RSS) to obtain the combined standard uncertainty. (5) Multiply by coverage factor k=2 for 95% confidence to get the expanded uncertainty. At low flow, DUT repeatability typically dominates — always measure it with 3+ repeat readings at each test point rather than assuming the manufacturer’s specification applies at the bottom of the range.
What standards govern flow meter calibration for regulatory compliance?
The primary framework is ISO/IEC 17025, which specifies general requirements for calibration laboratory competence. Specific flow-measurement standards include ISO 5167 (differential-pressure devices), ISO 20456 (electromagnetic flowmeters), and ISO 11631 (measurement of fluid flow — methods of specifying flowmeter performance). For custody transfer, OIML R49 (water meters), OIML R117 (dynamic liquid measuring systems), and API MPMS Chapter 4 (proving systems) define calibration and verification requirements. Pharmaceutical applications must additionally comply with FDA 21 CFR Part 211.68 and EU GMP Annex 15 for equipment qualification and calibration.