How to Read and Understand Flowmeter Datasheets

How do you read and understand flowmeter datasheets? You start by identifying the flowmeter type, locating the display format and primary readings, understanding the measurement units, and then cross-referencing the manufacturer’s specifications for accuracy, flow range, and output signals. Once you can decode these core elements, every datasheet becomes a decision-making tool rather than a wall of confusing numbers.
Whether you are a process engineer selecting equipment for a new plant, a maintenance technician troubleshooting an existing installation, or a procurement specialist comparing quotes, understanding flowmeter datasheets is one of the most important skills in industrial instrumentation. Datasheets hold the answers to critical questions: Will this meter work for my fluid? Can it handle my flow range? Is the accuracy sufficient for my application? What output signal does it provide?
Yet despite their importance, datasheets are frequently misread. Engineers confuse “accuracy of reading” with “accuracy of full scale.” Buyers overlook turndown ratios. Technicians misinterpret output signal formats. These mistakes lead to incorrect meter selection, costly rework, and unreliable process data. This article walks you through every section of a typical flowmeter datasheet — from identifying the meter type and display to interpreting calibration data, converting output signals, and avoiding the most common errors. By the end, you will have a practical, confident approach to reading any flowmeter datasheet you encounter.
1. Identifying Flowmeters and Displays
Common Flowmeter Types
Before you can interpret a datasheet, you need to know what kind of flowmeter you are looking at. Each technology operates on a different physical principle, produces different types of output, and has different strengths and limitations — all of which shape how the datasheet is structured and what specifications matter most.
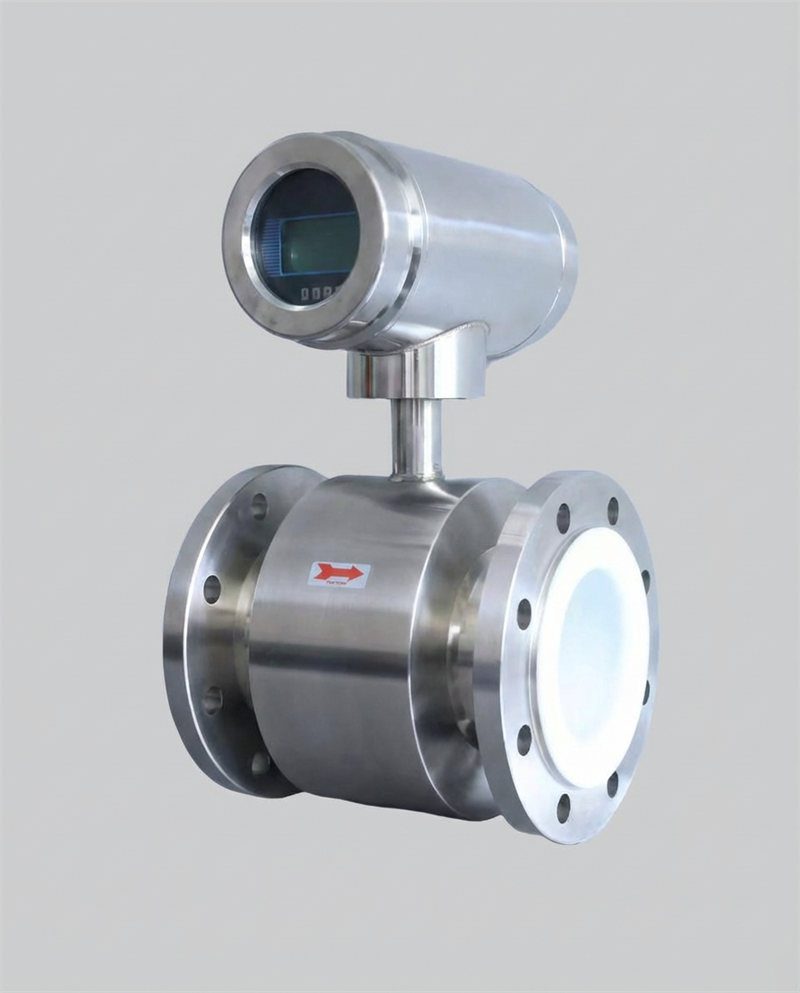
The major flowmeter families you will encounter on datasheets include electromagnetic (mag meters), which use Faraday’s law of induction to measure conductive liquid velocity; ultrasonic meters, which use transit-time or Doppler techniques to measure flow velocity through sound waves; vortex meters, which count the frequency of vortices shed by a bluff body in the flow stream; turbine meters, which measure flow by counting the rotational speed of a rotor; Coriolis meters, which measure mass flow directly through the Coriolis effect on vibrating tubes; differential pressure (DP) meters such as orifice plates and Venturi tubes, which infer flow from the pressure drop across a restriction; variable area meters (rotameters), which use a float rising in a tapered tube to indicate flow; and thermal mass meters, which measure flow based on heat transfer from a heated element. Each type has a distinctly structured datasheet. For example, a electromagnetic flowmeter datasheet will prominently feature electrode and liner material options, minimum conductivity requirements, and grounding specifications — none of which appear on a turbine meter datasheet. A vortex meter datasheet will specify minimum Reynolds number and K-factor data. Understanding the technology first tells you where to focus your attention on the datasheet.

Display Formats and Main Readings
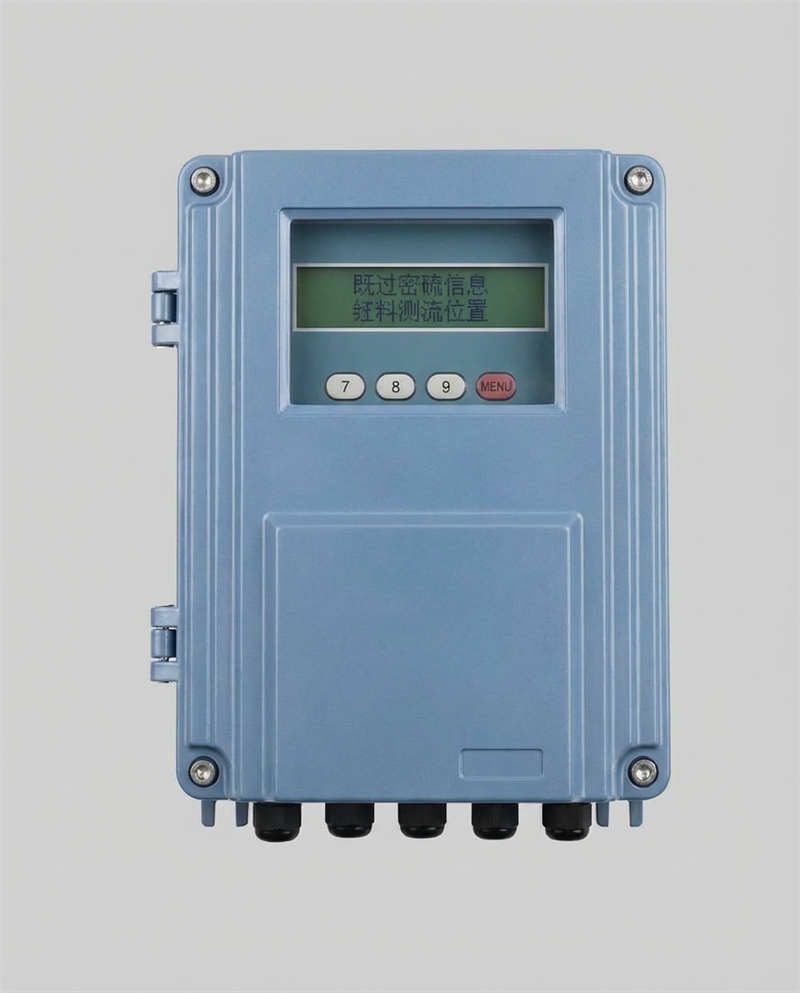
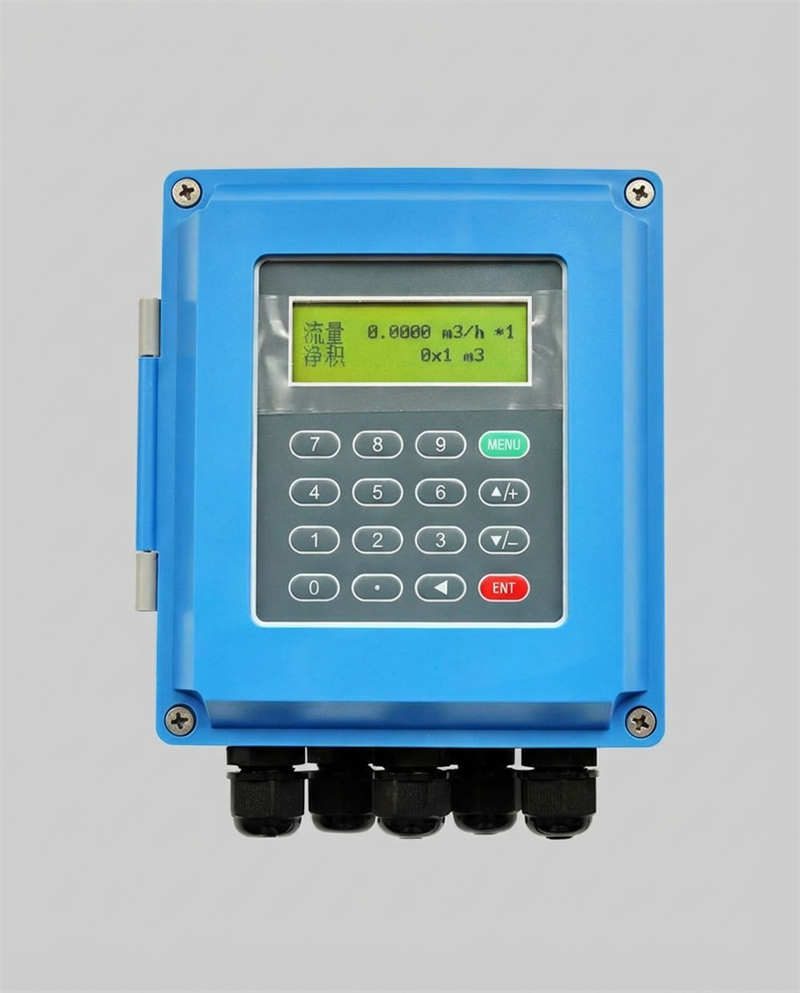
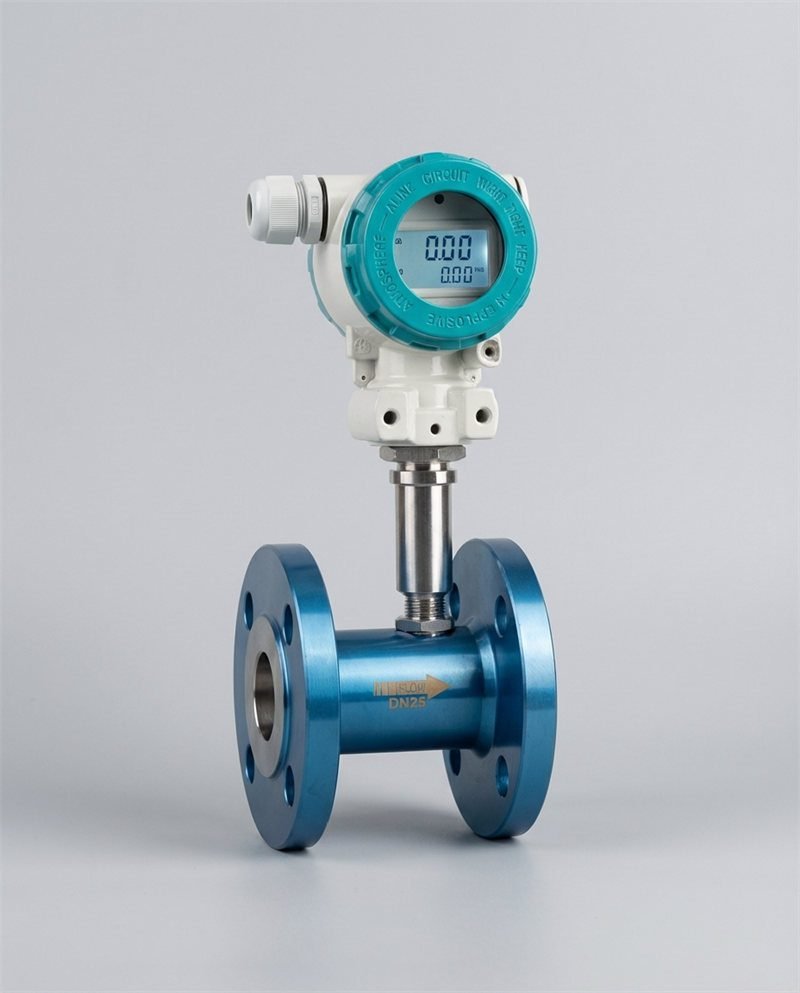
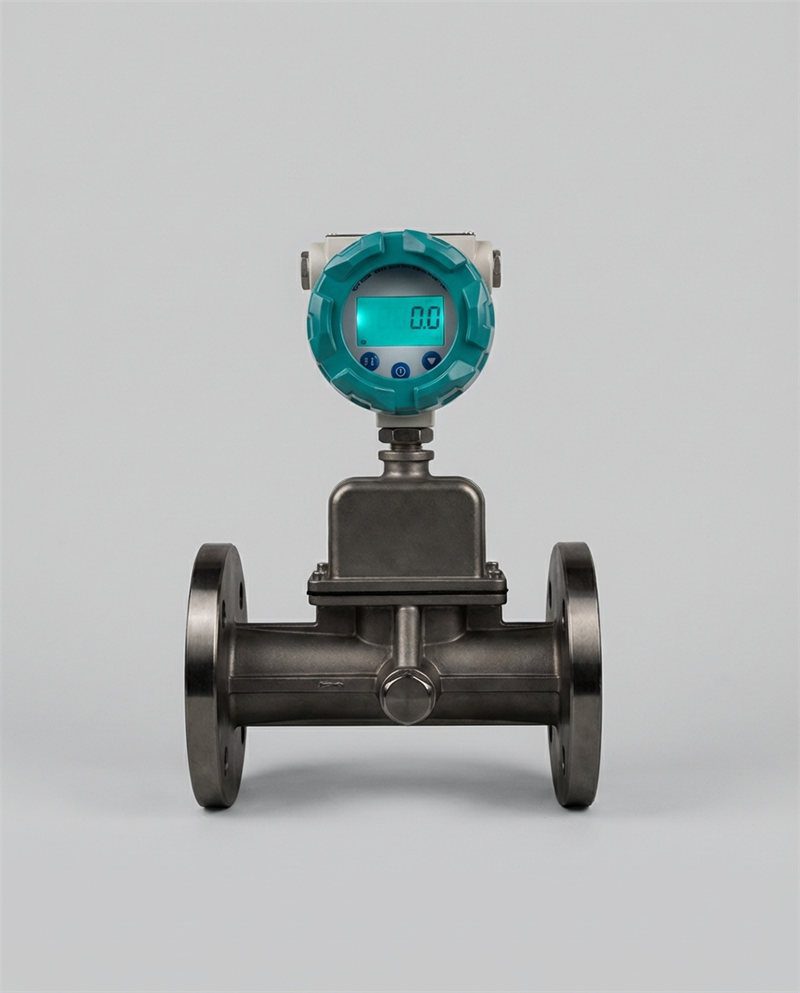
Flowmeter displays present data in several distinct formats, and the datasheet will specify which format(s) the meter supports. The two most fundamental readings are instantaneous flow rate (how much fluid is passing through the meter right now, expressed in units like L/min, m³/h, GPM, or kg/h) and totalized flow (the cumulative volume or mass that has passed through the meter since the last reset, expressed in liters, cubic meters, gallons, or kilograms). Many modern digital flowmeters display both simultaneously — the instantaneous rate on the upper line and the totalizer on the lower line. Some meters also display diagnostic information such as fluid temperature, signal strength, error codes, and percentage of range.
For analog meters like rotameters, the “display” is the physical position of the float against a graduated scale. The datasheet will specify reading conventions — for instance, most rotameters are read at the widest part of the float for spherical floats, or at the top edge for cylindrical floats. Misreading the float position is a surprisingly common source of error, especially when personnel are not trained on the specific meter installed.
Local vs. Remote Displays
Datasheets typically specify whether the meter offers a local display (mounted directly on the meter body), a remote display (connected by cable, allowing the readout to be positioned at a convenient location), or both. Some meters, particularly those from manufacturers like Jade Ant Instruments, offer integral (compact) configurations where the transmitter and display sit directly on the sensor, as well as remote-mount configurations where the transmitter can be installed up to 30–100 meters away — critical for installations in hazardous areas, high-temperature zones, or locations that are physically difficult to access. The datasheet will specify the maximum cable length for remote mounting, which is an important installation constraint that directly affects where you can position your readout and control interface.
2. Understanding Flow Meter Data and Units
Flow Units and Measurement Principles
One of the first things to verify on any flowmeter datasheet is the measurement unit — and more importantly, whether the meter measures volumetric flow or mass flow, because these are fundamentally different quantities that cannot be directly compared without knowing the fluid density.
Volumetric flow measures the volume of fluid passing through per unit of time. Common volumetric units include liters per minute (L/min), cubic meters per hour (m³/h), gallons per minute (GPM), and cubic feet per hour (CFH). Mass flow measures the mass of fluid passing through per unit of time, with common units including kilograms per hour (kg/h), tonnes per hour (t/h), and pounds per hour (lb/h). For liquids at stable conditions, the distinction is often manageable because density stays relatively constant. For gases, however, the distinction is critical — a volumetric reading at operating conditions can differ dramatically from the “standard” or “normal” volume that is used for billing, reporting, or process control. This is why gas flow datasheets often reference “Nm³/h” (normal cubic meters per hour at standard conditions, typically 0°C and 101.325 kPa) or “SCFH” (standard cubic feet per hour at 60°F and 14.696 psia).
Understanding which measurement principle your meter uses helps you anticipate where conversion challenges arise. Electromagnetic and turbine meters measure velocity and compute volumetric flow. Coriolis meters measure mass flow directly. Ultrasonic meters measure velocity (transit-time principle) or Doppler shift. Differential pressure meters infer flow from the square root of pressure drop. The datasheet’s stated accuracy, range, and output are all tied to the native measurement principle.
Common Flow Measurement Units Reference Table
Copy this table into Excel as a quick reference when interpreting flowmeter datasheets. It maps common units to their measurement type and typical applications.
| Unit | Full Name | Measurement Type | Typical Application |
|---|---|---|---|
| L/min | Liters per minute | Volumetric | Water, chemicals (small-medium flows) |
| m³/h | Cubic meters per hour | Volumetric | Water, wastewater, industrial liquids |
| GPM | Gallons per minute (US) | Volumetric | Water, HVAC, fire protection (US) |
| CFH | Cubic feet per hour | Volumetric | Natural gas (US) |
| Nm³/h | Normal cubic meters per hour | Volumetric (at standard conditions) | Gas metering (billing, custody transfer) |
| SCFH | Standard cubic feet per hour | Volumetric (at standard conditions) | Gas metering (US billing, custody transfer) |
| kg/h | Kilograms per hour | Mass | Steam, chemicals, custody transfer |
| t/h | Tonnes per hour | Mass | Large-scale industrial, steam |
| lb/h | Pounds per hour | Mass | Steam, chemicals (US) |
Technical Terms and Abbreviations
Flowmeter datasheets are dense with abbreviations and technical shorthand. Understanding these terms is essential for accurate interpretation. Some of the most frequently encountered terms include: FS (full scale) — the maximum reading on the meter’s range; RD (of reading) — a specification referenced to the actual measured value rather than the full-scale value; DP (differential pressure) — the pressure difference created by a restriction in the flow; K-factor — the calibration constant representing the number of pulses per unit volume, commonly used in turbine and vortex meters; Re (Reynolds number) — a dimensionless number that characterizes flow regime (laminar, transitional, or turbulent); DN (Diamètre Nominal) — the nominal pipe size in metric systems; NPS (Nominal Pipe Size) — the equivalent in imperial systems; IP rating (Ingress Protection) — a two-digit code indicating the enclosure’s resistance to dust and water; HART (Highway Addressable Remote Transducer) — a digital communication protocol layered on top of 4–20 mA analog signals; and Modbus — a serial communication protocol widely used in industrial SCADA systems.
When reviewing datasheets from different manufacturers, pay close attention to how accuracy is expressed. A specification of “±0.5% of reading (RD)” means the error is a percentage of the actual measured value — this specification becomes more favorable at higher flow rates. A specification of “±0.5% of full scale (FS)” means the error is a fixed amount regardless of the actual flow rate — this specification becomes less favorable at low flow rates because the absolute error remains the same while the measured value shrinks. This distinction alone is responsible for many misinterpretations and poor meter-to-meter comparisons.
Estimating Scale Divisions
For analog meters such as rotameters and differential pressure gauges, the datasheet will show the scale range and the number of divisions. When reading these meters in the field, you need to interpolate between scale markings. A practical rule of thumb endorsed by metrology professionals is that you can reliably estimate to one-half of the smallest scale division under normal reading conditions. So if the smallest division represents 2 L/min, you can reasonably estimate to the nearest 1 L/min — but not to 0.1 L/min.
This becomes practically important when assessing whether an analog meter’s resolution is sufficient for your process requirements. If your process needs to distinguish between 10.0 and 10.5 L/min, and the meter’s smallest scale division is 5 L/min, the meter simply cannot provide the resolution you need — regardless of its stated accuracy. The datasheet may not explicitly state this limitation, so understanding scale divisions is part of your interpretation responsibility.
3. Interpreting Manufacturer Datasheets

Accuracy and Calibration
The accuracy specification is arguably the single most scrutinized number on any flowmeter datasheet — and the most frequently misunderstood. As explained by Bronkhorst, flow meter accuracy describes how close the measurement is to the true value, expressed as a percentage. But the devil is in the details.
A manufacturer’s stated accuracy is always conditional. It applies under specific conditions: at certain flow rates, with a particular fluid, at defined temperature and pressure, with correct installation (including straight-run requirements), and often after factory calibration. Field accuracy can degrade if any of these conditions deviate. Furthermore, the accuracy figure on the datasheet typically reflects the performance at calibration — it does not account for drift over time, environmental effects, or installation imperfections.
Repeatability — how consistently the meter reproduces the same reading under identical conditions — is a separate specification that matters enormously for process control applications. A meter with modest accuracy but excellent repeatability can be perfectly suitable for closed-loop control, because the controller responds to changes, not absolute values. Linearity describes how consistently the accuracy holds across the entire flow range. Together, these three specifications — accuracy, repeatability, and linearity — define the meter’s overall measurement capability. As Fuji Electric explains, understanding the relationship between these specifications is fundamental to proper meter comparison.
Calibration data, when provided with the meter, represents the actual measured performance of that specific unit. It is more valuable than the generic datasheet specification because it reflects the individual meter’s behavior. Look for calibration certificates that reference traceable standards — NIST traceability in the United States, or equivalent national metrology institutes elsewhere. Manufacturers like Jade Ant Instruments provide NIST-traceable calibration with their flow meters, giving engineers documented confidence in measurement accuracy from day one.
Flow Range Tables
Flow range tables are the operational heart of the datasheet. They specify, for each meter size (typically referenced by DN or NPS), the minimum flow rate, the nominal (standard) flow rate, the maximum flow rate, and the turndown ratio (rangeability). The turndown ratio — defined as maximum measurable flow divided by minimum measurable flow — tells you how wide the meter’s operating window is. A higher turndown ratio means the meter can handle a broader range of flow conditions while maintaining its stated accuracy.
When reading flow range tables, a critical nuance is that the minimum flow rate is not simply the lowest number the meter can display — it is the lowest flow at which the meter still meets its stated accuracy specification. Below this threshold, the meter may still produce a reading, but the uncertainty expands rapidly and the reading becomes unreliable. This is a frequent source of field problems: engineers assume the meter is “working” because it shows a number, when in reality it is operating well below its specified range.
Turndown Ratio Comparison by Flowmeter Type (Bar Chart Data)
Use this dataset to generate a bar chart in Excel or any visualization tool. Higher turndown ratio indicates a wider measurable flow range.
| Flowmeter Type | Typical Turndown Ratio | Typical Accuracy (± % of Reading) |
|---|---|---|
| Coriolis | 100:1 | 0.1 – 0.5% |
| Electromagnetic | 40:1 | 0.2 – 0.5% |
| Ultrasonic (Multi-path) | 50:1 | 0.5 – 1.0% |
| Vortex | 20:1 | 0.75 – 1.5% |
| Turbine | 10:1 – 100:1 | 0.1 – 0.5% |
| Differential Pressure (Orifice) | 3:1 – 5:1 | 1.0 – 3.0% |
| Positive Displacement | 70:1 | 0.1 – 0.5% |
| Rotameter (Variable Area) | 10:1 | 1.0 – 5.0% |
How to use this data: When comparing meters on datasheets, plot these values side by side. A meter with a turndown ratio of 100:1 can operate accurately across a 100× flow range; one with 5:1 can only cover a 5× range. If your process flow varies significantly (startup, night shift, seasonal changes), turndown ratio directly determines whether one meter can do the job or whether you need parallel installations.
Design Features and Specifications
Beyond the performance specifications, datasheets contain a wealth of design and construction information that affects installation, maintenance, and long-term reliability. Key design specifications include: process connection type (flanged, wafer, threaded, tri-clamp), which must match your piping; body material (carbon steel, stainless steel 304/316L, Hastelloy, PVC), which must be compatible with your fluid and process conditions; liner material (for electromagnetic meters: PTFE, rubber, PFA, ceramic), which determines chemical resistance and temperature limits; electrode material (for electromagnetic meters: 316L stainless, Hastelloy C, Tantalum, Platinum), which must resist corrosion from the measured fluid; enclosure protection rating (IP65, IP67, IP68), which determines suitability for outdoor, washdown, or submersion environments; power supply requirements (24 VDC, 110/220 VAC, battery), which must be available at the installation location; and weight and dimensions, which affect structural support requirements and available installation space.
Each of these specifications should be cross-referenced against your actual process conditions — not the “typical” or “most common” conditions, but the real extremes your system will face. A meter rated for 150°C process temperature will not survive if your CIP cycle hits 160°C. A PTFE liner rated for –40°C may not be appropriate if your fluid drops to –50°C during winter startup. The datasheet provides the boundaries; your engineering judgment determines whether those boundaries contain enough margin for your application.
4. Reading and Converting Flow Meter Data
Analog Output Interpretation
The 4–20 mA analog current loop remains one of the most widely used output signals in industrial flow measurement. Understanding how to interpret this signal is essential for both commissioning and troubleshooting. The principle is straightforward: 4 mA represents zero flow (or the minimum of the configured range), and 20 mA represents the maximum of the configured range (full scale). The relationship is linear, meaning the flow rate at any given current value can be calculated using a simple formula.
The conversion formula is: Flow Rate = ((mA – 4) / 16) × Full Scale Range. For example, if a flowmeter is configured with a 0–100 m³/h range and the output reads 12 mA, the calculation is: ((12 – 4) / 16) × 100 = 50 m³/h. Conversely, to determine what current to expect for a known flow rate: mA = (Flow Rate / Full Scale Range) × 16 + 4. So for 75 m³/h on a 0–100 m³/h range: (75 / 100) × 16 + 4 = 16 mA.
An important diagnostic detail: a reading below 4 mA (often called “under-range” or “fault low”) typically indicates a wiring fault, power supply issue, or sensor failure. A reading above 20 mA (or exactly 20.5–21 mA, depending on configuration) may indicate an over-range condition. Many modern transmitters, including those from Jade Ant Instruments, support NAMUR NE 43 conventions, where specific current levels (≤3.6 mA or ≥21.0 mA) are reserved as diagnostic fault indicators. Knowing these conventions helps you distinguish between a legitimate measurement and an alarm condition.
4–20 mA to Flow Rate Quick Conversion Table
This Excel-ready table provides quick reference conversions for a 4–20 mA signal mapped to a 0–100% range. Multiply the “% of Range” by your meter’s full-scale value to get the actual flow rate.
| Current (mA) | % of Range | Example: 0–100 m³/h | Example: 0–500 GPM |
|---|---|---|---|
| 4.0 | 0% | 0 m³/h | 0 GPM |
| 6.0 | 12.5% | 12.5 m³/h | 62.5 GPM |
| 8.0 | 25% | 25 m³/h | 125 GPM |
| 10.0 | 37.5% | 37.5 m³/h | 187.5 GPM |
| 12.0 | 50% | 50 m³/h | 250 GPM |
| 14.0 | 62.5% | 62.5 m³/h | 312.5 GPM |
| 16.0 | 75% | 75 m³/h | 375 GPM |
| 18.0 | 87.5% | 87.5 m³/h | 437.5 GPM |
| 20.0 | 100% | 100 m³/h | 500 GPM |
Digital and Pulse Output Reading
Pulse outputs represent flow as discrete electrical pulses, where each pulse corresponds to a fixed volume (or mass) of fluid. The datasheet specifies this relationship as the K-factor — the number of pulses per unit volume (e.g., pulses per liter, pulses per gallon). For turbine flowmeters, the K-factor is a fundamental calibration parameter: the turbine blade rotations generate pulses, and the K-factor converts those pulses into volume.
The conversion formula for pulse output is: Volume = Total Pulses / K-factor. And for instantaneous flow rate: Flow Rate = Pulse Frequency (Hz) / K-factor. For example, if a turbine meter has a K-factor of 150 pulses/liter and generates 4,500 pulses, the volume is 4,500 / 150 = 30 liters. If the pulse frequency is 300 Hz, the flow rate is 300 / 150 = 2 liters per second.
Digital protocols such as HART and Modbus transmit flow data as numerical values over a communication bus, eliminating the analog conversion step entirely. HART can superimpose digital data on the 4–20 mA signal without affecting the analog reading — giving you both analog and digital communication on the same pair of wires. Modbus uses dedicated serial or TCP/IP connections to transmit process variables, diagnostic data, configuration parameters, and totalizer values. When evaluating datasheets, check which protocol versions are supported (e.g., Modbus RTU vs. Modbus TCP) and whether the register map is documented — you will need this information for PLC/SCADA integration.
Scaling Factors and Conversion Formulas
In many installations, the raw output signal from the flowmeter must be scaled, converted, or corrected before it represents the actual process value you need. Common scenarios include: converting volumetric flow to mass flow (multiply by density), converting operating-condition volume to standard-condition volume for gases (apply pressure and temperature correction factors), and converting between unit systems (e.g., m³/h to GPM).
The most critical conversion for gas applications is the standard-condition correction. The formula using the ideal gas law approximation is: Q_standard = Q_actual × (P_actual / P_standard) × (T_standard / T_actual), where pressures are absolute and temperatures are in Kelvin or Rankine. For real gases at higher pressures, compressibility factors (Z-factors) must be included. This correction is essential because a cubic meter of gas at 5 bar contains roughly five times the mass of a cubic meter at 1 bar — failing to correct for this leads to massive billing or process errors.
Unit conversion factors that you will use most frequently include: 1 m³/h = 4.403 GPM (US), 1 L/min = 0.2642 GPM (US), 1 kg/h = 2.2046 lb/h, and 1 bar = 14.504 psi. Keeping a reference sheet (like the tables in this article) next to your workstation eliminates calculation errors during commissioning and troubleshooting.
Watch: Understanding Flow Meter Performance Specifications
This video explains how to read and interpret common flow meter performance specifications including accuracy, repeatability, and K-factor:
5. Troubleshooting and Avoiding Errors

Common Misinterpretations
Misinterpreting flowmeter datasheets is more common than most engineers care to admit, and the consequences range from mild inconvenience to catastrophic process failures. Based on field experience from manufacturers, distributors, and end users, the most frequent misinterpretations include the following.
Confusing “% of reading” with “% of full scale” is the most impactful error. A meter specified at ±1% of full scale on a 0–100 GPM range has a fixed error band of ±1 GPM at all flows. At 10 GPM, that is a 10% error. A meter specified at ±1% of reading has an error of ±0.1 GPM at 10 GPM — ten times better at low flow. When comparing two meters’ datasheets, if one uses “% of reading” and the other uses “% of full scale,” a direct numerical comparison is misleading without converting both to the same basis at your actual operating flow rate.
Ignoring conditions of stated accuracy is another frequent mistake. A datasheet might state “±0.5% accuracy” but include a footnote specifying “at calibration conditions, 20°C, clean water, 10D upstream straight run.” If your installation has 3D of straight run, operates at 80°C with a chemical solution, the actual field accuracy will be worse — possibly much worse. Always read the conditions, not just the headline number.
Overlooking the minimum flow threshold leads to unreliable low-flow readings. As explained by Fox Thermal, the applicable flow range is the range within which the accuracy specification holds true. Below this range, the meter may still produce a reading, but it should not be trusted for accurate measurement.
Misunderstanding K-factor variability can compromise totalization accuracy. The K-factor is not perfectly constant across the entire flow range — it varies, especially at the low and high extremes. The datasheet may provide a “linearized” K-factor (average across the range) or a K-factor table at multiple flow points. Using the linearized value when operating predominantly at the range extremes introduces systematic error.
Root Causes of Flowmeter Datasheet Misinterpretation (Pie Chart Data)
Use this dataset to create a pie chart showing the most common reasons engineers misinterpret flowmeter datasheets.
| Root Cause | Estimated Share (%) |
|---|---|
| Confusing “% of reading” vs. “% of full scale” | 28% |
| Ignoring accuracy conditions / footnotes | 22% |
| Operating below minimum specified flow | 18% |
| Misunderstanding K-factor variability | 12% |
| Wrong unit conversion (volumetric vs. mass) | 10% |
| Ignoring installation requirements on datasheet | 10% |
Compatibility and Installation Notes
Every flowmeter datasheet contains installation specifications that directly affect measurement accuracy — yet these are the sections most frequently skimmed or ignored during the specification process. Critical installation details to check include: straight-run requirements (expressed as multiples of pipe diameter, e.g., “10D upstream, 5D downstream”), which are necessary to ensure a fully developed velocity profile; orientation requirements (horizontal, vertical upflow, vertical downflow), which affect air pocket formation and drainage; grounding requirements (especially for electromagnetic meters, where proper grounding is essential for accurate signal detection); minimum and maximum process pressure and temperature (not just nominal — include upset conditions); and pipe material and condition (for clamp-on ultrasonic meters, pipe wall thickness, material, and internal coating significantly affect accuracy).
According to Intek, common flow meter errors frequently stem from installation issues — poor mounting orientation, insufficient straight pipe, or electrical interference. The datasheet gives you the information to prevent these problems; the responsibility to apply that information falls on the installer and the specifying engineer.
Reliable Reading Checklist
To ensure you are interpreting flowmeter datasheets correctly and getting reliable readings in the field, use the following systematic checklist every time you evaluate a new datasheet or commission a new meter:
Step 1 — Identify the meter type and measurement principle. This determines which specifications are most relevant and what installation constraints apply.
Step 2 — Confirm the measurement unit. Verify whether the meter measures volumetric or mass flow, and whether the stated values are at operating conditions or standard conditions.
Step 3 — Read the accuracy specification and its conditions. Note whether it is “% of reading” or “% of full scale,” and read all footnotes defining the conditions under which that accuracy applies.
Step 4 — Check the flow range table. Verify that your actual operating flow window (minimum, normal, and maximum) falls within the meter’s specified range with sufficient margin. Pay special attention to the minimum flow threshold.
Step 5 — Verify output signal compatibility. Confirm that the meter’s output (4–20 mA, pulse, HART, Modbus) is compatible with your receiving instrument (PLC, DCS, data logger, display).
Step 6 — Review installation requirements. Cross-reference straight-run needs, orientation requirements, grounding specifications, and environmental ratings (IP/NEMA) against your actual site conditions.
Step 7 — Confirm material compatibility. Verify that body, liner, electrode, and seal materials are suitable for your fluid chemistry, temperature, and pressure.
Step 8 — Assess calibration and traceability. Review the calibration certificate (if provided) and confirm that calibration conditions are relevant to your application. Note the recommended recalibration interval.
Watch: Flow Meters Explained — Types, Principles, and Readings
This comprehensive video explains different flow meter types, their operating principles, and how to interpret their measurements:
Reading and understanding flowmeter datasheets is a systematic process, not a mysterious art. It begins with identifying the flowmeter type and its measurement principle, which determines the structure and focus of the datasheet. It continues with understanding the measurement units — volumetric versus mass, operating conditions versus standard conditions — so you are comparing like with like. It deepens with interpreting the manufacturer’s specifications: accuracy (and its conditions), repeatability, linearity, flow range, turndown ratio, and calibration data. It becomes practical when you read and convert output signals — whether 4–20 mA analog, pulse outputs with K-factors, or digital protocols like HART and Modbus. And it becomes reliable when you systematically check for common misinterpretations, verify installation requirements, and apply the reading checklist presented in this article.
Every specification on a flowmeter datasheet exists for a reason. The challenge is not that the information is hidden — it is that the information is dense, technical, and conditional. The engineers and technicians who get the best results are the ones who read datasheets methodically, question the conditions behind every specification, and match datasheet parameters to real-world process conditions rather than ideal assumptions.
At Jade Ant Instruments, we design our product datasheets and selection guides to be as transparent and engineer-friendly as possible — with clearly stated accuracy conditions, comprehensive flow range tables, and documented calibration traceability. If you need help interpreting a datasheet, comparing meter options, or validating a specification against your application, our engineering team is available to assist. Because understanding the datasheet is the first step toward getting measurement right.
Use the checklist. Read the footnotes. Question the conditions. And make every datasheet work for you — not against you.
Frequently Asked Questions (FAQ)
1. What is the most important specification on a flowmeter datasheet?
There is no single most important specification — it depends on your application. For custody transfer, accuracy and calibration traceability are paramount. For process control, repeatability and response time matter more. For installations with highly variable flow, turndown ratio is critical. The key is to evaluate specifications as a system, not in isolation. Jade Ant Instruments’ selection guide provides a structured approach to prioritizing specifications based on your specific requirements.
2. What is the difference between “% of reading” and “% of full scale” accuracy?
“% of reading” (% RD) means the error is proportional to the actual measured flow — at 50 GPM with ±1% RD accuracy, the error is ±0.5 GPM. “% of full scale” (% FS) means the error is a fixed proportion of the meter’s maximum range — on a 0–100 GPM meter with ±1% FS accuracy, the error is always ±1 GPM regardless of actual flow. At low flows, “% of reading” specifications provide significantly better accuracy. Always check which basis the datasheet uses before comparing meters from different manufacturers.
3. How do I convert a 4–20 mA signal to a flow rate?
Use the formula: Flow Rate = ((mA – 4) / 16) × Full Scale Range. For example, on a meter with a 0–200 m³/h range, a 12 mA signal equals ((12 – 4) / 16) × 200 = 100 m³/h. Remember that 4 mA = zero flow and 20 mA = full scale. Any reading below approximately 3.6 mA typically indicates a wiring fault or sensor failure per NAMUR NE 43 conventions.
4. What does the K-factor on a flowmeter datasheet mean?
The K-factor is a calibration constant that defines how many electrical pulses the meter produces per unit of fluid volume — for example, 150 pulses per liter. It is most commonly found on turbine and vortex flowmeter datasheets. Volume is calculated as Total Pulses / K-factor, and flow rate as Pulse Frequency (Hz) / K-factor. The K-factor may vary slightly across the flow range, so check whether the datasheet provides a single linearized value or a multi-point K-factor table.
5. Why does the same flowmeter show different readings for the same flow rate?
Inconsistent readings can result from several factors: pulsating flow (common with positive displacement pumps), air entrainment or partially filled pipes, electrical interference (EMI/RFI), insufficient straight pipe upstream, vibration, or operating below the meter’s minimum specified flow rate. The datasheet specifies the conditions under which the meter achieves its stated accuracy — deviating from those conditions causes measurement degradation. Checking installation requirements is the first troubleshooting step.
6. How do I read a rotameter (variable area flowmeter) correctly?
For spherical floats, read at the centerline (widest point) of the float. For cylindrical or cone-shaped floats, read at the top edge of the float. Ensure the rotameter is installed vertically and the fluid flows from bottom to top (unless the datasheet specifies otherwise). The scale is calibrated for a specific fluid at specific conditions — if your fluid differs, you must apply correction factors for density and viscosity, which the manufacturer’s datasheet should document.
7. What does “turndown ratio” mean on a flowmeter datasheet?
Turndown ratio (also called rangeability) is the ratio of the maximum to minimum flow rates that the meter can measure within its stated accuracy. A turndown ratio of 40:1 means if the maximum measurable flow is 400 GPM, the minimum accurately measurable flow is 10 GPM. Higher turndown ratios are advantageous for applications with widely varying flow rates. Coriolis meters typically offer 100:1, electromagnetic meters around 40:1, while orifice plates are limited to about 3:1 to 5:1.
8. How do I know if a flowmeter datasheet accuracy applies to my installation?
Check the accuracy footnotes carefully. They will specify conditions such as calibration fluid, temperature, pressure, straight-run pipe requirements, and flow range. If your installation deviates from these conditions — for example, shorter straight pipe, higher temperature, or different fluid viscosity — the actual field accuracy will be worse than the datasheet states. Contact the manufacturer or distributor for guidance on expected derating under your specific conditions.
9. What is HART protocol and how does it appear on a flowmeter datasheet?
HART (Highway Addressable Remote Transducer) is a digital communication protocol that superimposes digital signals on the standard 4–20 mA analog loop. This means you get both the analog current output and bidirectional digital communication on the same two wires. On a flowmeter datasheet, HART compatibility is listed under “Output” or “Communication” specifications. It enables remote configuration, diagnostics, and access to additional process variables (like temperature or diagnostic codes) beyond what the analog signal alone can provide.
10. Should I trust generic datasheet accuracy or the individual calibration certificate?
The individual calibration certificate is always more valuable because it reflects the actual measured performance of your specific meter, not a generalized specification. The datasheet accuracy represents the overall product family performance under ideal conditions. The calibration certificate shows what your meter actually achieved during testing, at specific flow points, with documented traceability to recognized standards. For critical applications, always request and retain the calibration certificate — it is your baseline for future verification and drift assessment.