Understanding the Science Behind Sound Wave Technology for Precision Liquid Flow Measurement — A Technical Guide for Flow Instrumentation Distributors and Agents
A 1% measurement error on a crude oil transfer line carrying 50,000 barrels per day translates to approximately $35,000 in unaccounted product every 24 hours. That single figure explains why ultrasonic flow meter technology — built on the physics of acoustic wave propagation rather than mechanical contact — has become the dominant growth segment in industrial flow measurement.
This guide is written specifically for flow instrumentation distributors and agents: the technical and commercial professionals who evaluate, recommend, and position flow meters for end-user clients across process industries. It covers the acoustic science that makes ultrasonic measurement work, the two primary measurement methods (transit-time and Doppler), a side-by-side comparison for client decision-making, installation best practices, industry-specific applications, and the business case for adding ultrasonic solutions to your distribution portfolio.
The global ultrasonic flow meter market was valued at USD 2.08 billion in 2025 and is projected to reach USD 3.56 billion by 2034 at a 6.5% CAGR. The growth window is open — and distributors who understand the technology will capture it.
The Evolution of Flow Measurement Technology and Why Ultrasonic Methods Matter
Traditional Flow Measurement Limitations and Market Demand Shifts
Why Invasive Measurement Techniques Are Becoming Obsolete in Modern Industrial Operations
For most of industrial history, measuring liquid flow meant penetrating the pipe. Orifice plates require flanged pressure taps. Turbine meters require spool-piece insertion with bearings and seals in direct contact with the process fluid. Electromagnetic meters need electrodes touching the liquid. Every one of these installations follows an expensive script: isolate the line, drain it, cut it, weld flanges, pressure-test, reinstall — a sequence that routinely consumes 2 to 5 days on a single measurement point in an operating plant.
The costs compound. A process line generating $40,000 per hour of output absorbs $160,000 in production loss during a 4-hour installation window before a single dollar in mechanical contractor labour, pipe work, or commissioning time is added. Add recurring maintenance — turbine bearing replacements every 18–36 months, electrode cleaning, seal degradation — and the total cost of ownership of conventional invasive meters consistently exceeds their initial purchase price by a factor of 3 to 5 over a 10-year operating horizon.
Beyond economics, there are three categories of application where invasive meters are not just expensive but impossible: ultra-pure pharmaceutical water systems where any pipe penetration triggers full revalidation, radioactive fluid circuits in nuclear facilities where penetration creates radiation exposure, and heavily corrosive acid lines where wetted parts dissolve or swell within months. These applications — and they number in the millions of measurement points globally — have no viable invasive solution.
How Non-Invasive Ultrasonic Technology Addresses Critical Customer Pain Points
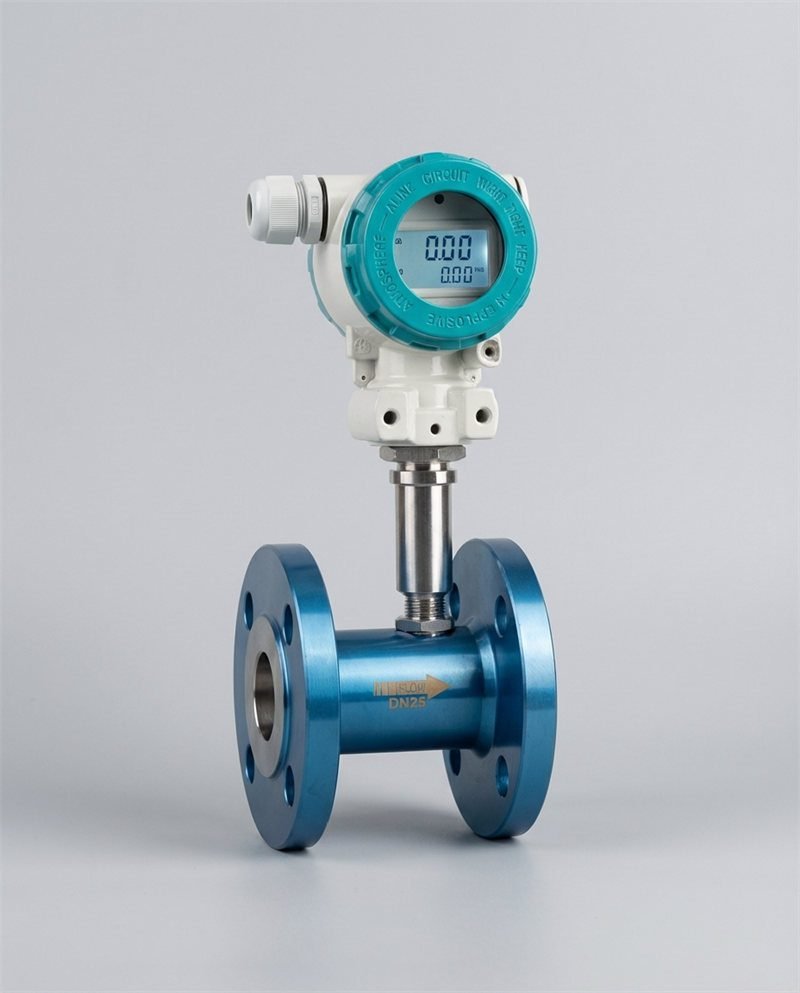
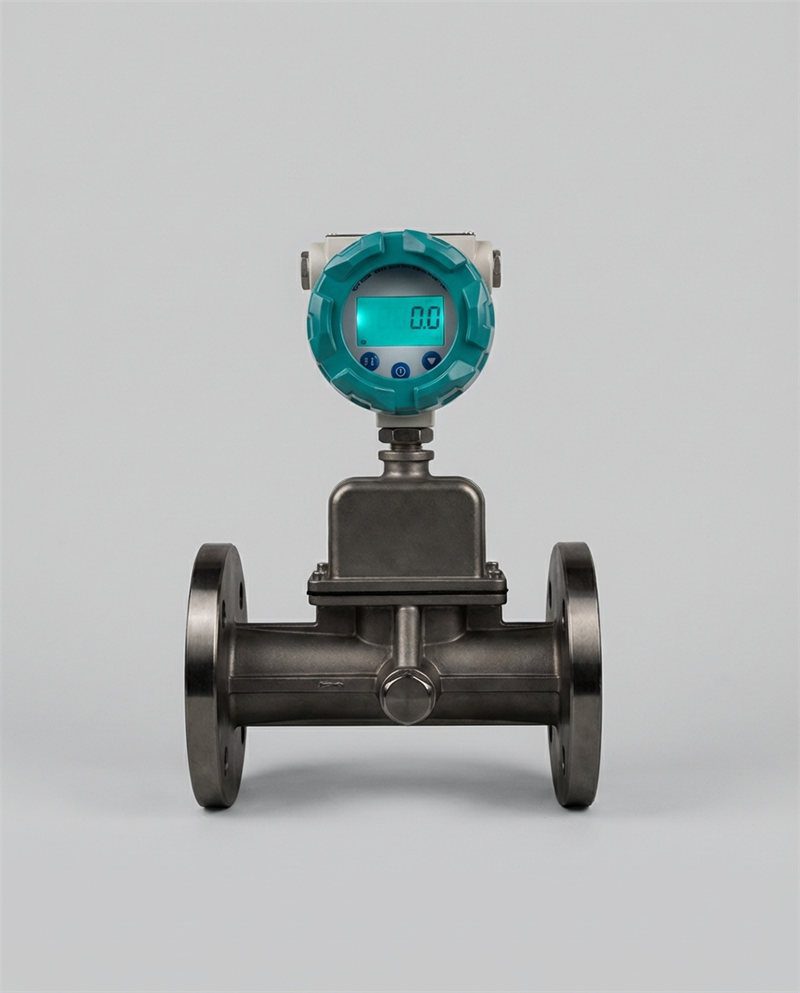
Ultrasonic flow meters resolve all three cost drivers simultaneously. Piezoelectric transducers — devices that convert electrical signals to mechanical vibration — are clamped to the outside of an existing pipe. They transmit acoustic pulses at frequencies of 0.5 to 4 MHz through the pipe wall and into the flowing liquid. By analyzing what happens to those pulses (how long they take to arrive, or how their frequency shifts), the meter calculates fluid velocity without any component contacting the process fluid. No pipe cutting. No welding permits. No process shutdown. Installation time: 90 minutes for a two-person team on a DN200 pipeline.

Clamp-on ultrasonic transducers installed on an industrial pipeline — the complete acoustic measurement path runs through the pipe wall and fluid without any process contact. Installation requires no welding, no process shutdown, and no pipe penetration.
The Business Case for Ultrasonic Flow Meters in B2B Distribution
ROI Advantages for Your Distributorship When Offering Ultrasonic Solutions
For flow instrumentation distributors and agents, ultrasonic meters occupy a uniquely profitable market position. They replace the widest range of competing technologies — mechanical meters on corrosive lines, electromagnetic meters on non-conductive fluids, differential-pressure meters on large-bore pipes — meaning each sale delivers genuine client value rather than a feature-for-feature substitution. The “no shutdown required” selling point is immediately understood by plant managers and operations directors at the C-suite level, shortening approval cycles compared to capital equipment that requires planned maintenance windows.
Clamp-on meters also open entirely new measurement points that customers previously considered too disruptive or too expensive to instrument — creating incremental revenue rather than competing for existing budget allocations. A Southeast Asian petrochemical complex that retrofitted 47 clamp-on meters across 14 process units over 3 weeks with zero production interruptions paid a total project cost of approximately $72,000. The equivalent inline installation was estimated at $290,000–$340,000. The $218,000 saving funded 6 additional monitoring points, an energy management software licence, and 2 years of distributor support contracts.
Market Growth Projections and Customer Demand Trends Through 2025–2030
📊 Ultrasonic Flow Meter Market Size — Key Milestones (USD Billion)
Sources: Fortune Business Insights 2025; Mordor Intelligence 2025. CAGR: 6.5%.
Key demand drivers through 2030 include: mandatory energy sub-metering requirements under ISO 50001 and national carbon accounting regulations, water utility non-revenue water (NRW) reduction programmes requiring district metered area (DMA) monitoring at unprecedented density, chemical plant expansions in Asia-Pacific and the Middle East, and the industrial push toward IoT-connected instrumentation within Industry 4.0 digital transformation programmes. Each of these trends creates structural, recurring demand for ultrasonic meters — not one-time capital replacement cycles.
Fundamentals of Acoustic Technology in Flow Measurement
How Sound Waves Interact with Flowing Liquids
The Physics of Acoustic Propagation in Pipes and Conduits
Sound is a mechanical wave — a pressure disturbance that propagates through matter by compressing and expanding the medium it travels through. In a liquid-filled pipe, an ultrasonic pulse from a piezoelectric transducer on the pipe exterior passes through three distinct media in sequence: the transducer face, the pipe wall, and the liquid itself. Each boundary represents a change in acoustic impedance (the product of material density and the speed of sound in that material). Where impedance changes, part of the acoustic energy is transmitted and part is reflected.
The key design challenge in clamp-on ultrasonic measurement is maximising energy transmission at each of these boundaries. Acoustic couplant — a high-viscosity gel or solid-state pad applied between the transducer face and the pipe surface — eliminates the air gap that would otherwise reflect virtually all the acoustic energy (air has acoustic impedance approximately 3,600 times lower than steel). Once inside the liquid, the acoustic pulse propagates at the speed of sound in the fluid, which is a function of fluid density and compressibility — typically 1,400–1,600 m/s for water at industrial temperatures, 1,100–1,300 m/s for many hydrocarbons, and 200–400 m/s for gases.
Understanding Frequency Ranges and Their Industrial Applications
Ultrasonic meters operate across a frequency range of 0.5 MHz to 4 MHz, and frequency selection is not arbitrary — it is a direct engineering trade-off between penetration depth and sensitivity to particulate content.
Lower frequencies (0.5–1 MHz) produce longer acoustic wavelengths with better penetration through thick pipe walls, heavily attenuating fluids, and pipes with internal scale or coating. They are used for large-diameter pipes (DN400+), crude oil and heavy petroleum products, and pipe materials with high acoustic attenuation (cast iron, thick-wall concrete). Higher frequencies (2–4 MHz) produce shorter wavelengths with greater sensitivity for clean, low-viscosity fluids in thinner-wall pipes. They are used for pharmaceutical water, drinking water, and light chemicals in stainless steel piping. Most clamp-on meter platforms auto-select or offer switchable frequency modes, adapting to the pipe and fluid conditions identified during installation parameter entry.
Key Acoustic Principles Your Customers Need to Understand
Velocity of Sound in Various Liquid Mediums and Temperature Effects
The speed of sound through any liquid increases with temperature — in water, from approximately 1,408 m/s at 0°C to 1,555 m/s at 100°C, a variation of roughly 10% across a common industrial temperature range. An uncorrected transit-time meter would introduce a proportional reading error across this temperature span. All quality ultrasonic meters embed a temperature sensor in the transducer housing and apply continuous algorithmic correction to the transit-time calculation, maintaining specified accuracy across the full operating range.
| Fluid | Temperature (°C) | Speed of Sound (m/s) | Recommended Meter Type |
|---|---|---|---|
| Water (clean) | 20°C | ~1,480 | Transit-Time |
| Water | 80°C | ~1,554 | Transit-Time (temp. compensated) |
| Crude Oil | 20°C | ~1,300–1,450 | Transit-Time (multi-path inline) |
| Diesel / Fuel Oil | 20°C | ~1,250–1,380 | Transit-Time |
| Methanol | 20°C | ~1,103 | Transit-Time |
| Activated Sludge (5% solids) | 15–20°C | ~1,420–1,460 | Doppler |
| Natural Gas (pipeline) | 10–40°C | ~340–440 | Transit-Time (gas-rated) |
Table 1: Speed of sound in common industrial fluids and recommended measurement technology. Temperature compensation is critical when operating temperature varies by more than ±10°C from calibration conditions.
Signal Attenuation and How It Impacts Measurement Accuracy
Signal attenuation — the loss of acoustic energy as the pulse travels through the pipe wall and liquid — is the primary practical constraint on clamp-on measurement. Three mechanisms cause attenuation: absorption (conversion of acoustic energy to heat by fluid viscosity and pipe material damping), scattering (redirection of energy by particles, bubbles, or grain boundaries), and geometric spreading (energy distribution over an increasing wavefront area). The meter’s Signal Quality Index (SQI) — a 0–100% real-time indicator — quantifies the received signal strength relative to the noise floor. An SQI above 60% confirms reliable measurement; below 50% requires investigation of pipe condition, couplant quality, or transducer alignment before commissioning.
Time-Transit Method Explained: The Complete Technical Breakdown

Transit-time measurement: two piezoelectric transducers send opposing acoustic pulses diagonally across the pipe. The tiny time difference (Δt) between the downstream and upstream pulse arrivals — measured in microseconds — is directly proportional to fluid velocity.
▶ Doppler vs. Transit-Time — Let’s Talk Ultrasonic Flow Meters: A concise technical breakdown of both primary measurement methods, ideal for your sales team’s product training. (DwyerOmega Technical Series)
How Time-Transit Technology Measures Flow Velocity
Upstream Versus Downstream Transducer Positioning and Signal Timing
A transit-time meter positions two piezoelectric transducers diagonally on the pipe — one upstream and one downstream of the measurement section. Each transducer alternates between transmitter and receiver mode at high frequency. When a pulse travels downstream (in the same direction as the flowing liquid), the moving fluid carries it along, and it arrives at the downstream transducer slightly faster than it would in stationary fluid. When a pulse travels upstream (against the flow), the fluid opposes it, and travel time increases. The meter measures both travel times with nanosecond precision and calculates the difference: Δt = t_upstream − t_downstream.
This time difference is directly proportional to the average fluid velocity along the acoustic path. Because Δt is typically in the range of 10–100 nanoseconds on a DN100 pipe at typical industrial velocities, the electronics require high-resolution timing circuits — a component category where modern DSP (Digital Signal Processing) technology has transformed what was once a laboratory measurement into a robust field instrument.
Calculating Flow Rate from Transit Time Differential Measurements
The conversion from Δt to volumetric flow rate involves three steps: (1) Calculate acoustic path length L and transducer angle θ from the pipe geometry parameters entered during commissioning. (2) Apply the velocity formula: v = (L² / 2D) × (Δt / (t_up × t_down)), where D is the pipe inner diameter. (3) Multiply the calculated flow velocity by the pipe cross-sectional area to obtain volumetric flow rate (Q = v × A). Multi-path meters perform this calculation on 2 to 8 acoustic chords at different positions across the pipe, average the results, and apply velocity profile correction to account for non-ideal flow conditions — producing accuracy of 0.15–0.5% in properly calibrated inline configurations.
Real-World Applications Where Time-Transit Excels
High-Accuracy Applications in Custody Transfer and Billing Scenarios
Custody transfer — the commercial handover of liquid or gas between trading parties — demands the highest measurement accuracy available because every 0.1% error translates directly to financial reconciliation disputes. A natural gas distribution hub transferring 500,000 m³/day at a commodity price of $0.30/m³ experiences $150,000/day exposure from a 0.1% metering error. Multi-path inline transit-time meters certified to AGA Report No. 9 (gas) or API MPMS Chapter 5.8 (liquid hydrocarbons) deliver the ±0.25–0.5% accuracy with NIST-traceable calibration that custody transfer authorities require. These are specifications that mechanical meters cannot consistently achieve without more frequent and expensive recalibration.
Performance Advantages in Clean Liquid Applications and Chemical Processing
For clean liquids — drinking water, pharmaceutical-grade water, light hydrocarbons, and single-phase chemicals — transit-time meters deliver their best performance. Clamp-on single-path configurations achieve 1.0–2.0% accuracy; dual-path configurations reach 0.5–1.0%; and inline multi-path spool pieces hit 0.15–0.5%. In chemical processing, where a DN150 carbon steel pipe may carry 30% hydrochloric acid at 60°C, a clamp-on transit-time meter measures through the pipe wall while the sensors see only ambient air — eliminating the wetted-parts corrosion failures that cost $15,000–$80,000 per incident in a typical specialty chemical facility. The Jade Ant Instruments application data across chemical deployments shows lifetime maintenance cost advantages of clamp-on versus conventional wetted meters exceeding 40% over a 7-year horizon.
Installation Requirements and Best Practices for Maximum Accuracy
Pipe Diameter Specifications and Transducer Placement Guidelines
Transit-time clamp-on meters cover pipe diameters from DN25 to DN6000 using interchangeable transducer sets matched to pipe size and frequency requirements. The critical installation variable is straight pipe run: the undisturbed flow profile that transit-time meters assume in their velocity calculations. Standard requirement: 10× pipe diameter (10D) upstream of the measurement point, and 5D downstream, measured from the nearest flow disturbance — elbow, valve, reducer, pump, or tee. Installations with shorter straight runs can use dual-path configurations (which average across a wider velocity profile and self-correct for mild distortion) or V-mode transducer placement (where both transducers mount on the same pipe side, with the pulse reflecting off the far pipe wall — increasing the acoustic path length and improving accuracy in short-run installations).
Handling Edge Cases: Viscous Liquids, Aerated Fluids, and Suspended Solids
Transit-time meters are specified for clean liquids, but real industrial fluids are rarely perfectly clean. The practical boundaries: viscosity up to approximately 500 cSt (centistokes) is manageable with lower-frequency transducers and increased signal averaging; viscosity above 500–1,000 cSt (heavy fuel oil, glycols, concentrated polymer solutions) attenuates the signal to the point where Doppler or alternative technology is required. Entrained air bubbles at concentrations above 1–2% by volume scatter the acoustic signal and degrade transit-time measurement; below 0.5% bubble content, most quality meters maintain specified accuracy. Suspended solids below approximately 50–75 mg/L at particle sizes under 50 microns are generally transparent to the acoustic signal at megahertz frequencies and do not impair transit-time measurement.
Doppler Shift Method Explained: Technology and Practical Implementation
The Doppler Effect and Its Application in Flow Measurement
Frequency Shift Principles When Sound Reflects off Moving Particles
The Doppler effect — the same physical phenomenon that makes a passing ambulance siren shift in pitch — describes the change in perceived frequency of a wave when the source or reflector is in motion relative to the observer. In a Doppler ultrasonic flow meter, a continuous-wave acoustic signal is transmitted into the fluid at a fixed frequency (typically 0.5–2 MHz). When this signal strikes a particle, bubble, or phase boundary moving with the fluid, the reflected signal returns at a slightly different frequency. The magnitude of this frequency shift (Δf) is directly proportional to the velocity of the reflector — and therefore the velocity of the fluid carrying it.
The relationship is expressed as: Δf = 2 × f₀ × v × cos(θ) / c, where f₀ is the transmitted frequency, v is the fluid velocity, θ is the angle between the acoustic beam and the flow axis, and c is the speed of sound in the fluid. A meter operating at 1 MHz measuring water at 2 m/s with a 45° transducer angle produces a Doppler shift of approximately 1,900 Hz — a frequency difference easily resolved by modern electronics to a precision of a few Hz, corresponding to velocity resolution better than 0.01 m/s.
Why Doppler Works Best with Particle-Laden and Aerated Liquids
Doppler measurement requires reflectors — particles or bubbles — to return a measurable frequency-shifted signal. This is the precise condition that disqualifies the technology for clean fluids (no reflectors = no signal) but makes it purpose-built for contaminated fluids. The minimum reflector requirement is typically 75–100 mg/L of suspended solids at particle sizes above 75 microns, or 100–200 mg/L of entrained gas bubbles. Wastewater treatment plants, mining slurry pipelines, pulp-and-paper stock systems, and activated sludge recirculation loops all comfortably exceed these minimum reflector concentrations — providing the Doppler meter with abundant, consistent reflectors for stable measurement.

Doppler clamp-on meters thrive in conditions that defeat transit-time technology — particle-laden wastewater, activated sludge, and mining slurries all provide the consistent reflector population required for stable frequency-shift measurement. The meter attaches to the pipe exterior with no process contact.
Real-World Applications Where Doppler Shift Delivers Results
Wastewater Treatment and Sewage Flow Monitoring
Wastewater treatment plants represent the single largest application segment for Doppler ultrasonic meters. Influent sewage, activated sludge in biological reactors, return activated sludge (RAS) recirculation, and digested sludge transfer lines all carry the particle loading (typically 2,000–30,000 mg/L total suspended solids) that Doppler meters require. A typical municipal treatment plant serving 200,000 population equivalent has 15–30 flow measurement points in sludge service — each requiring a meter that handles solids without internal fouling, clogging, or abrasive wear. Clamp-on Doppler meters on DN100–DN300 sludge lines at a major European water authority showed zero maintenance interventions over a 5-year monitoring period, while the electromagnetic meters they replaced required electrode replacement or cleaning every 8–14 months at a service cost of €800–1,500 per event.
Slurry Applications, Mining Operations, and Pulp-and-Paper Industries
Mining slurry lines carrying 15–45% solids by weight represent the most demanding application for any flow meter technology. Magnetite, copper concentrate, iron ore, and coal slurries are simultaneously highly abrasive, corrosive, and dense — conditions that destroy mechanical meters within months and challenge even the most robust inline instruments. Clamp-on Doppler meters installed on the outside of the pipe survive the full service life of the pipeline itself, typically 10–15 years, with zero internal component exposure. In pulp-and-paper mills, stock consistency of 2–5% (cellulose fibre suspended in water) provides ideal Doppler reflectors; the measurement is used for headbox feed control — a critical parameter where a 1% flow inaccuracy directly affects paper basis weight consistency and product reject rates.
Installation Considerations and Accuracy Factors
Particle Size Requirements and Reflective Surface Optimization
Doppler meter performance is sensitive to the particle size distribution in the fluid. Particles smaller than one acoustic wavelength (approximately 0.5–1.5 mm at 1 MHz) produce weak backscatter; particles larger than the wavelength produce stronger, more consistent reflections. In borderline applications — lightly contaminated process water with 50–150 mg/L fine particulate — a field test with a portable Doppler meter before specifying permanent equipment confirms whether reflector content is sufficient for reliable measurement. The meter’s received signal strength display provides this confirmation within minutes of setup.
Temperature Compensation and Signal Strength Management
The Doppler frequency shift calculation requires accurate knowledge of the speed of sound in the fluid (parameter c in the Δf equation). Because sound speed varies with temperature, Doppler meters incorporate the same temperature compensation mechanisms as transit-time meters — embedded temperature sensors and continuous algorithmic correction. Signal strength management in Doppler applications focuses on transducer positioning: mounting on the pipe bottom (where settled solids concentrate) or at 45° from the pipe axis (maximising the Doppler angle for highest frequency shift per unit velocity) both improve SNR (signal-to-noise ratio) in borderline applications.
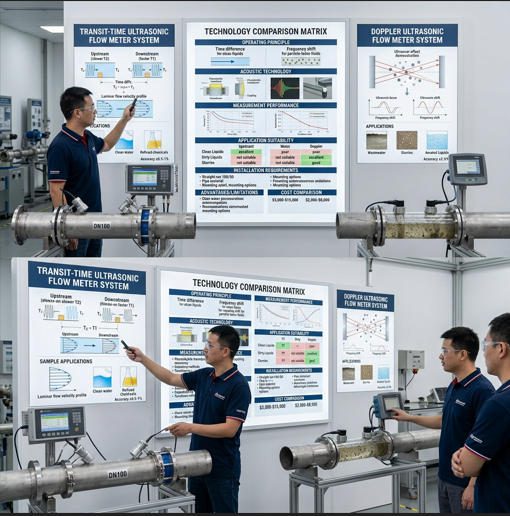
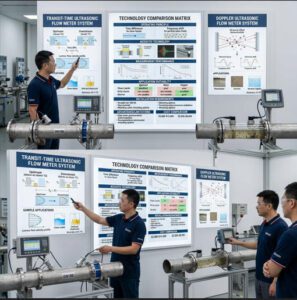
Time-Transit vs. Doppler: Direct Comparison for Client Decision-Making
⚡ Transit-Time (Time-of-Flight)
- Best for: clean liquids, water, light chemicals, hydrocarbons
- Accuracy: ±0.5%–2.0% (clamp-on); ±0.15%–0.5% (multi-path inline)
- Minimum fluid requirement: particle-free, acoustically transparent
- Pipe diameters: DN25–DN6000
- Bidirectional: yes, inherently
- Custody transfer: yes (multi-path inline, AGA-9/API 5.8)
🌊 Doppler Shift
- Best for: wastewater, slurries, aerated liquids, sludge
- Accuracy: ±2%–5% (typical field performance)
- Minimum fluid requirement: ≥75 mg/L reflectors (particles or bubbles)
- Pipe diameters: DN25–DN3000
- Bidirectional: yes
- Custody transfer: not applicable (accuracy class)
Technical Performance Metrics Side-by-Side
Accuracy Ranges, Repeatability, and Uncertainty Specifications
| Parâmetro | Transit-Time (Clamp-On) | Transit-Time (Inline Multi-Path) | Doppler (Clamp-On) |
|---|---|---|---|
| Accuracy (% of reading) | ±1.0%–2.0% (single-path) ±0.5%–1.0% (dual-path) |
±0.15%–0.5% | ±2%–5% |
| Repeatability | Better than ±0.3% | Better than ±0.1% | Better than ±1.0% |
| Turndown Ratio | 100:1 to 150:1 | 300:1 to 400:1 | 50:1 to 100:1 |
| Update Rate | Up to 10 Hz | Up to 10 Hz | 1–5 Hz (typical) |
| Zero-Flow Detection | ✔ Yes | ✔ Yes | ⚠ Limited |
| Bidirectional Flow | ✔ Yes | ✔ Yes | ✔ Yes |
| Custody Transfer Certified | ✗ No | ✔ Yes (AGA-9 / API 5.8) | ✗ No |
| Clean Liquid Performance | ✔ Excellent | ✔ Best-in-class | ✗ Not suitable |
| Dirty / Slurry Liquid | ✗ Not suitable | ✗ Not suitable | ✔ Purpose-built |
| Process Shutdown for Install | ✔ None required | ✗ Required | ✔ None required |
Table 2: Transit-time vs. Doppler technical performance comparison. For detailed application selection guidance, see the Jade Ant Instruments clamp-on vs. transit-time comparison guide.
Response Time and Real-Time Measurement Capabilities
Transit-time meters sample the acoustic signal at 20–200 MHz and update the flow reading at up to 10 times per second — fast enough for most process monitoring, energy metering, and SCADA data logging applications. Doppler meters, due to the continuous-wave nature of the measurement and the inherent variability in particle reflector populations, typically update at 1–5 Hz with configurable averaging windows of 1–60 seconds. For batch control applications requiring sub-second response (valve actuation, dosing control), transit-time inline meters are the appropriate choice. For trend monitoring and daily totalization in wastewater, slurry, and mining applications, Doppler’s 1–5 Hz response is entirely adequate.
Cost Considerations and Total Cost of Ownership Analysis
Equipment Pricing Structures and Installation Complexity
📊 10-Year Total Cost of Ownership Breakdown — Clamp-On Ultrasonic vs. Turbine Meter (DN100 Process Line, Illustrative USD)
Illustrative 10-year TCO. Turbine includes 4–5 maintenance events at $1,800–$3,000 each plus bearing/seal replacement. Clamp-on includes couplant inspection only. Compiled from industry TCO studies and Jade Ant Instruments TCO analysis.
Maintenance Requirements and Long-Term Operational Costs
The maintenance arithmetic for clamp-on versus mechanical meters is unambiguous. A turbine meter on a diesel transfer line has bearings that wear, rotors that foul, and seals that must be replaced — typically every 18–36 months at a cost of $800–$2,500 per maintenance event. Over 10 years: 4–6 maintenance events plus potential 1–2 unplanned failures. Total maintenance cost: $6,000–$18,000 per meter. A clamp-on transit-time meter on the same line has no wearing parts, no process contact, and one maintenance activity — couplant inspection and replacement every 2–3 years, taking 30 minutes and costing under $50 in materials. Ten-year maintenance cost: approximately $200. This is not a marginal advantage; it is a structural difference in total cost of ownership that compounds over every year of operation.
Liquid Type Compatibility Matrix
Clean Liquids, Partially Contaminated Fluids, and Heavily Laden Slurries
| Fluid Type | Suspended Solids / Condition | Tecnologia recomendada | Precisão típica | Notes |
|---|---|---|---|---|
| Drinking water, RO/DI water | <10 mg/L | Transit-Time | ±0.5%–1.5% | Ideal application |
| Chilled / hot water (HVAC) | <

 Blog
How Ultrasonic Flow Meters Use Acoustic TechnologyUnderstanding the Science Behind Sound Wave Technology for Precision Liquid Flow Measurement — A Technical Guide for Flow Instrumentation Distributors and Agents A 1% measurement  Blog
Electromagnetic Flow Meters: The Physics DecodedB2B Technical Deep-Dive · Electromagnetic Flow Meters The Physics Behind the Flow:How Electromagnetic Induction PowersAccurate Liquid Measurement Understand the Faraday induction principle and discover why  Blog
Thermal vs. Coriolis vs. Vortex: Calibration DecodedB2B Distributor Guide · Mass Flow Meters Thermal vs. Coriolis vs. Vortex:Calibration Requirements Decoded A comprehensive guide for flow instrumentation distributors and agents to understand  Blog
Clamp-On Flow Meters: The Non-Invasive Revolution GuideThe clamp-on ultrasonic flow meter market reached USD 3.8 billion in 2025 and is forecast to hit USD 6.2 billion by 2033 at a 7.2%  Blog
How Ultrasonic Flow Meters Work: Transit-Time & DopplerThe global ultrasonic flow meter market reached USD 2.08 billion in 2025 and is forecast to hit USD 3.56 billion by 2034 — not because  Blog
Clamp-On vs. Inline Ultrasonic Flow Meters: Full GuideA 1% measurement error on a crude oil transfer line carrying 50,000 barrels per day translates to roughly $35,000 in unaccounted product every 24 hours.   |