Two instruments. Two data streams. One complete picture of how your building consumes — and wastes — energy. Here is exactly what each tool measures, why it matters, and how to use both together for measurable results.
Buildings account for roughly 30% of global final energy consumption, according to the IEA’s 2025 Energy Efficiency report. Yet facility managers and engineers at industrial plants, commercial campuses, and institutional complexes routinely discover that a significant share of that energy spend is invisible — not because meters don’t exist, but because the wrong metrics are being captured. A thermal mass meter and an indoor temperature sensor are both standard tools in modern building monitoring, yet they answer fundamentally different questions. Confusing the two — or deploying only one — leaves major performance gaps in your data and costly blind spots in your energy management strategy.
This article is written for facility engineers, building automation specifiers, energy managers, and HVAC commissioning professionals who need a precise, working-level understanding of both instruments: what they measure, where each one earns its keep, and what a combined monitoring strategy looks like in practice.
Core Terminology at a Glance
Before diving into instrument specifics, the following terms appear frequently throughout this article. Each is defined here on first use and referenced consistently throughout.
- Thermal Mass Meter (TMM)
- An instrument — typically a thermal mass flow meter — that measures the mass flow rate of a gas (e.g., compressed air, natural gas, boiler combustion air) by quantifying heat transferred from a heated sensor element to the flowing gas stream. It reports in kg/h, SCFM, or Nm³/h, independent of pressure and temperature fluctuations.
- Indoor Temperature Sensor (ITS)
- A device — thermistor, RTD, or wireless node — that measures ambient or surface air temperature within a building zone. It reports in °C or °F and is the primary input for thermostat setpoints, HVAC control loops, and occupant comfort assessments.
- Thermal Inertia
- The tendency of a building’s structural mass (concrete floors, masonry walls, etc.) to resist rapid temperature changes. High thermal inertia absorbs heat during peak periods and releases it slowly — creating a measurable time-lag between external conditions and interior temperatures.
- Heat Flux
- The rate of heat energy transfer per unit area through a building element (W/m²). Monitoring heat flux reveals the actual thermal performance of walls, glazing, and insulation under real operating conditions.
- BMS / Building Management System
- A centralized control platform (communicating via BACnet, Modbus, or KNX protocols) that aggregates sensor data to automate HVAC, lighting, and access systems across a facility.
- U-value
- A measure of thermal transmittance — how readily a building element conducts heat (W/m²K). A lower U-value means better insulation. Calculated from measured heat flux data.
What Is a Thermal Mass Meter and What Does It Measure?
Core Concept of Thermal Mass in Buildings
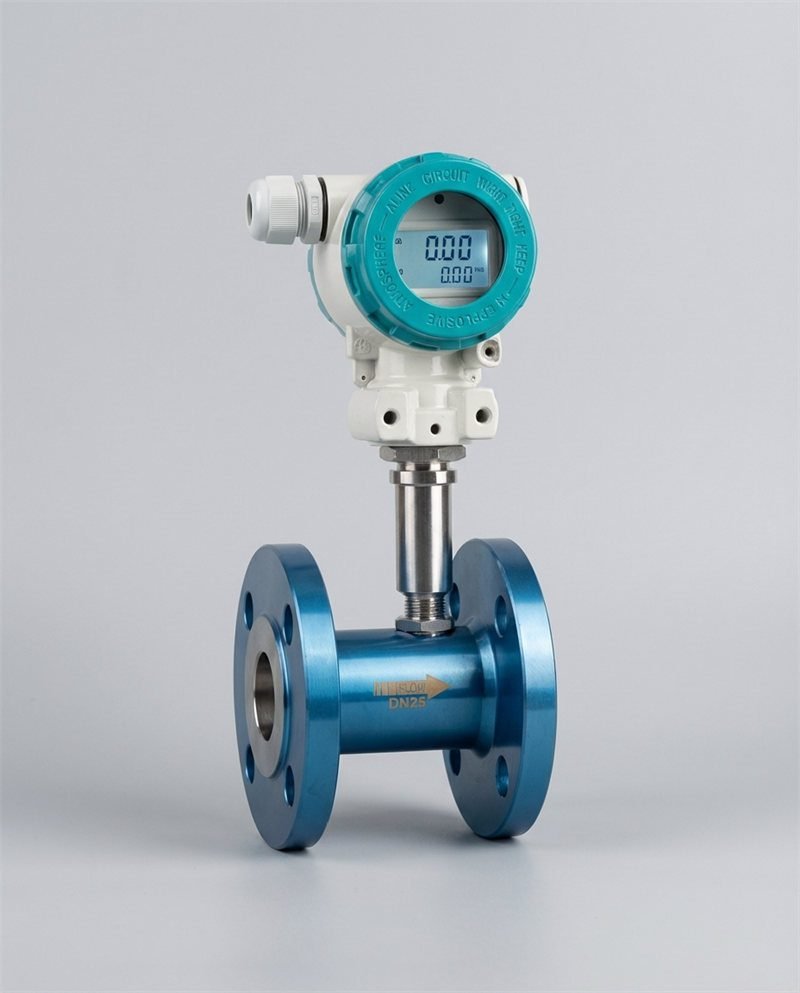
In the context of building energy systems, the term “thermal mass meter” most commonly refers to a thermal mass flow meter (TMFM) — an instrument that exploits the relationship between heat transfer and gas flow rate to measure exactly how much gas (by mass) is moving through a pipe or duct at any given moment. This is distinct from the architectural concept of “thermal mass,” which describes a material’s capacity to absorb and store heat energy.
The operating principle is elegant: the instrument heats a probe element and measures either the power required to maintain a constant temperature (constant-temperature anemometry, also called constant-temperature differential method) or the temperature rise at a downstream sensor caused by the flowing gas carrying heat away (constant-power method). Because the heat transfer is directly proportional to the mass flow rate of the gas, the instrument produces a true mass flow reading — without needing separate pressure or temperature correction inputs. This is a critical advantage in building HVAC applications, where duct pressures and air temperatures vary continuously.

Typical Data Points Captured
A correctly specified thermal mass flow meter in a building application simultaneously captures several high-value data points that volumetric meters simply cannot provide without additional correction:
- Instantaneous mass flow rate — the real-time gas throughput in standardized units (Nm³/h or SCFM at reference conditions)
- Cumulative consumption totalizer — a non-resettable register of total gas mass consumed, essential for ISO 50001 sub-metering and energy cost allocation
- Process gas temperature — most dual-sensor designs report the gas temperature at the measurement point
- Heat flux proxy data — in specialized envelope-monitoring configurations, heat flux sensors embedded in walls measure W/m² to calculate real in-situ U-values of the building envelope
- Phase-change indicators — in steam or refrigerant circuits, mass flow data combined with enthalpy tables enables calculation of latent heat transfer
This concise video from Simple Science covers the working principle, construction, and selection criteria for thermal mass flow meters — a useful reference for teams new to the technology.
Advantages and Limitations
The key advantage is direct mass measurement: there is no dependence on Boyle’s Law corrections or temperature compensation algorithms that introduce uncertainty. For compressed-air auditing — where the U.S. Department of Energy estimates that 20–30% of industrial compressor output is lost to undetected leaks — this accuracy translates directly into quantifiable savings. One manufacturing plant study documented cost recovery of nearly $70,000 per year after identifying just ten ¼-inch leaks using thermal mass flow data.
The primary limitation is scope: a thermal mass flow meter tells you how much gas is flowing through a pipe, but it does not tell you anything about the air temperature inside a room, or whether the occupants on the second floor are comfortable. That is where indoor temperature sensors take over.
What Indoor Temperature Sensors Monitor and How They Differ
Common Sensor Types
The industrial and commercial building market offers several distinct temperature sensing technologies, each with practical trade-offs that matter at the system design level:
| Sensor Type | Operating Principle | Precisão típica | Tempo de resposta | Best-Fit Application | Relative Cost |
|---|---|---|---|---|---|
| NTC Thermistor | Resistance decreases nonlinearly with rising temperature (negative temperature coefficient) | ±0.1 – 0.5 °C | Very fast (1–5 s) | Zone room temperature sensing, HVAC control loops | Baixa |
| RTD (PT100 / PT1000) | Resistance increases linearly with temperature (platinum wire or film) | ±0.1 – 0.3 °C (Class A) | Moderate (5–15 s) | Duct averaging sensors, supply/return air measurement, precision monitoring | Medium |
| TI-Core / Thermocouple | Seebeck effect: two dissimilar metals generate a voltage proportional to temperature difference | ±0.5 – 2.0 °C (Type K) | Fast (≤1 s) | High-temperature duct probes, boiler flue sensing (not standard room sensing) | Baixa |
| Wireless IoT Node (NTC/RTD based) | Battery-powered transmitter with integrated temperature sensor; LoRaWAN, Zigbee, or BLE communication | ±0.3 – 0.6 °C | Fast (configurable polling) | Retrofit buildings without cable runs, multi-zone mapping, remote areas | Medium–High |
| Combined Temp / RH Sensor | Capacitive polymer for humidity, NTC or RTD for temperature | ±0.3 °C / ±2% RH | Moderado | Comfort monitoring (PMV/PPD indices), IAQ compliance (ASHRAE 55) | Medium |
What Data Is Recorded
Indoor temperature sensors capture information across three primary layers of building thermal performance:
Ambient air temperature is the baseline metric — the dry-bulb temperature at sensor height in a given zone. This is the number that feeds HVAC control setpoints, occupancy-based scheduling, and energy modeling validation. A well-placed sensor in an occupied zone directly represents the thermal experience of the people in that space.
Surface temperature probes measure the temperature of walls, floors, or ceilings rather than the air — a critical distinction in radiant heating and cooling systems, where mean radiant temperature (MRT) is a dominant comfort driver independent of air temperature. In a radiant-floor-heated warehouse, for example, the floor surface might be 28°C while the air temperature at head height reads only 18°C; a single-point air sensor misses this entirely.
Relative humidity when integrated into a combined sensor node provides the data needed to compute the dew point, the wet-bulb temperature, and psychrometric comfort indices. For pharmaceutical GMP environments, food processing facilities, and data centers, RH monitoring is as critical as temperature monitoring — and typically subject to the same calibration intervals.
Advantages and Limitations
The core advantage of indoor temperature sensors is density and cost: you can instrument an entire multi-floor building with dozens or hundreds of nodes for a fraction of the cost of a full flow meter network. The limitation is that a temperature sensor only reports a condition — it does not explain the cause. A zone reading 24°C when the setpoint is 21°C could indicate an undersized cooling coil, an air-handling unit running below design airflow, excessive solar gain through glazing, or a process heat load from equipment — and without flow data from a thermal mass meter upstream, you cannot distinguish between these root causes from temperature data alone.
Key Metrics to Monitor with a Thermal Mass Meter
Thermal Inertia and Heat Transfer Rates
When thermal mass flow meters are installed on combustion-air ducts supplying boilers or air-handling units, the heat transfer rate data they generate can be correlated with ambient and indoor temperature logs to compute the effective thermal inertia of the building envelope. A high-mass building (reinforced concrete structure, masonry walls) will show a pronounced decoupling between outdoor temperature swings and the heat demand measured at the boiler — the structure absorbs heat during the day and releases it at night, effectively shifting the HVAC load profile. Quantifying this time-lag — typically 2 to 8 hours in well-constructed mass buildings — allows engineers to pre-condition the building ahead of peak occupancy, reducing peak energy demand charges.

Time-Lag Between Internal Surfaces and Ambient Space
The time-lag metric is one of the most underutilized data points in commercial building energy management. It is derived by cross-correlating thermal mass flow meter readings (which proxy heating/cooling demand) against indoor temperature sensor readings over a rolling 24–48 hour window. Research published in Energy and Buildings (2025) demonstrates that in poorly managed buildings, thermal mass “tends to store heat when it is not needed and release it when buildings do not require it” — effectively penalizing energy efficiency rather than enhancing it. Real-time monitoring of the mass-flow-to-temperature relationship enables the BMS to correct for this phase mismatch proactively.
Energy Use Indicators and Temperature Setpoint Responses
The following chart illustrates typical energy savings achieved across building types after deploying integrated mass-flow and temperature monitoring — based on aggregated case study data from SEP (Superior Energy Performance) certified facilities and published retrofit studies.
📊 Average HVAC Energy Savings After Integrated Monitoring Deployment
Aggregated from SEP program data, IEA EBC Annex 61, and published commercial retrofit case studies (2019–2025)Note: Savings percentages reflect HVAC energy specifically; overall facility savings will vary by energy mix and baseline conditions.
Key Metrics to Monitor with Indoor Temperature Sensors
Zone Temperature, Average vs. Peak Readings
Zone temperature monitoring in commercial buildings serves two distinct analytical purposes that are often conflated. The average zone temperature — calculated across multiple sensor points in a space — feeds the BMS control loop and determines whether the HVAC system is meeting its setpoint on a time-averaged basis. The peak temperature reading, however, is what reveals comfort failures and equipment stress events: a corner office that spikes to 27°C for three hours on a summer afternoon will show an acceptable daily average, yet generate occupant complaints and reduce productivity. Specifying sensors only at the thermostat location — typically a corridor or core zone — is one of the most common monitoring errors in commercial fitouts, because it masks peripheral zone conditions entirely.
Temperature Distribution and Stratification
In any space with ceiling heights above 3.5 m — warehouses, atriums, manufacturing halls, large open-plan offices — thermal stratification becomes a significant efficiency and comfort issue. Research on large conditioned spaces documents temperature gradients of 0.06 to 2.0 °C per metre of height in inadequately managed atria. ASHRAE guidance sets a maximum supply-air-to-zone-air temperature differential of 15–20°F (8–11°C) to prevent stratification-driven comfort failures. Without vertical sensor arrays (typically three measurement heights: occupied zone at 1.1 m, mid-height, and ceiling level), stratification is invisible to the BMS — and the system may be simultaneously overcooling at floor level and under-cooling at the occupied zone.
Comfort Indices: Setpoint Compliance and Excursions
Beyond raw temperature readings, advanced ITS deployments track comfort indices derived from combined temperature and humidity data. The most widely used in commercial building contexts are PMV (Predicted Mean Vote) and PPD (Predicted Percentage Dissatisfied), both defined in ISO 7730 and referenced by ASHRAE Standard 55. These indices combine air temperature, mean radiant temperature, air velocity, relative humidity, clothing insulation (clo value), and metabolic rate into a single comfort score. For facility managers reporting to occupant satisfaction KPIs — increasingly required in LEED, BREEAM, and WELL-certified buildings — these indices provide the contractual evidence base that pure temperature data cannot.
🥧 Root Causes of Building Comfort Complaints in Commercial Offices
Based on ASHRAE and European building operator survey data (2023–2025)Why Monitoring Both Tools Provides a Fuller Picture
Complementary Insights for Energy Efficiency
The operational logic is straightforward when articulated as a diagnostic question: a thermal mass flow meter tells you how much energy is flowing into the building system; an indoor temperature sensor tells you what that energy is actually achieving inside the space. Neither instrument, alone, is sufficient to answer the full energy management question.
Consider a commercial office building where gas consumption data from the thermal mass meter shows a 22% increase compared to the same month in the prior year. Without zone temperature data, you cannot distinguish between three equally plausible explanations: the building envelope is performing worse (increased infiltration or degraded insulation), the HVAC system is running less efficiently (heat exchanger fouling, degraded controls), or occupancy or operational patterns have changed (extended hours, higher internal heat loads). Cross-referencing the mass flow trend with zone temperature logs and setpoint compliance records narrows the diagnosis to the actual root cause — and that distinction is what drives an effective corrective action plan rather than expensive guesswork.

Detecting Building Enclosure Issues and HVAC Performance Gaps
When heat flux sensors at the building envelope are combined with indoor temperature readings and mass flow data from the heating system, it becomes possible to calculate the in-situ U-value of walls, roofs, and glazing under actual weather conditions — a far more reliable figure than the theoretical design U-value that may be 15–40% optimistic in practice, especially in aged or retrofit buildings. A mismatch between the measured U-value and the design specification is direct evidence of a building enclosure fault — whether that is thermal bridging at steel studs, moisture-degraded insulation, or failed weatherproofing at penetrations.
Aligning Comfort with Energy Costs
The productivity cost of thermal discomfort is frequently more significant than the energy cost of fixing it. Studies cited by ASHRAE document that a 1°C increase above the comfort zone reduces cognitive task performance by 2–4% in office workers. For an organization with a large workforce, this translates to a business impact that dwarfs the monthly energy bill. Integrated monitoring — mass flow meters establishing the energy cost baseline, temperature sensors establishing the comfort performance baseline — gives facilities teams the evidence base to justify investment in improved controls, recommissioning, or envelope upgrades in financial terms that resonate with CFOs and operations directors.
| Parâmetro | Thermal Mass Meter (TMM) | Indoor Temperature Sensor (ITS) | Combined Value |
|---|---|---|---|
| Primary Question Answered | How much energy (gas/air mass) is consumed? | What is the temperature condition in the space? | Is the energy being consumed achieving the desired thermal outcome efficiently? |
| Data Resolution | Continuous real-time, 1-second to 1-minute intervals | Continuous, configurable polling (1 s – 15 min) | Correlated time-series enables lag analysis |
| Relevant KPIs | kg/h consumed, SCFM, energy intensity (kWh/m²) | °C zone mean, peak deviation, PMV, PPD, setpoint hours | Comfort-per-kWh ratio; energy performance gap index |
| Typical Installation | Pipe/duct insertion; inline for smaller lines; BMS via Modbus/BACnet | Wall-mounted or wireless node; thermostat wiring or battery | Integrated into BMS for unified dashboard |
| Maintenance Interval | Annual calibration check; in-situ zero-flow verification available | Annual drift check; Sensor replacement every 5–10 years | Calibration schedules aligned to ISO 9001 / ISO 50001 |
| Standards Relevance | ISO 50001, ISO 9001, EN ISO 17089 | ASHRAE 55, EN 15251, ISO 7730 | LEED EA Credit, BREEAM HEA, WELL Thermal Comfort |
Practical Applications and Scenarios
Commercial Buildings with Varied Occupancy
In a multi-tenancy office tower or a university campus with variable occupancy schedules, the combination of thermal mass flow metering and zone temperature sensing enables a monitoring strategy called demand-controlled ventilation (DCV) at scale. Each tenant floor carries its own gas sub-meter (thermal mass flow meter on the fan-coil unit supply) and its own temperature sensor network. This allows the facilities team to allocate energy costs accurately per tenant, identify floors where HVAC is running at full capacity to an empty space (a common source of energy waste on weekends), and demonstrate ISO 50001 compliance with individual-zone energy performance data.
In practice, a 30,000 m² commercial campus that implemented this combined monitoring approach in a documented Australian case study reduced HVAC energy consumption by 22% within 18 months — primarily by identifying six air-handling units that were operating at design capacity regardless of occupancy, and by correcting two zones where faulty temperature sensors were sending erroneous readings that caused the BMS to drive unnecessary heating.
Industrial Plants and Manufacturing Facilities
In an industrial setting, the stakes around accurate flow measurement are particularly high. Compressed air is frequently called the “fourth utility” — behind electricity, gas, and water — and yet it is also one of the most poorly monitored. The U.S. Department of Energy estimates that 30% of industrial compressed air output is wasted through leaks and inefficiency. A thermal mass flow meter installed at the main compressed air header, with sub-meters at individual production lines, enables a systematic leak detection programme: during planned shutdown periods (nights, weekends), any residual flow reading on a closed sub-meter immediately quantifies the leakage rate in that circuit. This monitoring approach makes the energy waste visible in financial terms that drive repair budgets.
Residential Buildings for Comfort and Efficiency
While the primary focus of this article is on B2B industrial and commercial environments, it is worth noting that high-performance residential applications — particularly multi-dwelling developments, serviced apartments, and premium residential campuses — increasingly deploy both instruments. In these contexts, smart heat meters (which incorporate a thermal mass flow sensor as their core measurement element) provide individual unit consumption data for fair billing, while room temperature sensors feed occupant-controlled comfort systems and building-level analytics. The combination is a requirement under the EU Energy Efficiency Directive’s sub-metering obligations for multi-apartment buildings.
Retrofits and New Construction Considerations
The monitoring strategy differs significantly between new-build and retrofit scenarios. In new construction, both instrument types can be specified from the design stage, with optimal pipe sizing for meter insertion, cable routes for sensor wiring, and BMS integration protocols defined upfront — minimising installation cost and maximising data quality from day one. In retrofits, the priority should be established through an initial energy audit that identifies the highest-impact measurement gaps: if compressed-air or gas sub-metering is absent, thermal mass flow meters deliver the fastest ROI; if comfort complaints and HVAC performance issues are the primary driver, a wireless temperature sensor network can be deployed without civil works and provides actionable data within days of installation.
Data Interpretation and Common Pitfalls
Misinterpreting Transient vs. Steady-State Data
One of the most frequent data-interpretation errors occurs when engineers apply steady-state analysis to inherently transient phenomena. Building thermal behaviour is never truly steady-state during normal operation: outdoor temperatures cycle through a 24-hour diurnal pattern, occupancy loads vary by the hour, solar gain fluctuates with cloud cover, and HVAC systems cycle through their own duty patterns. A thermal mass flow meter reading taken during a system startup transient — when the boiler is ramping up to operating temperature — will show dramatically elevated flow rates that are entirely normal and should not be compared directly to steady-state efficiency benchmarks. Similarly, a temperature sensor reading taken within 30 minutes of a space being opened after overnight setback will reflect the pull-down transient, not the maintained temperature performance.
Best practice is to define explicit steady-state windows for performance benchmarking — typically at least 2 hours after any setpoint change or occupancy event — and to log transient periods separately for system commissioning analysis rather than energy performance reporting.
Sensor Placement Biases and Mass Measurement Challenges
Temperature sensor placement is the single most controllable variable in building monitoring data quality — and the most frequently mismanaged. Sensors positioned within 300 mm of an external wall, near HVAC supply diffusers, above heat-generating equipment, or in direct sunlight will report temperatures that are systematically biased from the true representative zone condition. ICS-Schneider’s published guidelines on sensor placement document that sensors too close to a wall surface “are slower to change and often create a false impression of stability.” The practical consequence in a BMS control loop is that the HVAC system is optimizing for the sensor location, not for the occupied space.
For thermal mass flow meters, the analogous challenge is upstream flow conditioning. An insertion-style meter requires a minimum of 10–15 pipe diameters of straight, unobstructed pipe upstream and 5 diameters downstream to ensure a fully developed flow profile at the measurement point. Elbows, valves, or branch tees within these distances will distort the velocity profile across the pipe cross-section, introducing systematic measurement error regardless of how accurately the sensor itself is calibrated.

Calibration and Data Quality Checks
Calibration drift is a reality in both instrument classes, but it manifests differently. Modern thermal mass flow meters from leading manufacturers — including the insertion-type instruments in Jade Ant Instruments’ thermal flow meter range — incorporate in-situ no-flow calibration verification that allows the field technician to confirm the sensor is performing within factory-calibrated specification without removing the instrument from the pipe. This is a significant operational advantage: the alternative (returning the meter to the factory or a third-party calibration house) involves instrument downtime and associated system disruption that most live facilities cannot accommodate.
Indoor temperature sensors, particularly thermistors operating in environments with high particulate loading or humidity cycling, are subject to gradual resistance drift that manifests as a slow, undetected offset in reported temperature. A sensor that drifts +0.8°C will cause the BMS to overcool the zone by 0.8°C — a small but continuous energy waste that, across hundreds of sensors in a large building, accumulates to a meaningful annual cost. Annual cross-calibration against a NIST-traceable reference thermometer and systematic comparison of adjacent sensor readings (which should agree to within ±0.3°C in a uniform space) are the minimum data-quality checkpoints.
Placement, Installation, and Calibration Best Practices
Strategic Sensor Placement for Representative Readings
The following installation guidelines apply to both instrument types and represent the consensus of ASHRAE, ISO 50001 implementation guides, and field experience from building commissioning engineers:
- Temperature sensors: Mount at occupied zone height (1.1 m from floor for seated occupants, 1.7 m for standing) in the geometric centre of the zone, away from supply diffusers (≥1.5 m), exterior walls (≥0.5 m), and equipment heat sources. In large open spaces, use a grid pattern with sensors no more than 10 m apart horizontally.
- Duct temperature sensors (RTD averaging element): Position in straight duct sections, downstream of mixing bends. Use multi-point averaging probes in ducts wider than 600 mm to capture velocity-profile-weighted temperature.
- Thermal mass flow meters: Install with 10–20 D upstream / 5 D downstream straight-run clearance from all fittings. In compressed air applications, position downstream of the air dryer to prevent moisture condensation on the sensor element.
- Heat flux sensors (building envelope): Attach to interior wall surfaces away from thermal bridges (columns, window frames). Pair with adjacent indoor and outdoor temperature loggers to compute in-situ U-value via ISO 9869 heat flow meter method.
- Wireless nodes: Verify RF signal quality before finalizing placement. In concrete-framed buildings, penetration loss can be severe; place mesh network relay nodes to ensure reliable data transmission to the BMS gateway.
Calibration Routines and Drift Management
A calibration schedule aligned to ISO 9001 requirements (mandatory for facilities operating under ISO 50001) must define the calibration interval, the reference standard, the acceptable tolerance, and the corrective action procedure for out-of-tolerance instruments. For most building monitoring applications, the practical schedule is as follows: thermal mass flow meters — annual in-situ zero-flow verification, with factory recalibration every 3–5 years unless the in-situ check indicates drift; indoor temperature sensors — annual cross-check against a calibrated reference, with immediate replacement for sensors showing drift greater than ±0.5°C. Documenting calibration records in the BMS asset register ensures audit traceability for ISO, LEED, and BREEAM certification purposes.
Integration with Building Management Systems (BMS)
Both thermal mass flow meters and temperature sensors are designed for BMS integration, but the protocol landscape matters for interoperability. BACnet is the dominant open protocol for building automation — the most widely adopted standard for HVAC sensor integration across brands — while Modbus RTU/TCP remains prevalent in industrial and energy meter applications. When specifying instruments for a new BMS integration or a retrofit, confirm that both the meter/sensor and the BMS controller support the same protocol version and data object types. Mismatched protocol implementations (particularly BACnet object type mismatches) are a leading cause of delayed commissioning in large building projects.
The team at Instrumentos Jade Ant — a precision flow measurement manufacturer with 15+ years of industrial instrumentation experience — offers thermal mass flow meter variants with configurable outputs including 4–20 mA analogue, Modbus RS485 RTU, and HART protocol, ensuring compatibility with the broadest range of BMS platforms in the market. For projects where the integration protocol is not yet defined, the analogue 4–20 mA output provides a hardware-agnostic fallback that any BMS controller can read without additional configuration.
Cost, Complexity, and Return on Investment
Upfront vs. Ongoing Costs
The cost structure of building monitoring instruments is best understood as a total cost of ownership (TCO) calculation rather than a purchase-price comparison. The following table breaks down typical cost elements for both instrument classes in a commercial building context:
| Cost Element | Thermal Mass Flow Meter | Indoor Temperature Sensor (Wired) | Indoor Temp Sensor (Wireless) |
|---|---|---|---|
| Hardware (per point) | $500 – $3,500 (insertion type, depending on pipe size and spec) | $40 – $250 (thermistor/RTD wall sensor) | $80 – $400 (IoT node with gateway cost allocated) |
| Instalação | $200 – $800 (pipe tapping, isolation valve, wiring) | $80 – $200 (cable run, backbox, commissioning) | $30 – $80 (mounting only; no cable run) |
| Annual Calibration | $150 – $400 (in-situ check); $600–$1,200 (factory) | $30 – $80 per point (site cross-calibration) | $30 – $80 per point |
| BMS Integration | $100 – $500 (protocol configuration, data point mapping) | $50 – $200 per point | $200–$500 per gateway (shared across many nodes) |
| Expected Service Life | 10 – 15 years (no moving parts) | 7 – 12 years | 5 – 8 years (battery-limited; firmware obsolescence) |
| Typical Payback Period | 6 – 24 months (energy savings dependent) | Soft ROI (comfort, HVAC efficiency, certification support) | Soft ROI + retrofit labour savings |
When the Data Justifies the Tools
Thermal mass flow meters deliver their strongest ROI in applications where the gas or air being measured has a direct, high-value energy cost — compressed air systems, natural gas boiler and furnace supply lines, combustion air measurement in industrial heating, and building-level gas sub-metering for ISO 50001 compliance. The rule of thumb from SEP program data: facilities with annual energy costs exceeding $1.5 million can typically achieve payback on a comprehensive sub-metering programme within 18 months.
Indoor temperature sensors deliver ROI through a different mechanism — they prevent the over-consumption caused by poor control, and they support occupant-satisfaction KPIs that have real contractual value in commercial leases. A building that can demonstrate zone temperature setpoint compliance above 95% of occupied hours is a demonstrably better product for tenants than one that cannot — and can command a premium in lease negotiations.
Simplified vs. Advanced Monitoring Solutions
Not every building requires the full monitoring stack from day one. A phased implementation — starting with thermal mass flow meters at the highest-cost energy entry points, adding temperature sensor networks zone by zone as the data use case is validated — is often the most practical approach for organisations where capital budgets are constrained. The important principle is that the monitoring infrastructure, once installed, should be designed to accommodate expansion without reinstrumentation: specifying BMS-compatible outputs and open communication protocols from the outset is the engineering decision that preserves future optionality at minimal upfront cost.
Implementation Checklist and Next Steps
Baseline Data Collection Plan
Before specifying any instruments, conduct a site walkthrough to document existing metering infrastructure, identify significant energy uses (SEUs) per ISO 50001 criteria, and map the locations where flow and temperature data gaps are largest. Prioritize measurement points by their potential energy-saving impact.
Select thermal mass flow meters for each gas/air measurement point based on pipe diameter, operating pressure range, gas composition, and required turndown ratio. Select temperature sensors based on required accuracy class, mounting constraints, and BMS communication protocol. Consult with your instrumentation supplier — such as the applications engineering team at Instrumentos Jade Ant — to verify meter sizing and application suitability before purchase.
Install meters and sensors according to the placement guidelines in Section 8. Commission each instrument against a calibrated reference and document the zero-flow baseline for each thermal mass flow meter. Verify BMS data integration with a 48-hour data continuity test before signing off the installation.
Collect a minimum of 3 months of continuous data before making operational decisions, and ideally 12 months to capture seasonal variation. Use this period to identify data quality issues (sensor dropouts, implausible spikes, calibration drift) and correct them before the data enters formal performance reporting.
Configure the BMS or a dedicated energy management platform to display the core KPIs defined in the next section. Set automated alerts for threshold exceedances (e.g., zone temperature deviation > ±1.5°C from setpoint for > 30 minutes, or mass flow rate exceeding the 95th percentile baseline during unoccupied hours) to enable rapid corrective response.
Key Performance Indicators (KPIs) to Track
| KPI | Instrument Source | Measurement Unit | Target / Benchmark | Review Frequency |
|---|---|---|---|---|
| Building Energy Use Intensity (EUI) | TMM (gas + electricity) | kWh/m²/year | Class A office: ≤120 kWh/m²/yr (ASHRAE 90.1) | Monthly, annualized |
| Compressed Air Leak Rate | TMM (off-hours flow) | % of peak flow | <10% (best practice); <5% (excellent) | Weekly (automated alert) |
| Zone Temperature Setpoint Compliance | ITS | % of occupied hours within ±1°C of setpoint | ≥95% (LEED v4 baseline) | Daily / weekly |
| Thermal Stratification Index | ITS (multi-height) | °C per metre (ceiling-to-occupied-zone) | <0.5°C/m (ASHRAE 55 comfort guidance) | Weekly |
| HVAC Efficiency Ratio | TMM + ITS combined | °C of setpoint compliance per kWh consumed | Facility-specific baseline; track trend direction | Monthly |
| Boiler / Combustion Efficiency | TMM (fuel + combustion air) | % (actual vs. rated) | ≥85% for modern condensing boilers | Monthly; alert on >5% deviation |
| Comfort Excursion Hours | ITS | Hours/month outside ASHRAE 55 comfort zone | <5% of occupied hours | Weekly (automated report) |
Actionable Steps After Initial Data Collection
The value of monitoring infrastructure is only realized if the data drives decisions. After the initial baseline period, the standard analytical workflow should produce three categories of actionable output: quick wins (operational adjustments — setpoint corrections, scheduling changes, leak repairs — that can be implemented within 30 days at minimal cost); medium-term upgrades (recommissioning or component replacement that the data justifies in financial terms); and long-term capital investments (equipment replacement, envelope upgrades, BMS expansion) that the monitored energy performance data can be used to evaluate against the measured baseline rather than against optimistic theoretical projections.

Two Instruments, One Integrated Strategy
Thermal mass meters and indoor temperature sensors are not competitors for the same measurement task — they are complementary instruments that address different layers of the building energy equation. A thermal mass flow meter quantifies the energy entering a system, delivering the precision and reliability required for ISO 50001 sub-metering, compressed-air leak detection, combustion efficiency monitoring, and regulatory compliance. An indoor temperature sensor network maps what that energy achieves in the occupied space, providing the comfort and control data that drives HVAC optimization, occupant satisfaction, and certification compliance.
The industry insight that experienced facility engineers consistently report is this: buildings that invest in only one instrument type tend to optimize half the problem. The plants that achieve sustained 15–20% HVAC energy reductions — the kind that show up in annual energy cost statements and ESG reports — are those where mass flow data and temperature data are integrated into a unified BMS dashboard, reviewed together, and acted on together.
For facility managers and building automation specifiers ready to build or upgrade their monitoring infrastructure, the practical starting point is always an assessment of the current measurement gaps. If you are managing a building where compressed air, natural gas, or combustion air flows are unmetered — or where your temperature sensor network is limited to single-point thermostat locations — you already know where your monitoring programme needs to expand first. The instruments exist, the integration protocols are standardised, and the ROI evidence is extensive. The only variable is when to begin.
For more on industrial-grade thermal mass flow measurement solutions designed for building HVAC, energy management, and process gas monitoring, visit Instrumentos Jade Ant — or explore their thermal flow meter product specifications to begin matching instrument specifications to your application requirements.
Perguntas frequentes
The following questions address the most common technical and operational queries from facility engineers, building automation specifiers, and energy managers evaluating thermal mass meters and indoor temperature sensors.
Further Reading and Resources
For readers seeking to deepen their technical understanding or explore specific application areas, the following resources are authoritative starting points:
- Sage Metering — Thermal Mass Flow Meters in ISO 50001 Energy Management — detailed technical white paper on compressed air and natural gas monitoring applications
- IEA — Energy Efficiency 2025: Buildings — authoritative global data on building energy consumption trends
- BAPI — Thermistor vs. RTD Temperature Measurement Accuracy — independent benchmarking of sensor types for HVAC building applications
- Jade Ant Instruments — Top Thermal Mass Flow Meter Brands Compared — market-facing comparison of leading manufacturers and selection criteria
- KW Engineering — Impacts of Thermal Stratification on Building Comfort, Cost, and Energy — applied engineering analysis of stratification effects on HVAC performance
- Fox Thermal — Thermal Mass Flow Meters vs. Competing Technology — objective technology comparison across flow measurement methods