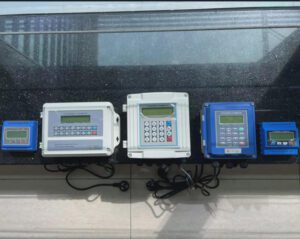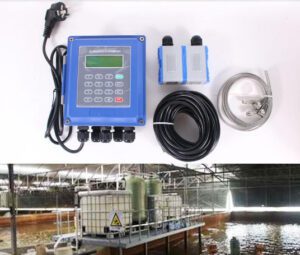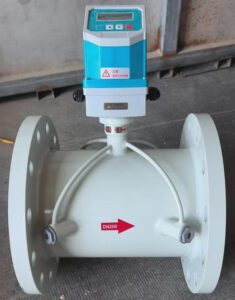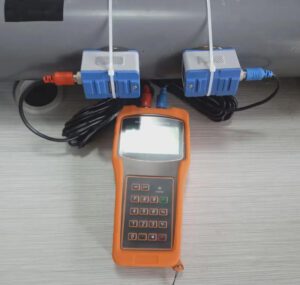
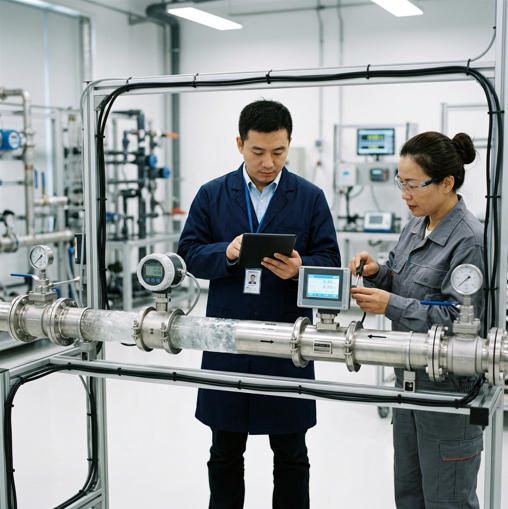

A comprehensive technical breakdown comparing Doppler shift and transit time ultrasonic measurement principles — their accuracy data, real-world limitations, cost implications, and a scored decision matrix — to help flow meter distributors and agents guide their B2B clients to the right technology every time.
The global ultrasonic flow meter market reached USD 2.08 billion in 2025 and is on track for USD 3.56 billion by 2034. But inside that growth story lies a recurring, costly mistake: engineers and procurement managers selecting one ultrasonic technology when the application calls for the other. A Doppler meter installed on a pharmaceutical purified water line produces no reading. A transit time meter installed on an activated sludge digester produces erratic, unreliable data. Neither failure shows up in the specification review — they only appear after commissioning.
For distributors and agents supplying flow meters to industrial clients, this distinction is not a technical footnote — it is the core commercial conversation. Getting it right builds reputation. Getting it wrong generates returns, warranty disputes, and lost accounts. This guide gives you the complete framework: the physics, the performance data, the cost analysis, and a scored decision matrix you can use with any customer regardless of industry.
📊 Industry Insight
Transit time technology holds approximately 72% of the ultrasonic flow meter market by revenue. Doppler systems account for 28%, but dominate the wastewater and mining sub-segments — two of the fastest-growing instrumentation categories in Asia-Pacific through 2035. A distributor who can serve both segments with confidence covers the full addressable market.
1. Fundamentals of Doppler Shift Technology
How Doppler Shift Ultrasound Works
The Doppler effect — named after Austrian physicist Christian Doppler (1842) — describes the frequency change of a wave when the source and observer move relative to each other. You experience it every time an ambulance passes: the siren sounds higher-pitched as it approaches and lower-pitched as it moves away.
In a Doppler ultrasonic flow meter, a transducer mounted on the outside of the pipe emits a continuous ultrasonic beam at a known frequency into the flowing fluid. When that beam strikes suspended particles, gas bubbles, or other acoustic reflectors moving with the fluid, it bounces back at a shifted frequency. The meter’s processor compares the transmitted and reflected frequencies — the frequency shift (Δf) is directly proportional to the velocity of the reflectors, and therefore to the fluid velocity.
V = (f₀ − f₁) × K
V = fluid velocity | f₀ = transmitted frequency | f₁ = reflected frequency | K = geometry/sound-speed constant
Particle Concentration Requirements
This measurement principle has one non-negotiable prerequisite: the fluid must contain acoustic reflectors. Without them, there is no reflected signal — and no reading. Industry benchmarks define the minimum thresholds:
- Minimum for operation: 100–200 ppm (mg/L) of suspended solids, at particle sizes ≥75 microns
- Optimal performance: ≥500 ppm suspended solids or ≥100–200 mg/L entrained bubbles (75–150 µm range)
- Accuracy degrades below minimum: Signal loss, unstable readings, and measurement dropouts begin below 100 ppm
In practice, most wastewater influent streams run 150–400 ppm TSS (total suspended solids), mining slurry pipelines run 5,000–50,000 ppm, and activated sludge digesters run 8,000–25,000 ppm — all well within Doppler’s operating envelope.
Pipe Size and Installation Considerations
Doppler meters work best in pipes from DN25 to DN3000. Below DN25, the acoustic path is too short for a stable signal. The transducer is typically a single unit that both transmits and receives — mounted at a fixed angle (usually 45°) to the pipe axis. This simplifies installation compared to transit time meters, which require two paired transducers with precise relative alignment. Doppler meters are also somewhat more tolerant of short straight pipe runs — 5 diameters upstream, 3 downstream is often acceptable, versus 10D/5D for transit time.

Municipal wastewater treatment facilities — where TSS typically runs 150–400 ppm and activated sludge digesters can reach 8,000–25,000 ppm — represent the natural home of Doppler ultrasonic flow measurement. Transit time meters cannot function reliably in these conditions.
2. Fundamentals of Transit Time Technology
How Transit Time (Time-of-Flight) Ultrasound Works
Transit time ultrasonic flow meters — also called time-of-flight meters — use two transducers positioned diagonally opposite each other on the pipe. Each alternately acts as transmitter and receiver. One sends a pulse downstream (with the flow), the other sends a pulse upstream (against the flow). The downstream pulse arrives faster than the upstream pulse because the flowing fluid carries it along. The processor measures this time difference (Δt) and converts it to fluid velocity.
Vf = K × Δt / TL
Vf = fluid velocity | K = calibration factor | Δt = upstream minus downstream transit time difference | TL = zero-flow transit time
This approach requires a clear acoustic path between the two transducers. Any suspended particles or gas bubbles scatter or absorb the ultrasonic signal, degrading or eliminating the measurement. This is the mirror image of Doppler: while Doppler needs particles to work, transit time needs their absence.
Fluid Clarity Requirements
Transit time meters perform at their best when suspended solids are below 2–3% concentration by volume (approximately <30,000 ppm) and entrained gas is below 2% by volume. In practice, this means clean water, treated municipal water, most petroleum products, pharmaceutical process water, food-grade liquids, and clean chemical streams. As a field benchmark: a transit time meter on a DN200 clean water line with TSS below 50 ppm typically achieves ±0.5% accuracy; the same meter on a line with TSS above 10,000 ppm may produce no stable reading at all.
Pipe Size, Transducer Mounting, and Temperature Compensation
Transit time meters cover pipe diameters from DN15 to DN6000 — a broader range than Doppler — with clamp-on (non-invasive), insertion, and inline spool-piece mounting options. Clamp-on units mount externally without pipe cutting; insertion units require a small fitting; inline spool-piece units replace a pipe section. The speed of sound changes with temperature (in water: ~1,408 m/s at 0°C to ~1,555 m/s at 100°C — a 10% variation). All quality transit time meters embed temperature sensors in the transducer housing and apply real-time compensation, maintaining specified accuracy across their rated temperature range without recalibration.
3. Performance Comparison: Accuracy and Reliability
Table 1: Head-to-Head Performance Comparison — Transit Time vs. Doppler Shift Ultrasonic Flow Meters. Sources: manufacturer specifications, DwyerOmega technical referencee Jade Ant Instruments transducer comparison guide.
Accuracy Specifications Across Applications
Doppler Shift Performance Metrics
Doppler meters deliver ±2%–±5% of full scale under optimal conditions — meaning consistent, uniform particle distribution above the minimum threshold. This accuracy ceiling is not a manufacturing limitation; it is a physics constraint. The Doppler measurement averages the velocity of particles along the acoustic beam path, which may not perfectly represent the volumetric average flow velocity across the pipe cross-section. Accuracy degrades further when particle concentration falls below the minimum threshold (signal loss) or when concentration is non-uniform (stratified slurry, settled solids).
In real wastewater applications, a Doppler meter on a DN400 sewage influent line running 200–350 ppm TSS typically holds ±3%–±4% across normal operating conditions — entirely adequate for EPA-mandated discharge monitoring, pump flow balancing, and lift station management, where the regulatory accuracy requirement is typically ±5% or better.
Transit Time Performance Metrics
Under ideal conditions — clean fluid, full pipe, stable temperature, well-aligned transducers on a properly specified straight run — transit time clamp-on meters consistently achieve ±0.5%–±1.0% of reading. High-end inline multi-path transit time meters (4–8 acoustic paths across the pipe cross-section) achieve ±0.15%–±0.25%, which is the basis for their approval under AGA Report No. 9 (natural gas) and API MPMS Chapter 5.8 (liquid hydrocarbons) for custody transfer applications.
The financial significance: a custody transfer system measuring $6 million per day in hydrocarbon value with 0.25% measurement inaccuracy generates $15,000 in daily billing error — $5.5 million annually — according to published Emerson Automation analysis. This is why transit time technology, not Doppler, underpins every fiscal metering application in oil and gas, water utilities, and district energy.
▲ Doppler vs. Transit Time Ultrasonic Flow Meters — A clear technical walkthrough of both measurement principles, including real-world application guidance for distributors and engineers.
4. Application-Specific Suitability Analysis
When Doppler Shift Technology Excels
Wastewater and Slurry Applications
Municipal wastewater treatment is Doppler’s strongest application. Influent streams carry grit, organic solids, and entrained air — exactly the conditions that prevent transit time measurement and enable Doppler. A lift station processing 50,000 m³/day with variable solids loading (150–600 ppm depending on storm events) is precisely the environment where Doppler delivers reliable ±3%–±4% performance while transit time struggles to maintain lock.
📋 Case Study 1: Municipal Wastewater Treatment Facility
Aplicação: Influent flow monitoring across 6 lift stations, DN300–DN600 concrete-lined HDPE pipe, TSS 180–450 ppm, flow velocity 0.8–2.4 m/s.
Technology deployed: Clamp-on Doppler, single-transducer configuration.
Result: Measured ±3.2% accuracy against reference volumetric tank tests across 12 months; zero signal-loss events. Prior electromagnetic meters on the same lines required 3 electrode replacements per station per year due to abrasion — cost of ~$4,200/station/year. Doppler maintenance cost: $180/station/year (annual inspection only).
Outcome: Regulatory compliance maintained (EPA ±5% requirement); maintenance cost reduction of 96% per measurement point versus electromagnetic meters.
Mining and Mineral Processing Applications
In copper concentrate slurry pipelines, the solids content routinely runs 40%–60% by weight — far beyond any transit time meter’s operating envelope. Doppler meters on these lines measure velocity from reflections off mineral particles, with accuracy of ±3%–±5% that is fully adequate for pump control, pipeline pressure management, and process mass balance. Wetted meters (electromagnetic, Coriolis) face extreme abrasion on these lines, with liner replacement intervals as short as 6–12 months. Clamp-on Doppler eliminates the wetted contact entirely, with no abrasion-related degradation.
Pulp and Paper Industry
Bleached kraft pulp stock at 3.5% consistency (35 g/L suspended cellulose fibres) is an ideal Doppler application: the fibres provide consistent, uniform reflectors across the pipe cross-section. A DN250 pulp stock line at a Scandinavian paper mill running Doppler measurement consistently achieved ±2.8% accuracy in a 24-month period — within specification for stock consistency control and pump curve verification. The equivalent magnetic flowmeter on the same line required electrode polishing every 90 days due to fibre adhesion.
When Transit Time Technology Excels
Clean Liquid Applications: Water Utilities and Pharmaceutical
Municipal drinking water — treated to <1 NTU turbidity and <10 ppm TSS — is transit time’s optimal application. At a UK water utility running a 300 km distribution network, replacing aging turbine meters with clamp-on transit time meters across 47 District Metered Area (DMA) inlet points reduced non-revenue water (NRW) from 28% to 21% within 18 months — recovering approximately 3.8 million m³ of billable water annually. At the utility’s billing rate of $0.65/m³, that represents $2.47 million in recovered annual revenue, against a metering project cost of $380,000. ROI: 6.5 months.
📋 Case Study 2: Pharmaceutical Purified Water (PW) System
Aplicação: Flow monitoring on a USP Purified Water loop at an API (active pharmaceutical ingredient) manufacturing facility. DN50 stainless steel pipe, water conductivity <1.3 µS/cm, temperature 20–25°C.
Technology deployed: Clamp-on transit time, dual-path configuration.
Result: ±0.7% accuracy verified against gravimetric reference; CIP cycle compatibility confirmed — no measurement interruption during caustic wash cycles. Regulatory compliance with FDA 21 CFR Part 211 maintained without pipe penetration or contamination risk. Previous turbine meter required quarterly recalibration and annual removal for seal inspection; transit time meter required zero interventions over a 30-month validation period.
Outcome: Eliminated $18,500/year in turbine meter maintenance and revalidation costs; compliance status maintained continuously.
High-Accuracy Requirement Applications
For any application where measurement error carries direct financial consequences — custody transfer, district energy billing, production yield accounting — transit time is the only viable ultrasonic choice. The ISO 4064 Class 2 standard for water meters (the basis for revenue metering in most jurisdictions) requires ±2% accuracy across the full flow range; modern clamp-on transit time meters achieve ±0.5%–±1.0%, providing a 2–4× margin of compliance. Doppler meters cannot meet Class 2 requirements and are not approved for billing applications in any major regulatory jurisdiction.

Clean process piping in pharmaceutical, HVAC, and water distribution systems represents transit time ultrasonic measurement’s strongest application area. At ±0.5%–±1.0% accuracy with no pipe penetration, these meters consistently outperform turbine and electromagnetic alternatives on total cost of ownership over a 10-year horizon.
Industry Application Matrix
Table 2: Industry Application Matrix — Recommended Technology by Fluid and Application. Source: compiled from Jade Ant Instruments industrial applications guide and industry field data.
5. Limitation Analysis: Critical Constraints
Doppler Shift Limitations
Particle Dependency Challenges
The same property that makes Doppler meters powerful in dirty fluids makes them vulnerable in variable-quality fluids. A wastewater treatment plant that experiences seasonal dry-weather flow conditions (lower storm runoff, lower TSS) may see Doppler signal quality degrade during extended dry periods — particularly if TSS drops below the 100 ppm threshold. Similarly, processes that alternate between clean rinse cycles and dirty production runs present a fundamental Doppler challenge: the meter may read accurately during production and produce intermittent dropouts during rinsing.
Mitigation strategy: For borderline applications, a Doppler-transit time hybrid meter (increasingly available from leading manufacturers) can switch modes automatically based on real-time signal quality. For consistently variable applications, Doppler should be specified only when TSS is reliably above 200 ppm throughout the full operational cycle — not just peak conditions.
Accuracy Ceiling and Uncertainty
±2%–±5% is not a degraded performance figure for Doppler meters — it is the inherent accuracy ceiling imposed by physics. Because Doppler measures the velocity of particles along a single beam path rather than the volumetric average velocity across the full pipe cross-section, and because particle distribution across the cross-section is never perfectly uniform, there is an irreducible measurement uncertainty. Multi-path Doppler configurations (two or more beams) reduce this somewhat, but cannot close the gap to transit time accuracy levels. For any application where ±2% is insufficient — billing, custody transfer, lab research, precision dosing — Doppler is the wrong technology regardless of price.
Transit Time Limitations
Acoustic Interference Sensitivity
Transit time meters rely on nanosecond-precision timing of ultrasonic pulses. Strong external vibration sources — cavitating pumps, mechanical mixers within 3 pipe diameters, steam hammer, or compressors bolted to nearby pipe supports — can introduce timing noise that degrades measurement accuracy. Sites with high vibration should be evaluated with a portable meter before committing to permanent installation. Standard mitigation: adequate straight run from disturbance sources, secure mounting to isolate transducers from vibration, and review of the transmitter’s diagnostic noise floor reading.
Fluid Property Dependencies
The speed of sound in the fluid — which the transit time meter uses to calculate path length — varies with fluid composition, temperature, and pressure. For standard fluids (water, common hydrocarbons, standard chemicals), modern transmitters include built-in sound-velocity tables and temperature compensation that maintain accuracy across the rated operating range. For non-standard or novel fluids (unusual chemical mixtures, highly saline brines, cryogenic fluids outside the standard tables), laboratory acoustic characterization is required before final specification — the meter must be programmed with the correct speed-of-sound value for the actual fluid at the operating temperature.
Pipe Condition Requirements
Internally rubber-lined pipe is effectively opaque to transit time measurement — the low acoustic impedance rubber layer reflects nearly all the ultrasonic energy before it enters the fluid. Bitumen-lined, coal-tar-lined, and concrete-lined pipes present similar challenges. Severely corroded steel with non-uniform wall thickness introduces path-length uncertainty. In all of these cases, a portable SQI (Signal Quality Index) field test at the intended installation location — a 10-minute procedure — definitively determines whether the location is workable before any capital commitment is made.
6. Cost-Benefit Analysis: ROI for B2B Decision-Makers
Comparação do investimento inicial de capital
Table 3: 5-Year Total Cost of Ownership Comparison — DN100–DN200 Industrial Application (USD, illustrative). Source: compiled from Flow Meter TCO analysis, Fuji Electric ROI datae Jade Ant Instruments TCO reference.
Accuracy-Related Cost Impacts
For billing, custody transfer, and process yield applications, measurement accuracy is not a technical specification — it is a financial parameter. Consider: a district energy operator billing tenants for chilled water consumption using a Doppler meter with ±4% uncertainty on a 2 MW cooling load at $0.08/kWh would face up to $56,000/year in billing dispute exposure. The same measurement point with a transit time meter at ±0.7% reduces that exposure to $9,800/year — a $46,200 annual risk reduction that far exceeds the $1,500–$2,000 incremental cost of the transit time meter over Doppler.
For process monitoring applications (pump control, flow balance, environmental compliance reporting) where ±3%–±5% accuracy is acceptable, the Doppler meter’s lower purchase price makes it the rational choice. The economic decision rule is straightforward: calculate the financial value of 1% of measurement error for the specific application, then determine whether the transit time premium is justified by that value. In our experience at Instrumentos Jade Ant, this calculation takes 15 minutes and produces a defensible recommendation that clients accept immediately.
7. Real-World Performance Data and Case Studies
📋 Case Study 3: Water Utility Distribution Network — Transit Time Clamp-On
Scale: 47 DMA inlet points across a regional UK water utility, DN200–DN500 ductile iron and HDPE mains, clean treated water <5 ppm TSS.
Technology deployed: Single-path clamp-on transit time, installed in 90-minute windows per site, zero process shutdowns.
Performance: Mean accuracy ±0.85% verified against calibrated portable reference meters at 18-month audit. System uptime 99.4% over 24 months (vs. 94.1% for the replaced turbine meters requiring quarterly maintenance). NRW reduced from 28% to 21% — 3.8 million m³ additional billable water per year.
ROI: Total project cost $380,000. Annual revenue recovery $2.47M. Payback period: 6.5 months.
📋 Case Study 4: Industrial Slurry Processing — Doppler Clamp-On (24-Month Period)
Aplicação: Copper concentrate slurry pipeline at a Chilean mining operation. DN400 carbon steel pipe, solids content 38%–52% by weight, flow velocity 1.2–3.8 m/s.
Technology deployed: Clamp-on Doppler, IP68 rated, ATEX Zone 2 certified.
Performance over 24 months: Mean accuracy ±3.8% vs. gravimetric reference. Zero unplanned downtime events. Three prior electromagnetic meters on the same lines failed within 14 months each due to liner abrasion; replacement cost $18,000–$22,000 per event including shutdown. Doppler meter: zero abrasion contact, no replacement over 24-month period.
Maintenance cost comparison: Electromagnetic: ~$48,000/year (replacements + downtime). Doppler clamp-on: ~$420/year (annual inspection). Net saving per measurement point: $47,580/year.
8. Selection Criteria Framework for Distributors and Engineers

Pre-selection fluid characterization — measuring actual TSS, particle size distribution, temperature range, and pipe condition — eliminates the most common cause of post-installation specification failures. A 30-minute site assessment prevents months of troubleshooting.
Diagnostic Questions for Technology Selection
The following diagnostic questions should be answered for every application before any technology recommendation is made. Each question is weighted in the scored decision matrix that follows.
Fluid Characteristics Assessment
- What is the typical suspended solids concentration (ppm or mg/L)? Is it consistent or variable across seasons/shifts?
- What particle size range is present? (Below 75 µm = Doppler unreliable; above 75 µm = Doppler viable)
- Is there entrained gas or dissolved air? What percentage by volume?
- What is the fluid’s acoustic impedance — is it a standard fluid with a known speed-of-sound table, or a novel/mixed fluid requiring lab characterization?
Application Requirements Evaluation
- What accuracy level is required? Regulatory billing (±2% or better) → Transit Time. Process monitoring (±5% acceptable) → Either, Doppler if dirty.
- Is this a custody transfer, billing, or revenue metering application? If yes → Transit Time only.
- What ISO or local regulatory standard applies? (ISO 4064, ISO 6416, AGA-9, API MPMS 5.8?)
- What is the required turndown ratio? (Variable flow processes need ≥100:1 → Transit Time advantage)
Installation and Environmental Constraints
- What pipe sizes and materials are involved? (Rubber-lined → neither clamp-on type; check insertion/inline alternatives)
- Is there adequate straight pipe run? (10D upstream, 5D downstream for transit time; 5D/3D for Doppler)
- What is the vibration and noise environment? (High vibration → evaluate transit time vulnerability; conduct field SQI test)
- What temperature and pressure ranges will the meter experience across all seasons and operating modes?
Scored Decision Matrix: Doppler vs. Transit Time
Table 4: Scored Decision Matrix — Doppler vs. Transit Time Technology Selection. Use this matrix with customer application data to generate a defensible, systematic technology recommendation. For a full decision-tree tool, see the Jade Ant Instruments Flow Meter Selection Guide.
9. Implementation Best Practices and Optimization
Pre-Installation Planning and Assessment
Fluid Sampling and Acoustic Characterization
Before any meter is specified, the fluid must be characterized. For transit time applications, the key measurements are: TSS (total suspended solids, in mg/L), dissolved gas content (%), fluid temperature range across all operational modes, and fluid composition for speed-of-sound table selection. For Doppler applications: TSS concentration and variability, particle size distribution (D50 and D90 values), and whether solids content is consistent or seasonally variable.
For non-standard fluids — unusual chemical mixtures, highly saline water, cryogenic media outside standard tables — laboratory acoustic characterization measuring the actual speed of sound and acoustic attenuation coefficient at the operating temperature and pressure is required. This 1–2 day laboratory procedure prevents months of field troubleshooting. The MDPI systematic review of transit time flow meter performance (2025) identifies fluid characterization as the single most impactful factor in installation accuracy outcomes.
Site Evaluation: The 6-Point Field Assessment Protocol
- Pipe OD measurement: Use a pi tape on the actual pipe — do not use nominal sizes. A 1 mm OD error on DN100 introduces ~2% velocity offset.
- Wall thickness check: Ultrasonic thickness gauge at 4 points around the circumference. Non-uniform wall (>15% variation) indicates corrosion requiring evaluation.
- Pipe material and lining confirmation: Rubber-lined, bitumen-lined, or concrete-lined = non-viable for standard clamp-on. Verify physically, not from drawings.
- Straight run measurement: Measure actual upstream (to nearest elbow, valve, pump) and downstream (to nearest disturbance) distances. Document in pipe diameters.
- Vibration and noise survey: Note nearby pumps, compressors, and mechanical mixers. High vibration sites may require isolation brackets or alternative location.
- SQI field test: If a portable meter is available, perform a 10-minute Signal Quality Index test at the intended location before finalising the specification. SQI >60%: viable. SQI <50%: investigate or relocate.
Transducer Positioning, Alignment, and Commissioning
Doppler Transducer Angle Optimization
Doppler transducers are typically mounted at 45° to the pipe axis on the side or bottom of the pipe (not the top, where gas bubbles accumulate). On large-diameter pipes (DN600+), some manufacturers recommend angling the transducer slightly toward the pipe centreline to maximise the beam’s overlap with the fully turbulent core of the flow, where particle concentration and velocity are most representative. The manufacturer’s mounting jig should always be used — freehand mounting at an incorrect angle degrades accuracy by 2%–8%.
Transit Time Transducer Spacing and Mounting Modes
Transit time clamp-on meters use two mounting geometries: V-mode (both transducers on the same side of the pipe; the signal bounces off the opposite wall) and Z-mode (transducers on opposite sides; direct path). V-mode works for most pipes up to DN500; Z-mode is preferred for large pipes (DN500+) or when pipe wall conditions reduce signal in V-mode. Transducer spacing (the distance between the two units along the pipe axis) is calculated from the pipe OD, wall thickness, and speed of sound — values that must be entered precisely into the meter’s configuration. Any error in these inputs introduces a proportional systematic offset in all subsequent readings.
Factory and Site Acceptance Testing
Factory Acceptance Testing (FAT) verifies meter performance against traceable calibration standards before shipment. Site Acceptance Testing (SAT) verifies performance in the actual installation environment against a calibrated reference meter. Both tests should be formally documented with calibration certificates traceable to national measurement standards (NIST in the US, PTB in Germany, NPL in the UK). For any application subject to regulatory compliance — water utility billing, pharmaceutical batch accounting, or environmental discharge monitoring — SAT documentation is a regulatory requirement, not an option.
Ongoing Optimization and Maintenance
Table 5: Recommended Maintenance Schedule — Doppler and Transit Time Ultrasonic Flow Meters. Calibration intervals may be mandated by regulatory authority; always verify local requirements.
10. Future Trends and Technology Evolution

The next generation of ultrasonic flow meters integrates edge computing, AI signal processing, and cloud connectivity — transforming passive measurement devices into active, predictive assets in plant-wide digital intelligence networks. The intelligent flow meter market is projected to grow from USD 3.5–4.5 billion in 2025 to USD 8.5–10.5 billion by 2035.
Hybrid and Multi-Path Systems
The commercial boundary between Doppler and transit time is dissolving. Leading manufacturers are now offering dual-mode clamp-on meters that automatically select between transit time and Doppler operation based on real-time signal quality index readings. When the fluid is clean, the meter runs in transit time mode at ±0.5%–±1.0% accuracy. When suspended solids rise above the transit time threshold, the meter seamlessly switches to Doppler mode at ±2%–±5%. For processes with variable fluid quality — partial treatment systems, upset-condition monitoring, or pre/post-filtration measurement — this adaptive capability eliminates the forced choice between technologies.
Multi-path clamp-on systems (2–4 acoustic paths at different positions across the pipe cross-section) are narrowing the accuracy gap between clamp-on and inline configurations. Dual-path clamp-on transit time meters now routinely achieve ±0.5% on well-characterised pipes, opening custody transfer sub-applications in water utilities and district energy that previously required inline spool-piece meters. The Jade Ant Instruments non-invasive meter comparison guide covers this evolving multi-path configuration landscape in detail.
Digital Integration, IoT, and AI-Powered Signal Processing
Modern clamp-on transmitters now publish not just flow rate and totalised volume, but also real-time diagnostic parameters — SQI trend, velocity of sound in the fluid (which can flag composition changes), flow profile symmetry, and noise floor levels — over Modbus TCP/IP, OPC UA, or cloud API directly to plant data historians (OSIsoft PI, Ignition) or cloud analytics platforms (Azure IoT, AWS IoT Core). This transforms the ultrasonic meter from a passive measurement device into an active asset health monitor.
AI-assisted signal processing algorithms embedded in edge-computing firmware now detect couplant degradation 30–60 days before it crosses the accuracy threshold, flag unusual flow patterns attributable to partial valve closure or pump cavitation within seconds of occurrence, and guide field technicians through installation optimisation via smartphone apps — eliminating the most common installation error sources. According to MarketsandMarkets (2025), the intelligent flow meter segment grows to USD 8.5–10.5 billion by 2035, with ultrasonic technology capturing the largest share of that growth.
Regulatory Drivers and Market Expansion
Two regulatory trends create structural demand growth for both technologies simultaneously. ISO 50001 energy management certification — now required or incentivised by government programmes in over 40 countries — mandates continuous measurement of significant energy flows, including heating and cooling circuits where transit time is the standard. Stricter wastewater discharge regulations across Asia-Pacific, the Middle East, and Latin America are driving demand for affordable Doppler measurement on sewage and industrial effluent lines in markets where legacy manual monitoring was previously the norm. For distributors building a portfolio that serves both clean and dirty fluid applications — as Instrumentos Jade Ant does across both transit time and Doppler product lines — this regulatory tailwind creates a multi-year expansion opportunity with strong recurring business from maintenance contracts and periodic sensor replacement.
Making Your Technology Decision

The distributor who can walk a customer through a systematic, data-driven technology selection — using fluid characterization, the decision matrix, and application-specific TCO analysis — wins the specification, the installation contract, and the maintenance relationship. Technical depth is the sustainable competitive advantage in this market.
Key Takeaways for B2B Decision-Makers
The choice between Doppler and transit time is not a preference — it is a physics decision driven by the characteristics of the fluid. Doppler excels in high-particle environments (wastewater, slurry, pulp and paper, aerated process streams) where transit time fails to acquire a signal. Transit time dominates in clean fluid applications and any measurement that carries financial or regulatory consequences — billing, custody transfer, pharmaceutical process control, precision chemical dosing.
Total cost of ownership over 5–10 years almost always favours clamp-on configurations over inline — and both clamp-on technologies (Doppler and transit time) are dramatically cheaper to own than the wetted meters they replace in their respective application domains. The case study data is consistent: Doppler meters save $40,000–$50,000 per measurement point annually in abrasive slurry service compared to electromagnetic meters; transit time meters recover millions in non-revenue water for utilities that deploy them systematically across their distribution networks.
Use the diagnostic questions, decision matrix, and TCO tables in this guide to systematically evaluate every application before making a recommendation. Conduct a fluid characterization for borderline cases. Perform an SQI field test when pipe condition is uncertain. Build the TCO calculation using the customer’s real production values and contractor rates — it closes more specifications than any brochure.
Ready to Select the Right Ultrasonic Technology for Your Customers?
The Jade Ant Instruments technical team is available to provide free application assessments, customised performance projections, and implementation guidance for your specific fluid, pipe, and accuracy requirements — whether Doppler, transit time, or a hybrid approach.
Key Terms Glossary
- Doppler Shift (Doppler Effect)
- The change in frequency of a wave when the source and observer move relative to each other. In flow measurement: the reflected ultrasonic frequency is higher or lower than transmitted depending on particle velocity. The shift magnitude is proportional to fluid velocity. Example: An ultrasonic beam at 1 MHz transmitted into a wastewater stream at 1.5 m/s carrying 200 mg/L solids reflects back at 1.000,002 MHz — the tiny frequency difference is converted to a flow reading.
- Transit Time (Time-of-Flight)
- The measurement principle where the time difference (Δt) between ultrasonic pulses sent upstream and downstream through a clean fluid is used to calculate fluid velocity. Example: On a DN200 clean water line at 1 m/s, the Δt between upstream and downstream pulses is approximately 100–200 nanoseconds — detected with nanosecond-precision electronics.
- TSS (Total Suspended Solids)
- The concentration of all particulate matter suspended in a fluid, measured in mg/L or ppm. The primary parameter determining whether Doppler or transit time technology is appropriate. Below 100 ppm: transit time territory. Above 200 ppm: Doppler territory. 100–200 ppm: borderline — requires field SQI test and specialist review.
- Signal Quality Index (SQI)
- A real-time 0–100% transmitter diagnostic indicating the strength and quality of the received ultrasonic signal. >60%: reliable measurement confirmed. <50%: investigate pipe condition, couplant quality, and transducer alignment before commissioning. The single most important field indicator of installation quality.
- Acoustic Impedance
- The product of fluid density and speed of sound — a fundamental property determining how efficiently ultrasonic energy is transmitted across interfaces (pipe wall to fluid). Large mismatches in acoustic impedance (e.g., between steel and rubber lining) cause near-total reflection of ultrasonic energy, making measurement impossible.
- Clamp-On (Non-Invasive) Installation
- A mounting method where transducers attach to the outside of the pipe without any pipe penetration. No pipe cutting, no process shutdown, no new leak points. Applicable to both Doppler and transit time clamp-on meters. The installation method of choice for brownfield retrofit applications.
- Transferência de custódia
- Any flow measurement used as the legal basis for commercial transactions — buying and selling gas, oil, water, or district energy. Custody transfer meters must meet stringent accuracy standards (AGA-9 for gas: ±0.25%; ISO 4064 Class 2 for water: ±2%) and are typically multi-path inline transit time configurations. Doppler meters are not approved for custody transfer in any major jurisdiction.
- V-Mode vs. Z-Mode (Transit Time)
- Two geometric mounting configurations for transit time clamp-on transducers. V-mode: both transducers on the same side of the pipe; the acoustic signal bounces off the opposite wall. Used for most pipes up to DN500. Z-mode: transducers on opposite sides of the pipe; direct acoustic path. Preferred for large-diameter pipes (DN500+) or when V-mode SQI is insufficient.
Perguntas frequentes
Detailed answers covering every technical and commercial question that distributors, engineers, and procurement managers ask when evaluating Doppler vs. transit time ultrasonic flow meter technology.
About Jade Ant Instruments: Instrumentos Jade Ant is an ISO-certified flow meter manufacturer and solution provider with 15+ years of precision measurement experience across industrial sectors worldwide. Our product range covers Doppler and transit time ultrasonic flow meters, electromagnetic flow meters, vortex meters, turbine meters, and thermal mass flow meters — with OEM/ODM customisation, HART/Modbus/4–20 mA outputs, and ATEX/IECEx certifications. We partner with distributors and agents globally to deliver technical depth alongside competitive factory-direct pricing. Contact us at info@jadeantinstruments.com or visit our contact page for a free application assessment.