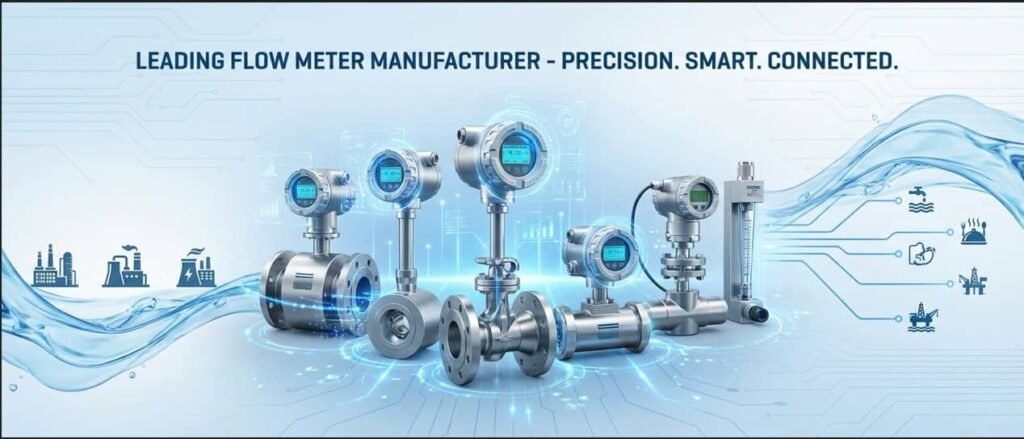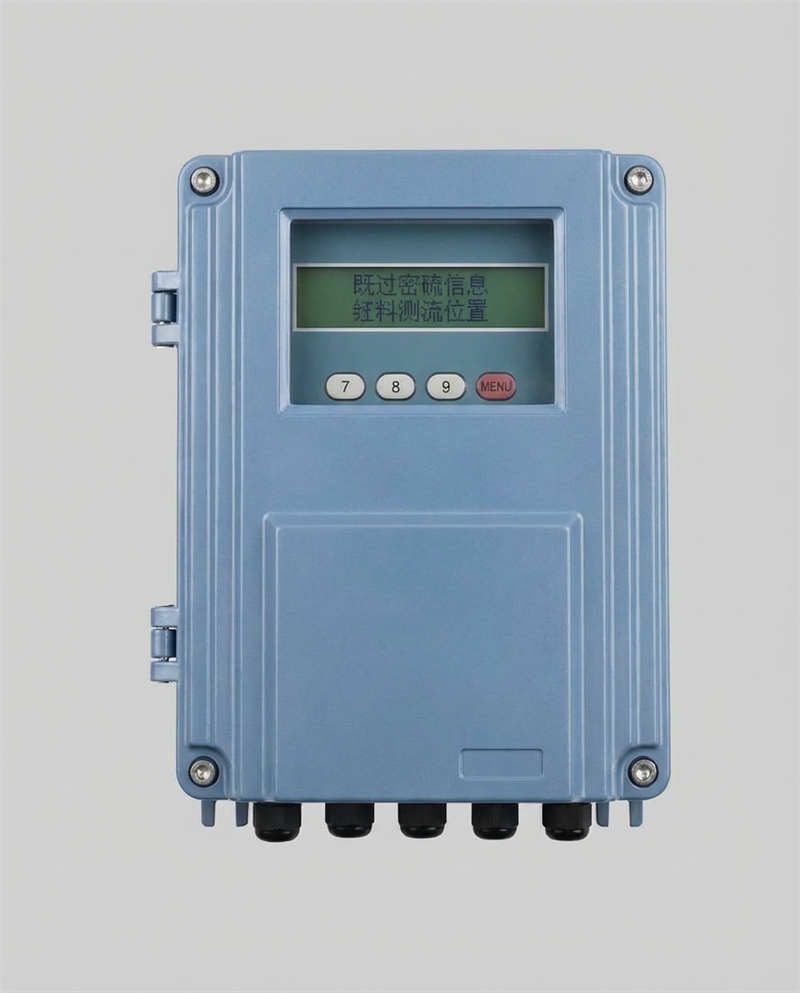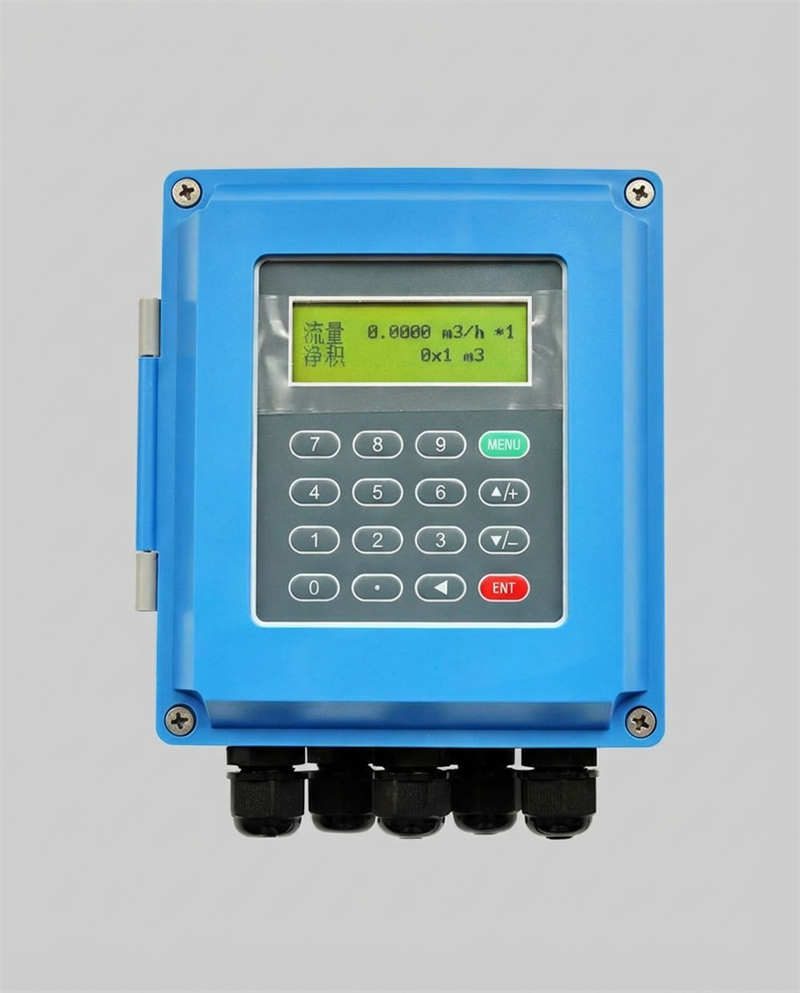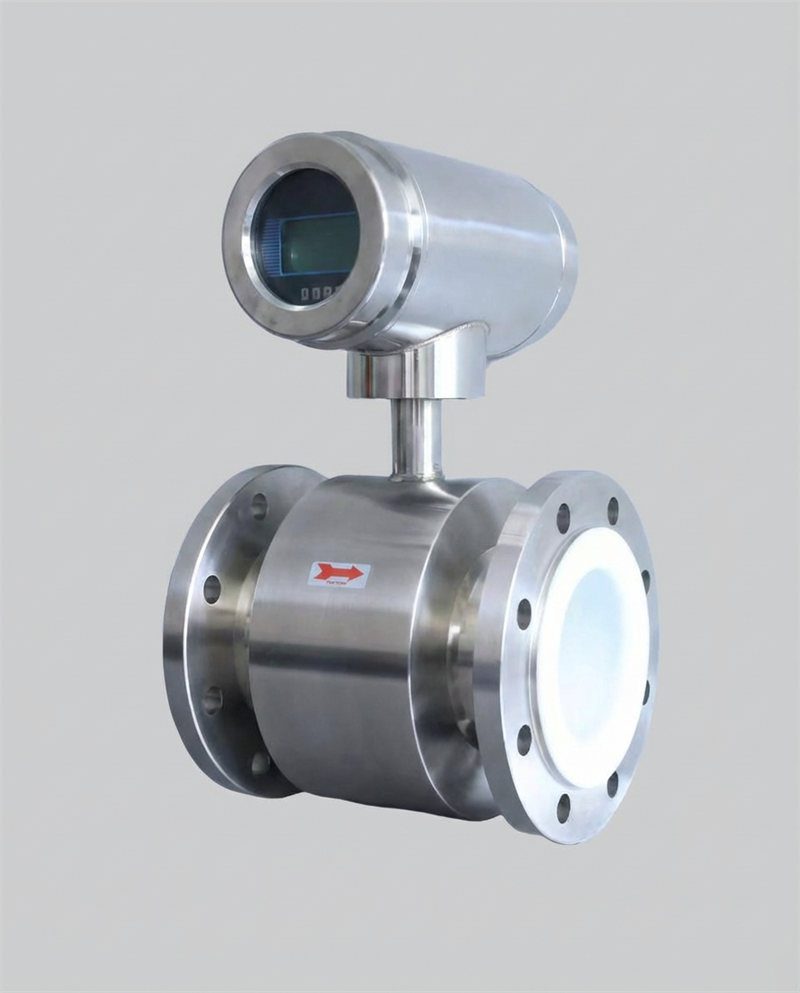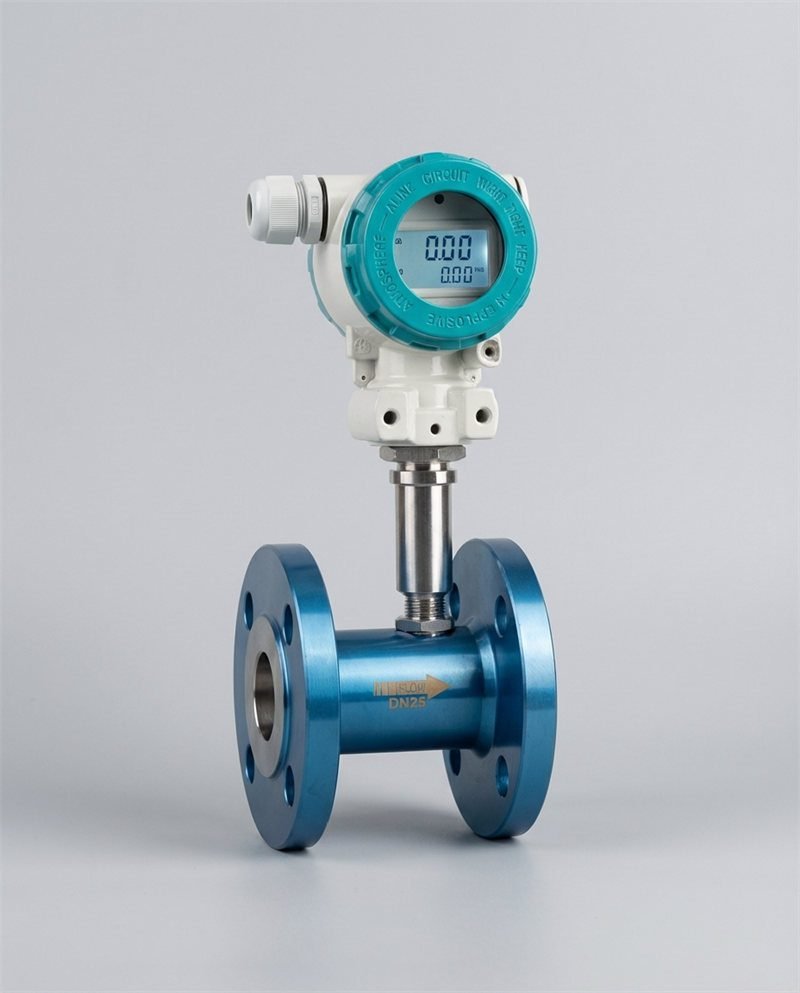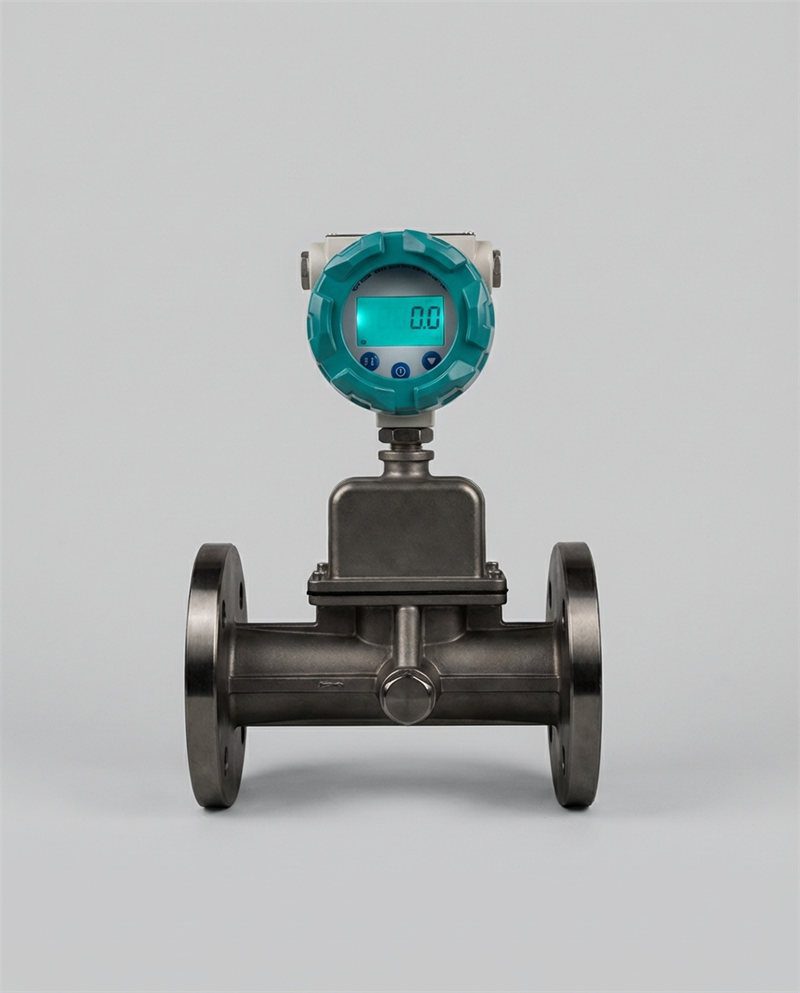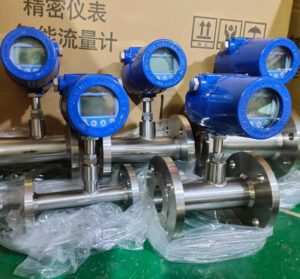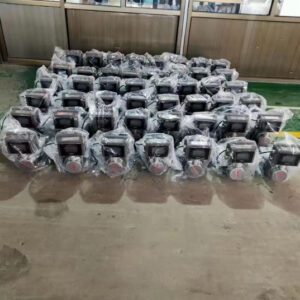
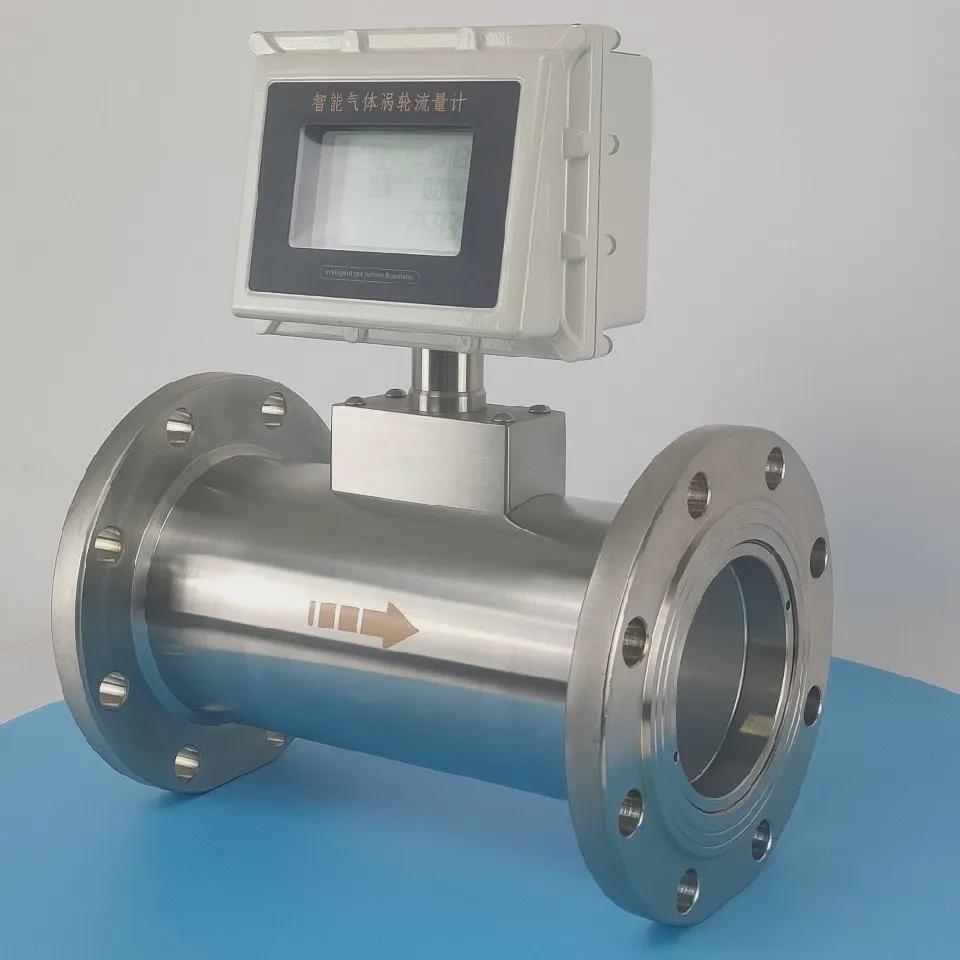
Image: Advanced gas metering verification in an industrial pipeline environment.
1. Why Flow Accuracy Matters Now More Than Ever
Gas metering used to be straightforward: install the meter, read the number, send the invoice. That era is over.
Today, a single percentage point of uncorrected flow drift on a large custody transfer line can translate into tens of thousands of dollars in annual billing discrepancy—quietly eroding margins, triggering disputes, and putting regulatory compliance at risk. For OEMs building gas skid systems, instrument distributors supplying metering equipment, EPC firms integrating gas measurement into plant infrastructure, MRO teams maintaining meter fleets, and municipal utilities operating city gate stations, the consequences of flow inaccuracy are no longer theoretical. They are line items.
Consider this: a gas distribution utility operating 42 city gate stations discovered, during a routine audit, that systematic drift across their fleet had gone undetected for 14 months. The financial impact exceeded $1.2 million in unbilled gas. The cause was not meter failure. It was the absence of a structured, monthly flow verification protocol.
This guide exists because that gap is preventable.
What “flow accuracy” actually means in practice: Flow accuracy is a measure of how close a meter’s reading is to the actual volume or mass of gas passing through it—expressed as a percentage of the true value. A meter rated at ±0.5% accuracy that drifts to ±2.8% is not broken. It is degraded. And it will keep producing plausible-looking numbers until someone runs a structured check. The term measurement uncertainty (the total range of doubt around a measurement result, including meter error, sensor error, and environmental effects) becomes operationally critical when custody transfer or regulatory reporting is involved.
Who this guide is for and why it matters to your role:
- OEM / Skid manufacturers: Learn how to design flow verifiability into your products from the ground up—reducing field service calls and increasing customer retention.
- Instrument distributors / importers: Build a structured verification capability that turns you from a product supplier into a trusted technical partner.
- EPC / System integrators: Understand how to configure SCADA platforms and meter management systems to automate drift detection.
- Industrial terminal / MRO companies: Get a practical maintenance framework that reduces emergency callouts and extends meter service life.
- Municipal / Utility companies: Align your meter management practices with AGA, ISO, and API standards—and protect your revenue.
2. The Hidden Cost of Flow Drift: What Your Current Checks Might Be Missing
Most calibration schedules are built around a single question: Is the meter within specification at calibration time? That question, answered once per year, misses everything that happens in between.
The gap between calibrations is where money is lost.
Real-world gas metering environments introduce degradation mechanisms that standard annual calibration cycles were never designed to catch early:
- Particulate buildup on turbine rotor bearings gradually changes the K-factor (the calibration constant that converts rotor pulses into volumetric flow), producing increasing under-registration.
- Temperature cycling at outdoor installations causes thermal expansion and contraction of vortex meter bluff bodies, shifting their Strouhal number (the dimensionless ratio that relates vortex shedding frequency to flow velocity) and introducing systematic measurement bias.
- Pressure transients from compressor starts, valve slams, or line pigging create momentary hydraulic shocks that fatigue piezoelectric vortex sensors over hundreds of cycles—long before any single event is severe enough to trigger an alarm.
- Gas composition changes—a supplier switching from dry pipeline-quality gas to a blend with higher inert content during seasonal supply variation—alter the thermal properties that thermal mass flow meters depend on, producing systematic reading offsets without any change to the meter itself.
What the numbers say: Industry data from flow meter service organizations indicates that between 35% and 55% of gas meters found out of specification at annual calibration had drifted progressively from a point that would have been detectable—and correctable—at lower cost—if a structured monthly verification had been in place. The turbinesincorporated.com analysis of flow meter drift causes documents the principal physical mechanisms: mechanical wear, fouling, thermal effects, and electronic aging—all of which operate continuously between calibrations.
Introducing predictive flow verification: Rather than treating flow accuracy as a binary pass/fail state (calibrated vs. uncalibrated), predictive flow verification treats it as a continuous health parameter. Monthly structured checks generate trend data. Trend data reveals degradation rates. Degradation rates enable intervention scheduling—before the meter drifts outside specification, before the billing dispute, before the audit finding.
This is not a theoretical improvement. It is a documented operational practice that measurably reduces total cost of ownership for gas metering infrastructure.
3. 10 Critical Structures for Advanced Monthly Flow Verification
The following ten verification checkpoints are designed to be embedded into monthly maintenance workflows. They are ordered to move from the simplest, fastest checks (which resolve the majority of issues without specialist equipment) to the more technically demanding validations that confirm system-wide accuracy.
Terminology note: Qmax = the maximum rated flow of the meter at which its accuracy specification applies. Signal-to-noise ratio (SNR) = a measure of how clearly the meter’s sensor signal stands above background electrical or acoustic noise—a declining SNR is an early indicator of sensor degradation.
| ステップ | Checkpoint | What You Are Looking For | Typical Duration | Who Performs It |
|---|---|---|---|---|
| 1 | Baseline Performance Benchmarking | Deviation from documented commissioning-day reference readings at 3 flow points | 20 min | Field technician |
| 2 | Zero-Flow Integrity Test | Non-zero reading when the line is fully shut in (indicates leakage or sensor bias) | 10 min | Field technician |
| 3 | Multi-Point Flow Validation (10%, 50%, 90% Qmax) | Linearity across operating range; confirm accuracy holds at low and high flow | 30–45 min | Field technician + supervisor |
| 4 | Diagnostic Data Extraction | Signal strength, SNR, drive gain, pickoff amplitude (accessed via HART communicator) | 15 min | Supervisor |
| 5 | Pressure & Temperature Sensor Cross-Check | Agreement between meter’s integrated PT sensors and independent calibrated references (within ±1°C and ±0.5% of span) | 15 min | Field technician |
| 6 | Acoustic Noise Profiling (Ultrasonic Meters) | Elevated noise level that may indicate entrained gas, condensate, or upstream turbulence | 10 min | Supervisor |
| 7 | Flow Profile Symmetry Analysis | Asymmetric velocity profile caused by upstream elbows, reducers, or partially closed valves within the required straight-pipe run | 20 min | Engineer |
| 8 | Repeatability Assessment | Standard deviation across five consecutive readings at the same flow point should not exceed 0.1% for custody transfer meters | 20 min | Supervisor |
| 9 | Environmental Stress Simulation | Performance under documented extremes of ambient temperature and line pressure expected at the site | 30 min | Engineer |
| 10 | Digital Twin Comparison (Smart Meters) | Deviation between live meter output and the calibrated process model—>0.3% deviation triggers investigation | 20 min | Engineer / Integrator |
How to use this structure operationally:
Steps 1–5 are executable by a trained field technician with a HART communicator, a calibrated pressure gauge, and a reference thermometer. They take under 90 minutes and will catch the majority of issues before they progress.
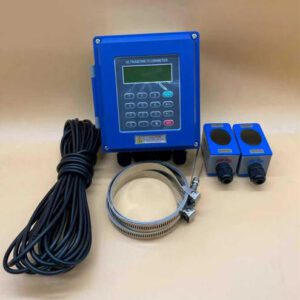
Steps 6–8 require a supervisor-level understanding of the meter technology and access to portable diagnostic equipment (clamp-on ultrasonic meter for reference, data logger).
Steps 9–10 are engineering-level validations appropriate for quarterly or semi-annual deeper reviews, or triggered by anomalies found in Steps 1–8.
For OEMs embedding these checks into skid commissioning and handover packages, Steps 1–5 form the minimum acceptance test. For MRO teams, the full ten-step sequence forms the annual re-verification protocol—with Steps 1–5 performed monthly.
4. Early Warning Signs: How to Spot Drift Before It Impacts Performance
Waiting for a customer complaint or an audit finding to trigger a drift investigation is operationally equivalent to waiting for a tire to go flat before checking the pressure. By then, the cost is already incurred.
Train your field teams and your customers’ maintenance staff to recognize these leading indicators:
1. Gradual volume imbalances that don’t have a process explanation
In systems with supply and delivery meters (inlet and outlet measurement on the same gas segment), the difference between inlet and outlet readings—called line pack variation or unaccounted-for gas—should be close to zero under steady-state conditions. A trend of increasing imbalance, consistent in direction, is a strong early indicator of calibration drift in one of the meters.
2. Rising standard deviation in daily flow readings
A meter whose daily readings show increasing scatter—higher standard deviation without any change in actual process variability—is exhibiting early-stage sensor degradation or electrical noise ingress. This pattern is detectable only if someone is tracking the data systematically.
3. Increasing diagnostic alarm frequency
Modern gas meters log diagnostic events internally. A meter generating two to three HART diagnostic alerts per month that generated none six months ago is telling you something is changing. The nature of the alarm—low signal quality, drive gain anomaly, temperature sensor out of range—points directly to the degradation category.
4. Discrepancies between primary and backup meters
Where redundant or check meters are installed (as required by API MPMS Chapter 21 for fiscal measurement), a growing divergence between the primary and the check meter is an unambiguous signal. Neither meter failing a formal calibration check does not mean neither meter has drifted—two meters can drift in the same direction, with their divergence being smaller than the drift of either.
5. Increased maintenance activity on upstream valves or regulators
A pressure regulator that is being adjusted more frequently than usual, or a valve that is developing seat wear, changes the flow dynamics reaching the downstream meter—potentially introducing turbulence, pulsation, or pressure variability that the meter was not designed to measure. Upstream mechanical changes are flow meter events.
For municipal utilities and EPC firms, these five indicators integrate naturally into a SCADA-based meter health dashboard, where threshold alerts can be configured to notify operations staff automatically when any indicator crosses its watch threshold.

Image: A typical gas metering skid installation — the environment where monthly flow checks deliver their highest ROI.
5. Best Practices for Training Internal Teams on Flow Verification
The most sophisticated verification protocol in the world delivers nothing if the people performing it do not understand what they are doing or why. Technical training for flow verification is not a one-time onboarding event. It is a structured, tiered capability that must be built deliberately.
The tiered training model:
Level 1 — Field Technicians
Field technicians perform Steps 1–5 of the monthly verification protocol. Their training must cover:
- Physical inspection of meter body, connections, and display status
- Operation of a HART communicator to access meter diagnostics
- Correct use of a portable calibrated pressure gauge and reference thermometer
- Documentation requirements: what to record, how to record it, and when to escalate
- Lock-out/tag-out (LOTO) procedures specific to gas metering systems
Practical, hands-on training on the actual meter models in their portfolio is more effective than classroom instruction. A half-day of meter-bench training with a HART communicator produces more competent technicians than a full day of slide presentations.
Level 2 — Supervisors
Supervisors review technician data, identify trends, and perform Steps 6–8. Their training must cover:
- Trend analysis: how to distinguish random variation from systematic drift
- Technology-specific failure modes: what a declining signal-quality index means for an ultrasonic meter versus a Coriolis meter
- Reference measurement techniques: using a portable clamp-on ultrasonic meter as a field reference
- Escalation criteria: when to escalate to engineering versus when to schedule maintenance
Level 3 — Engineers and System Integrators
Engineers validate system-level accuracy, prepare audit documentation, and perform root cause analysis. Their training must cover:
- Measurement uncertainty analysis: how to calculate combined uncertainty from meter error, sensor error, and environmental effects
- Compliance documentation: AGA Report No. 7, 9, and 10; ISO 17089; API MPMS Ch. 21 audit trail requirements
- Digital twin configuration and calibration
- Flow profile analysis using multipath ultrasonic diagnostic data
For instrument distributors: Offering a certified Level 1 training course to your end-user customers is a significant service differentiator. Customers whose maintenance teams are competent at Level 1 checks call you for less emergency support—and they trust you more, because you taught them. They are also substantially more loyal.
Scenario-based drills using real field data cases (anonymized) are the most effective training format. A technician who has worked through a simulated “meter reads 8% low, find the cause” exercise with real diagnostic data will recognize the same pattern in the field faster and with more confidence than one who has only read about it.
6. Integration with SCADA and Asset Management Systems
A flow check performed in the field and recorded on paper provides value only to the people who can access that piece of paper. Integration with SCADA (Supervisory Control and Data Acquisition) and asset management platforms transforms individual verification events into a continuous, searchable, alert-capable data stream.
How to configure automated drift detection in SCADA:
For EPC firms and system integrators, the practical implementation involves three layers:
- Data acquisition: Configure the SCADA system to log key meter diagnostic parameters—signal quality index, drive gain (for Coriolis meters), flow velocity profile symmetry (for multipath ultrasonic meters)—at a polling interval appropriate to the application (15-minute averages for trend analysis; 1-minute logging during verification events).
- Alert thresholds: Define soft alerts (warning: parameter trending toward limit) and hard alerts (action required: parameter outside operating envelope). Soft alerts trigger a scheduled verification check. Hard alerts trigger immediate investigation. The threshold values come from the meter manufacturer’s documentation and the application’s accuracy requirements.
- Historical trending and compliance reporting: SCADA historians that archive meter diagnostic data enable two capabilities: automated compliance report generation (required for AGA and API audit submissions) and retrospective analysis when a discrepancy is discovered—allowing engineers to pinpoint when drift began and at what rate.
Protocols that make integration reliable:
| プロトコル | Best Use Case | Data Rate | Notes |
|---|---|---|---|
| HART (4–20 mA overlay) | Retrofit integration of existing analog meters | Low (poll-on-demand) | Requires HART multiplexer for multi-meter sites |
| Modbus RTU/TCP | PLC and DCS integration in industrial facilities | 中 | Widely supported; simple configuration |
| OPC UA | Plant-wide IIoT integration and historian systems | 高 | Supports structured data, security layers |
| WirelessHART | Remote or hard-to-wire locations | Low-medium | Battery life consideration in cold climates |
について OPC UA integration framework provides vendor-neutral, secure communication between field devices and enterprise-level systems—making it the preferred choice for new greenfield metering installations where cross-vendor interoperability is a requirement.
For municipal utilities with legacy installed base, Modbus TCP provides the most accessible integration path without requiring meter replacement. A HART-to-Modbus gateway installed at the city gate panel can expose all meter diagnostic data to an existing SCADA historian at a fraction of the cost of a hardware upgrade.
7. OEM Design Considerations: Building Flow Verifiability into Skids
If flow verification is difficult to perform, it will not be performed consistently. This is not a statement about operator discipline—it is a statement about human behavior. Verification activities that require line shutdowns, specialized tooling, or complex access to meter internals will be deferred under operational pressure. The OEM’s design decisions made months before the skid reaches the field determine whether verification becomes routine or exceptional.
Design features that reduce verification time and cost:
Integrated test ports and isolation valves
Verify flow accuracy without interrupting production by installing calibrated bypass circuits with isolation valves that allow a portable reference meter to be connected in series with the installed meter. The cost of a 1-inch test port manifold at the design stage is approximately $200–$500. The cost of retrofitting one post-installation to avoid a process shutdown is $2,000–$8,000.
Onboard calibration simulators
Some meter transmitters support a built-in simulation mode that generates a known, stable output signal—allowing the signal chain from meter output to SCADA display to be verified without actual flow. This does not replace a hydraulic flow check, but it rapidly eliminates the signal chain as a source of discrepancy, reducing diagnostic time significantly.
Standardized data export formats
Specify meters with Modbus TCP or OPC UA outputs as the standard, and document the register map in the skid databook. This enables any of your downstream customers—regardless of their DCS or PLC brand—to integrate meter diagnostics into their existing monitoring infrastructure without specialist programming.
Remote access capability
For skids deployed in remote locations—pipeline compressor stations, offshore platforms, tank farm terminals—built-in cellular or Ethernet-based remote access to meter diagnostics reduces site visits from monthly to quarterly or less. The investment in remote access hardware (typically $500–$1,500 per meter point) pays back in travel cost avoidance within the first year for genuinely remote installations.
The business case for OEMs: Skids designed for easy verification carry a lower total cost of ownership for the end user. Lower TCO is a differentiator in competitive bid evaluations. OEMs who document verifiability features—test port locations, simulation capabilities, remote access architecture—in their bid submissions are addressing a real concern of the experienced EPC and utility buyer.
8. Case Study: Municipal Utility Reduces Billing Disputes by 68%
The situation:
A North American gas distribution utility operated 42 city gate metering stations, each equipped with turbine gas meters measuring supply gas from the interstate pipeline into the local distribution network. Annual calibration was performed by a third-party calibration contractor. Between calibrations, no structured verification was conducted.
In the 18 months before program implementation, the utility had logged 23 formal billing disputes with the interstate pipeline supplier, resolved through negotiated settlements averaging $34,000 each—a total of $782,000 in adjustment costs, plus significant internal staff time and legal fees.
A post-mortem analysis of the 23 disputes found that in 17 cases, the root cause was measurable meter drift that had occurred between annual calibrations. In 12 of those 17 cases, the drift pattern was retrospectively detectable in the daily flow data—the signature had been there; no one had been looking for it.
The program:
The utility implemented a monthly flow verification program across all 42 stations, structured around Steps 1–5 of the verification protocol described in Section 3. The program required:
- Three additional field technician days per month across the fleet (approximately 45 minutes per station)
- HART communicators at each district operations office (one per office, shared across the station fleet)
- A data logging spreadsheet integrated into the utility’s existing asset management system
Total annual program cost: approximately $68,000 (labor, equipment, training).
The outcome:
Over the following 24 months:
- Billing disputes were reduced from an average of 15.3 per year to 4.9 per year — a 68% reduction.
- Average dispute settlement cost was reduced because issues were caught earlier, with cleaner documentation of meter condition at the time of the discrepancy.
- Four meters that were trending toward out-of-specification drift were caught and corrected before they produced a billing discrepancy—preventing an estimated $180,000 in adjustment costs.
- Net annual savings: approximately $410,000, against a program cost of $68,000.
ROI: approximately 6:1 in Year 1, 7:1 in Year 2 (as the program produced its full effect).
The utility has since extended the program to its pressure regulation stations and is evaluating SCADA integration to automate the data logging component.
9. Compliance & Audit Readiness: Aligning with AGA, ISO, and API Standards
Regulatory and contractual compliance requirements for gas metering are not optional considerations for utilities, EPCs, or custody transfer operators. They are contractual and legal obligations that carry financial penalties for non-compliance and can affect operating licenses.
Key standards and what they require:
| 標準 | Scope | Key Verification Requirement |
|---|---|---|
| AGA Report No. 7 | Turbine gas meters for custody transfer | Periodic proving and calibration verification; documentation of as-found and as-left condition |
| AGA Report No. 9 | Multipath ultrasonic gas meters for fiscal measurement | Signal quality checks, velocity profile symmetry, periodic calibration against a traceable standard |
| AGA Report No. 10 | Speed of sound measurement for gas composition verification | Cross-check between measured and calculated speed of sound as an ongoing diagnostic |
| ISO 17089-1 | Measurement of gas flow in closed conduits (ultrasonic meters) | Defines performance requirements and verification methods for fiscal and non-fiscal applications |
| API MPMS Ch. 21 | Flow measurement using electronic measurement systems | Audit trail requirements; event log retention; alarm and configuration change documentation |
What auditors actually look for:
Regulatory auditors reviewing a gas metering operation are not primarily looking for calibration certificates. They are looking for evidence of a meter management system—documented procedures, systematic execution, and records that demonstrate the utility or operator has maintained active oversight of measurement accuracy between calibration events.
A binder containing five years of calibration certificates with nothing in between does not demonstrate a meter management system. A binder containing monthly verification logs, trending data, anomaly investigations, and corrective action records does.
Documentation templates that pass audits:
For each monthly verification event, the record should contain:
- Station/meter identification (tag number, serial number, meter model)
- Date, technician name, ambient conditions
- Results of each verification step performed (Steps 1–5 minimum)
- HART diagnostic data extract (signal quality, alarm status)
- Reference instrument used (model, serial, calibration due date)
- Conclusion: within tolerance / trending / action required
- Actions taken (if any) and verification of effectiveness
This documentation, retained for a minimum of five years (seven years for interstate pipeline measurement under FERC jurisdiction), constitutes the audit trail that demonstrates ongoing measurement integrity.
For EPC project teams, integrating this documentation framework into the commissioning and handover package—so that the end-user receives not just the installed metering system but also the documented procedures and templates to operate it—is a deliverable that differentiates technically sophisticated integrators from those who simply install hardware.
Detailed guidance on meter selection and specification for compliance applications is available through Jade Ant Instruments’ flow meter selection resource.
10. Partnering for Precision: How to Turn Flow Accuracy into a Competitive Advantage
Flow accuracy is not a maintenance task. It is a business capability.
For instrument distributors, a structured flow verification offering—training, tools, documentation support, and maintenance contracts—transforms the commercial relationship from transactional (you buy meters from us) to strategic (we help you operate your meters accurately for their entire service life). That transformation is worth money. Customers who see you as a technical partner do not re-bid their meter supply contracts on price alone.
For OEM skid manufacturers, meters designed for verifiability are a differentiator at the bid stage and a service cost reducer at the support stage. A skid with documented test ports, simulation-capable transmitters, and remote diagnostic access generates fewer field service calls and higher customer satisfaction scores over its service life.
For EPC and system integrators, a SCADA-integrated meter health monitoring system is a deliverable that end-users value and that competitors without a systematic approach cannot match. The integration work—configuring diagnostic data logging, alert thresholds, and compliance reporting templates—is a one-time effort that produces ongoing value for the life of the metering system.
For MRO teams and utilities, a monthly flow verification program is the single highest-ROI maintenance investment available in a gas metering operation. The case study in Section 8 is not an outlier. Clients across custody transfer, distribution, and process gas applications consistently report 3:1 to 5:1 ROI on structured verification programs—primarily through avoided billing disputes, reduced emergency recalibration costs, and extended meter service life.
Practical next steps by role:
- If you are a distributor or MRO team: Start with Steps 1–5 of the monthly verification protocol for your three most critical metered points. Run it for 90 days and document what you find. The data will make the case for expanding the program better than any external argument.
- If you are an OEM: Review your current skid design standard against the four verifiability features in Section 7. Identify the gap between your current design and a verifiable design, and quantify the field service call reduction achievable by closing it.
- If you are an EPC or integrator: Map your current SCADA architecture against the integration framework in Section 6. Identify which meter diagnostic parameters are currently being archived, which are not, and what threshold alerts would enable proactive intervention.
- If you are a utility: Compare your current meter management documentation against the audit readiness requirements in Section 9. Identify the documentation gaps and build a plan to close them before your next regulatory review.
ジェイド・アント・インストゥルメンツ works directly with distributors, OEMs, EPCs, and utilities to provide technically specified flow measurement instruments, application support, and calibration documentation for gas metering systems across industrial and utility applications.
For broader context on flow meter technology selection and performance benchmarking, the flow meter comparison guide at Jade Ant Instruments provides a technology-neutral starting point for evaluating metering options across custody transfer, process, and utility applications.
Watch: Field Verification of a Thermal Mass Flow Meter
The video below demonstrates a real-world field calibration verification procedure for a thermal dispersion mass flow meter—the type of check that forms the core of Steps 1–5 in the monthly verification protocol. This is a practical reference for training field technicians and for understanding what a structured on-site verification looks like in practice.
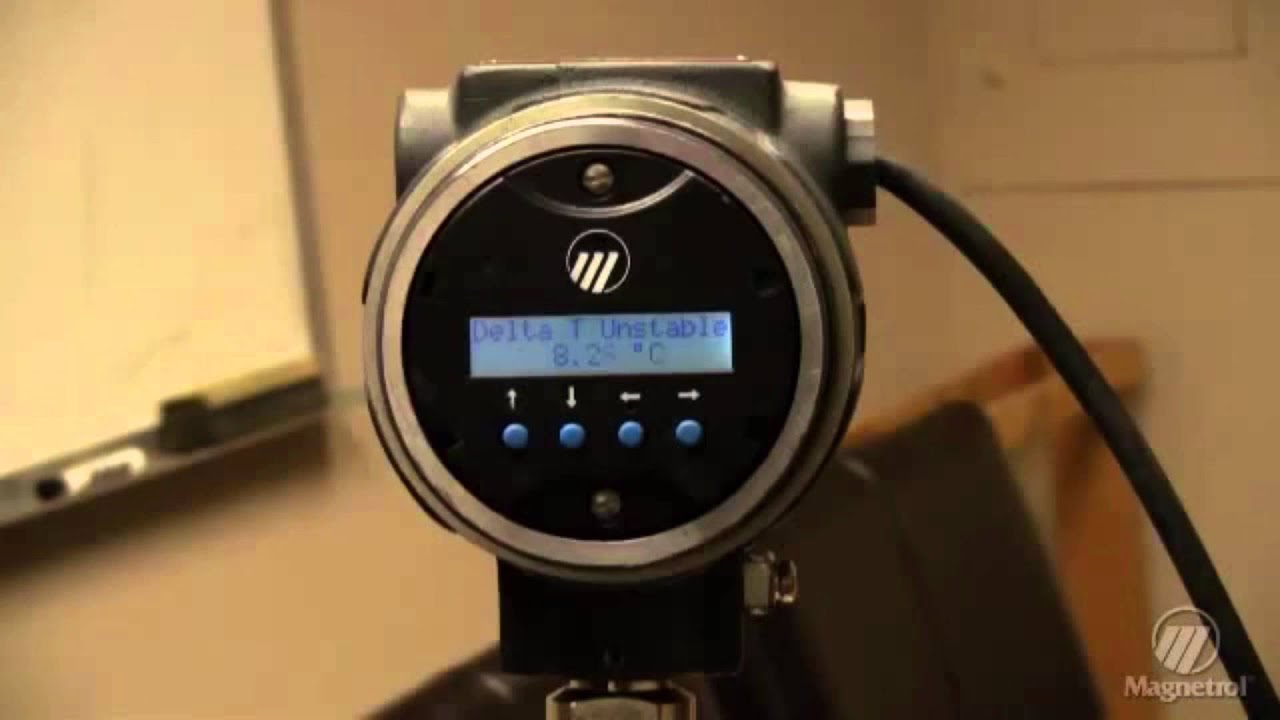
▶ Click to watch: Field Verification of a Thermal Dispersion Mass Flow Meter — a practical demonstration of on-site calibration verification methodology.

Image: Flow meter performance monitoring integrated into a SCADA control environment — turning raw data into actionable operational intelligence.
Glossary of Key Terms
| Term | Plain-Language Definition | Example |
|---|---|---|
| Flow drift | Gradual shift in a meter’s reading away from the true flow value, without any visible fault | A meter reading 1.8% high after 14 months in service, caused by bearing wear |
| K-factor | The calibration constant that converts a turbine meter’s pulse count into a volume measurement | K = 847 pulses per liter; 84,700 pulses logged = 100 liters measured |
| Qmax | The maximum flow rate at which the meter’s accuracy specification applies | A meter rated to ±0.5% at Qmax of 500 Nm³/h; flow above 500 Nm³/h is outside the accuracy guarantee |
| SNR (Signal-to-Noise Ratio) | How clearly a sensor’s measurement signal stands above background interference | A declining SNR on an ultrasonic meter indicates transducer fouling or acoustic interference |
| HART | A digital communication protocol overlaid on the standard 4–20 mA signal, allowing diagnostic data access without rewiring | A HART communicator connected at the field terminal reads drive gain, signal quality, and alarm history |
| Custody transfer | The measurement of gas (or liquid) at the point where ownership changes between two parties | The metering station at a city gate where the interstate pipeline delivers gas to the local utility |
| Measurement uncertainty | The total range of doubt around a measurement result, including meter error, sensor error, and environmental effects | ±0.25% measurement uncertainty means the true value is between 99.75% and 100.25% of the displayed reading |
| Strouhal number | A dimensionless ratio relating vortex shedding frequency to fluid velocity in a vortex flow meter | A change in the Strouhal number due to bluff body wear means the same vortex frequency now represents a different velocity |
| Drive gain (Coriolis) | A diagnostic parameter indicating how much power is needed to vibrate the Coriolis tubes; rises with increasing fluid damping from two-phase flow or coating | Drive gain rising from 15% to 34% over three months indicates progressive internal coating |
| Zero-flow integrity test | A check performed with no flow through the meter to confirm that the meter reads exactly zero; a non-zero reading at zero flow indicates a bias error | A meter reading 0.003 m³/h at zero flow has a zero-offset that adds that value to every subsequent reading |
| OPC UA | An open, vendor-neutral communication standard for industrial data exchange between field devices and enterprise systems | A gas meter with OPC UA output sends flow rate, temperature, pressure, and diagnostic data directly to the plant historian |
| API MPMS | American Petroleum Institute Manual of Petroleum Measurement Standards — the authoritative set of measurement practices for the oil and gas industry | API MPMS Chapter 21 defines requirements for electronic gas measurement audit trails |
よくある質問 (FAQ)
1. How often should we perform advanced flow checks on gas meters?
Monthly checks are the recommended minimum for custody transfer and revenue-critical applications. The monthly cadence is designed to catch early-stage drift between annual calibrations — not to replace calibration. For process gas monitoring without billing implications, quarterly checks are often sufficient. The right interval depends on the meter technology, the gas quality, and the financial and regulatory consequences of drift.
2. Can monthly flow verification replace full calibration?
No, and it is not designed to. Verification confirms that a meter is still performing within its calibrated accuracy envelope. Full calibration establishes or re-establishes the calibration reference that verification checks against. They are complementary activities. Verification without calibration eventually has no reliable standard to check against. Calibration without verification misses everything that happens between calibration events.
3. What tools are needed for in-field flow verification?
For Steps 1–5 of the monthly protocol: a HART communicator (or tablet-based HART app), a calibrated handheld pressure gauge (±0.1% accuracy), a calibrated reference thermometer (±0.5°C), a digital multimeter with 4–20 mA measurement capability, and the meter’s diagnostic parameter reference document. For reference measurement (Steps 6–7): a portable clamp-on ultrasonic meter rated for the pipe size and gas service.
4. How do we handle gas meters without built-in diagnostics?
Older meters without HART or digital communication can still be verified using external reference measurements. A clamp-on ultrasonic meter on the same pipe section provides an independent flow reading for comparison. A calibrated pressure gauge and thermometer allow compensation verification to be checked manually. For meters without any diagnostic capability, the verification scope is necessarily limited to output signal checking and reference comparison.
5. Is remote flow verification possible for gas meters?
Yes, for smart meters with digital communication. A meter equipped with HART, Modbus TCP, or WirelessHART can transmit its diagnostic parameters—signal quality, alarm status, zero-point stability, drive gain—to a remote monitoring platform continuously. Remote verification is most effective as a between-visit monitoring tool, not a substitute for periodic on-site physical inspection.
6. What are the most common causes of gas flow meter drift?
In turbine gas meters: bearing wear (changes K-factor), rotor fouling from compressor oil or particulate. In thermal mass flow meters: sensor contamination from oil vapor, moisture, or particulate deposits. In ultrasonic gas meters: transducer face fouling, acoustic signal degradation from entrained liquids or pipe wall deposits. In vortex meters: bluff body dimensional change from thermal cycling, vortex sensor contamination. Across all technologies: temperature and pressure compensation sensor drift.
7. How can OEMs design skids for easier flow verification?
Four design features make the greatest difference: (1) integrated test port manifolds with isolation valves for portable reference meter connection, (2) transmitters with onboard simulation capability for signal chain verification, (3) standardized digital outputs (Modbus TCP or OPC UA) with documented register maps, (4) provisions for remote access to meter diagnostics via Ethernet or cellular. These features add a modest amount to skid capital cost and can reduce field service costs over the skid’s operating life by significantly more.
8. Are there industry standards specifying gas flow verification frequency?
AGA Report No. 7 (turbine meters) and AGA Report No. 9 (ultrasonic meters) both recommend periodic verification as part of a meter management program, though they do not mandate a single universal interval—recognizing that appropriate frequency depends on application criticality, gas quality, and meter history. API MPMS Chapter 21 requires documented evidence of ongoing measurement system management. ISO 17089-1 defines performance verification methods. For regulated custody transfer in most jurisdictions, annual calibration with interim verification is the documented expectation.
9. How do we train field teams effectively on gas flow checks?
The three elements that produce durable competence: (1) hands-on practice with the actual meter models in service — bench training, not slides; (2) scenario-based exercises using real field data from actual diagnostic events; (3) a structured escalation framework so technicians know clearly what they can resolve at Level 1 versus what requires a supervisor or engineer. Initial training of two to three days, followed by supervised first execution of the monthly protocol, followed by quarterly competency reviews, produces field teams that resolve issues faster and escalate more accurately.
10. What is the ROI of implementing a monthly flow verification program?
The case study in Section 8 documented 6:1 ROI in Year 1 for a 42-station utility fleet. Other published industry data points to a 3:1 to 5:1 ROI range across custody transfer, process, and utility gas applications. The primary value drivers are: avoided billing disputes and their settlement costs, reduced frequency of emergency recalibration (which is substantially more expensive than scheduled verification), extended meter service life through earlier contamination detection, and improved regulatory audit outcomes. The program pays back fastest in high-volume custody transfer applications where even small drift percentages represent large absolute revenue amounts.
11. What data should we log during each monthly flow check?
At minimum: meter tag and serial number, date and technician name, ambient temperature and weather conditions, current operating flow rate and pressure, meter displayed reading, reference instrument reading (if reference measurement performed), HART diagnostic parameters (signal quality index, alarm status, zero-point reading), any anomalies observed, actions taken, and next scheduled check date. A standardized form or tablet-based logging app ensures consistency across technicians and sites.
12. How do we integrate flow verification data into an existing SCADA system?
For HART-equipped meters: use a HART multiplexer to poll diagnostic parameters on a scheduled basis and write values to the SCADA historian via Modbus or OPC DA. For Modbus TCP meters: configure polling directly from the SCADA system using the meter’s documented register map. For new installations: specify OPC UA output as the standard and configure the SCADA historian to subscribe to the meter’s OPC UA node — this provides real-time, event-driven data transfer without polling latency.
13. What is the cost of doing nothing — of not implementing monthly flow checks?
The cost of no monthly verification program is the full cost of drift that goes undetected between annual calibrations: billing discrepancies paid as settlements, regulatory findings with associated penalties, emergency recalibration costs at crisis rates, and the operational impact of meter replacements scheduled on an emergency rather than planned basis. For a utility with 20 city gate meters billing $50M per year, a fleet-average drift of 0.5% represents $250,000 per year in systematic billing error — detectable and correctable for a fraction of that cost through a structured monthly program.
14. Can we perform gas flow checks without shutting down operations?
Yes, in most cases. Multi-point flow validation using a portable clamp-on reference meter requires no shutdown and no process isolation. Zero-flow integrity tests require the line to be shut in, which can typically be scheduled during natural low-demand periods (overnight for distribution systems, between batches for process applications). For skids with integrated bypass circuits and isolation valves, even invasive verification activities can be performed without interrupting the primary flow path.
15. How do we validate the accuracy of our verification equipment itself?
Portable reference meters (clamp-on ultrasonic meters) and calibrated PT instruments must be maintained on their own calibration schedules, typically annual, traceable to national measurement standards (NIST in the United States, NPL in the United Kingdom, PTB in Germany). Every verification record should document the portable equipment used, its serial number, and its calibration due date. A verification performed with out-of-calibration reference equipment is not a valid verification — it is a measurement of unknown accuracy, which is no better than no measurement at all.
For specifications, application support, and technical consultation on gas flow metering equipment, visit ジェイド・アント・インストゥルメンツ or explore the gas flow meter troubleshooting guide for distributor and integrator reference.
Additional technical resources: AGA gas measurement standards | API MPMS documentation | ISO 17089 overview