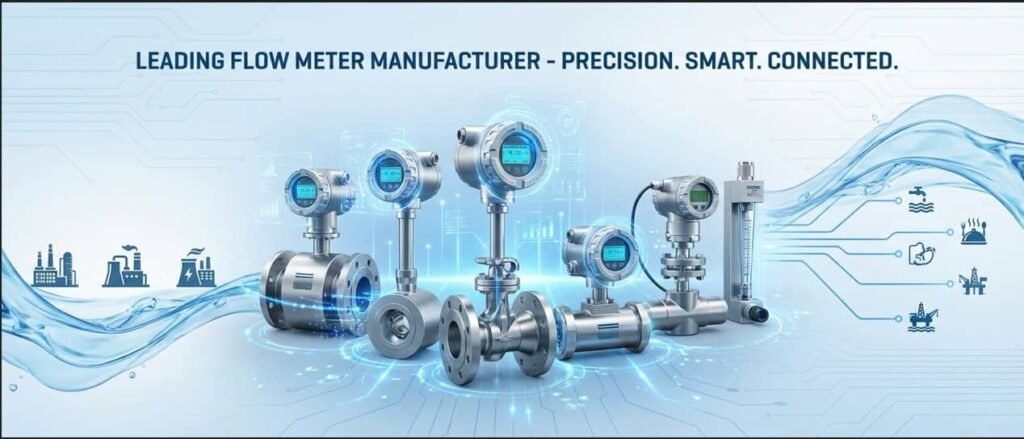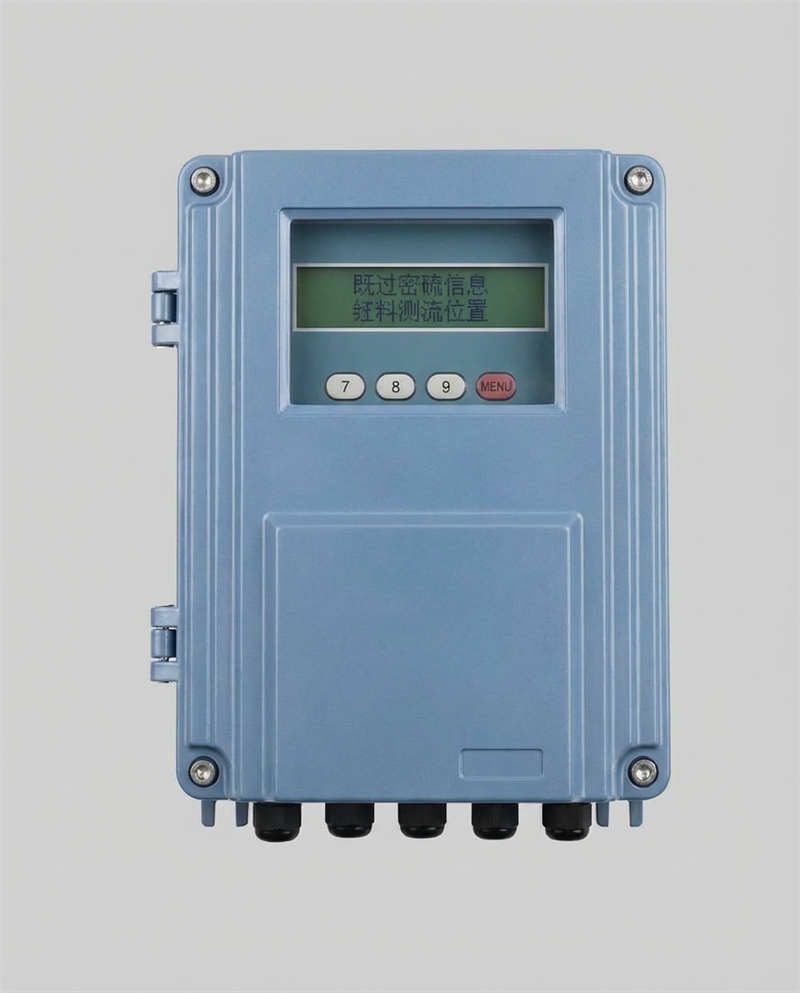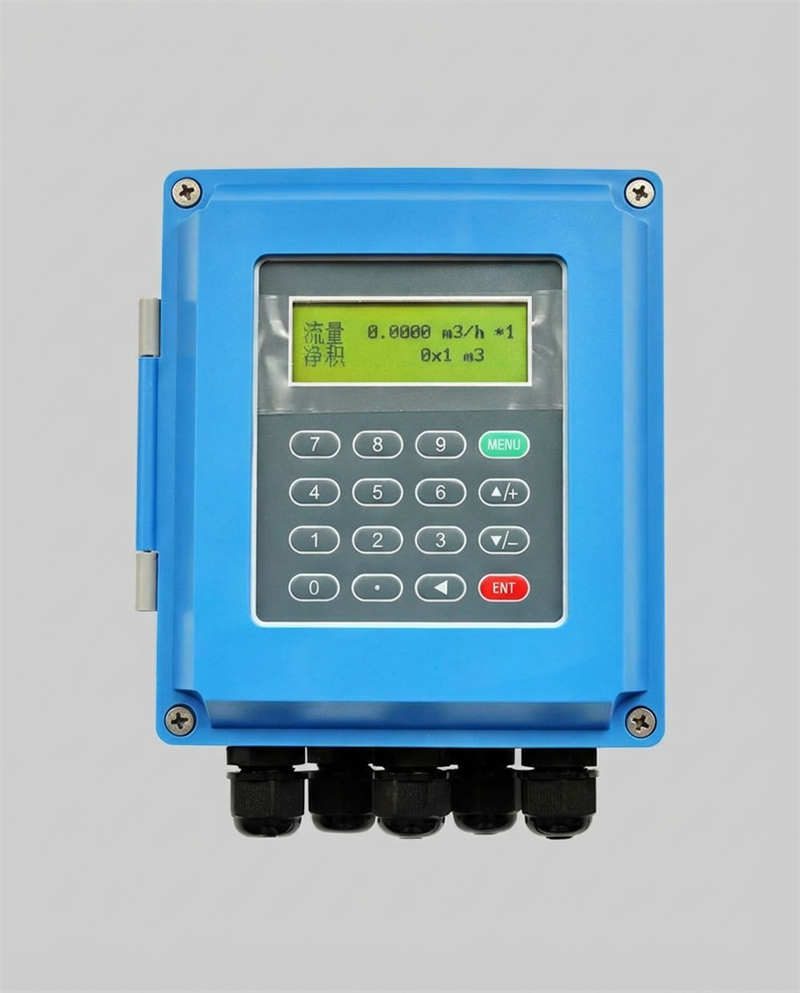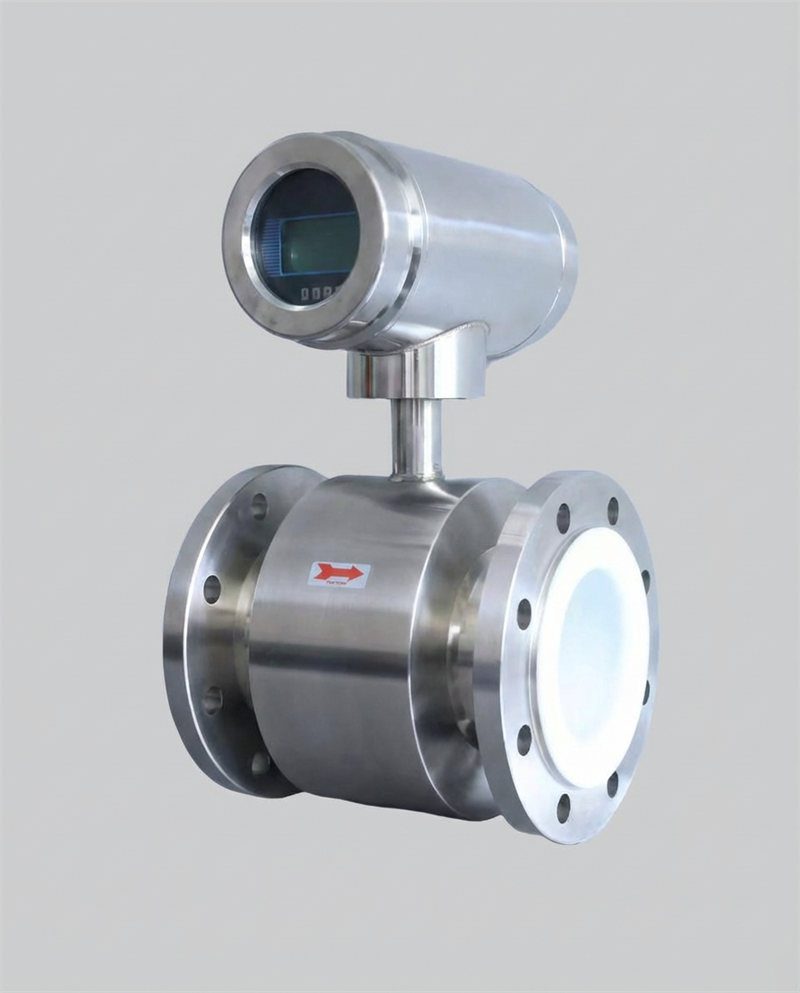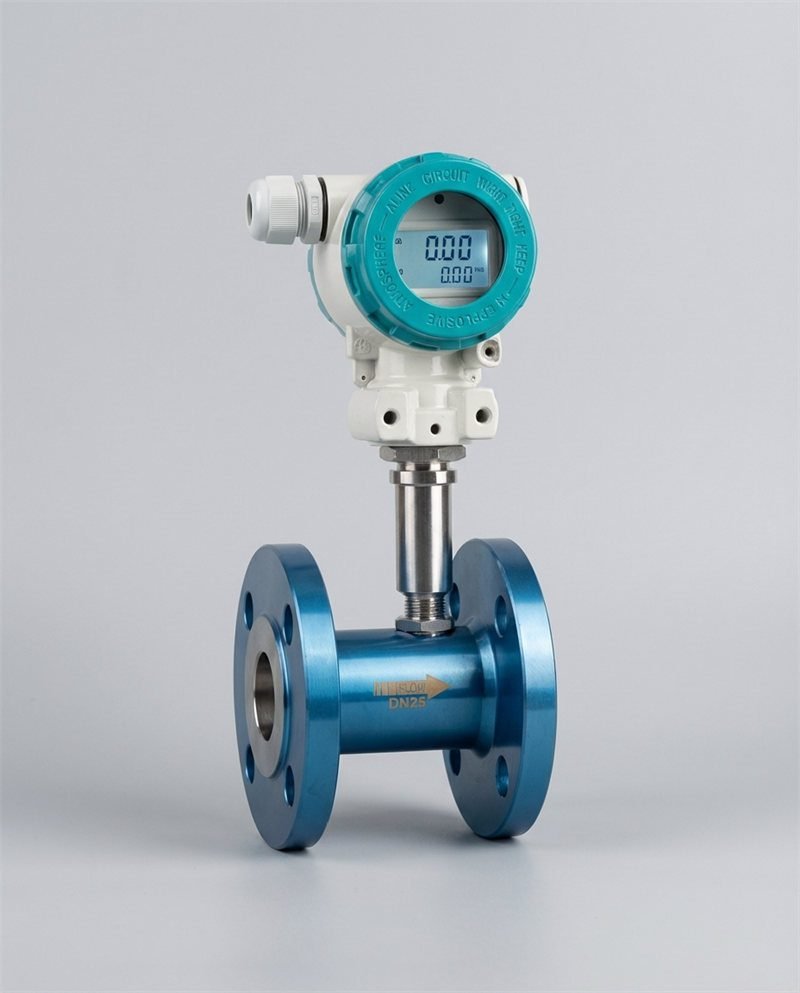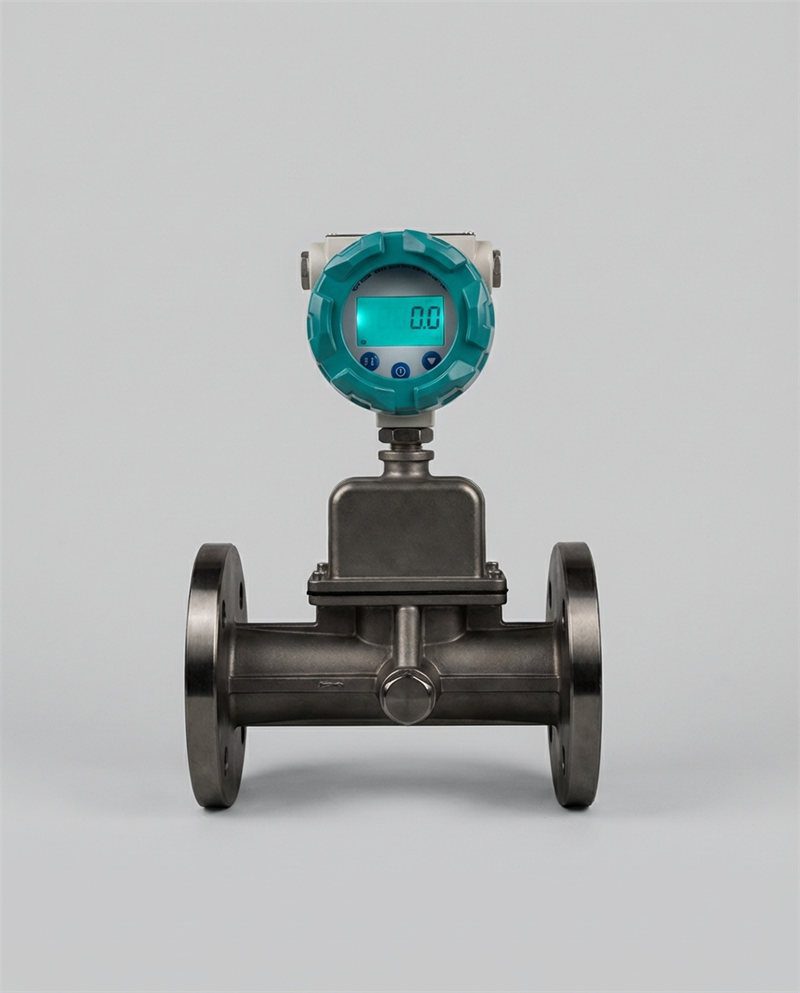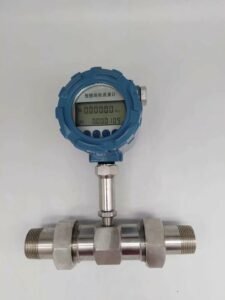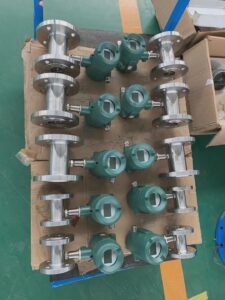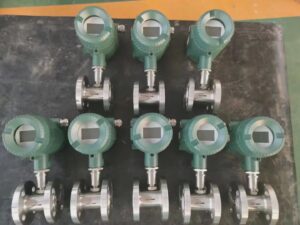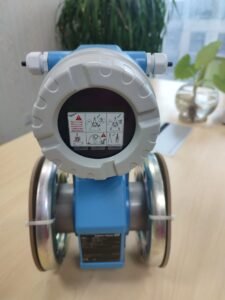

Choosing the right flow measurement technology directly impacts your customers’ operational efficiency, maintenance costs, and regulatory compliance. This technical guide helps you understand the physics behind each technology so you can confidently recommend solutions that solve your clients’ specific challenges—and differentiate your business in a competitive market.
 Non-invasive clamp-on installation on an industrial pipeline — zero process shutdown, zero pipe cutting, and full measurement capability from day one.
Why This Matters to Your Distribution Business
You already know that every deal you close is one your customer will remember—for better or worse. The challenge is that “which meter fits this application” is rarely answered correctly by reading a spec sheet. Flow measurement decisions made without understanding the underlying physics cost your customers real money: in billing disputes, unplanned downtime, premature replacements, and regulatory penalties.
Le global flow meter market reached USD 11.44 billion in 2025 and is growing steadily—yet a large share of field failures are not hardware defects. They are selection errors. When your team can diagnose these errors before they happen, you stop being a parts supplier and become a technical partner. That shift is what protects your margins and your customer retention.
This guide covers the two dominant measurement camps—ultrasonic technology and the traditional mechanical methods that preceded it—with enough technical depth to inform your recommendations and enough practical context to make those recommendations stick in the field.
1. The Fundamental Physics: Understanding Flow Measurement Principles
How Traditional Flow Meters Work (And Why Your Customers Still Need Them)
The Mechanical Foundation — Turbine, Gear, and Displacement Meters
Traditional flow meters share a common characteristic: they use the kinetic or volumetric energy of the fluid itself to drive a physical mechanism, then translate that mechanical motion into a flow measurement.
Turbine meters insert a multi-bladed rotor into the pipe. Fluid velocity spins the rotor; a magnetic pickup counts blade passages and converts pulse frequency to flow rate through a factory-established K-factor (pulses per unit volume). The relationship is: where Q is volumetric flow rate and f is pulse frequency in Hz.
Positive displacement (PD) meters trap known volumes of fluid in rotating chambers—oval gears, helical rotors, or reciprocating pistons—and count the cycles. Unlike turbine meters, which infer flow from velocity, PD meters count volumetric packages directly. This makes them uniquely accurate for viscous fluids where velocity-based measurement degrades.
Variable-area meters (rotameters) balance a float against gravity in a tapered tube, giving a direct visual reading. They require no power, tolerate wide viscosity ranges, and remain standard for many low-value process monitoring applications.
Why Direct Measurement Still Dominates in Certain Industries
Petroleum custody transfer—the metering of crude oil, refined products, and LPG at financial transaction points—still largely relies on turbine and PD meters because they achieve 0.15–0.25% accuracy on clean liquids and carry decades of documented performance history recognized by API MPMS Chapter 5 and AGA-7. Regulatory bodies responsible for fiscal metering accept these technologies as proven.
For batch dispensing in chemical and pharmaceutical manufacturing, turbine meters’ fast pulse output (response times of 20–50 ms) integrates precisely with batch controllers. A 1% excess of a high-value reagent in a specialty pharmaceutical batch can represent $50,000 in product loss—the turbine meter’s millisecond response to cut-off commands is the reason it remains specified for these applications.
The Ultrasonic Revolution — What Changed in Flow Measurement
Doppler Effect Principles and Time-of-Flight Technology Explained
Ultrasonic meters introduced something the mechanical world could not offer: measurement without touching the fluid. Two distinct physical principles enable this.
Transit-time (time-of-flight) technology places two transducers diagonally on a pipe. Each alternately transmits and receives ultrasonic pulses. A pulse traveling downstream (with the flow) arrives fractionally sooner than one traveling upstream. That time difference is directly proportional to average fluid velocity:
où is fluid velocity, K is a geometric calibration constant, and is the zero-flow transit time. Transit-time technology requires clean, homogeneous fluid—any significant suspended solids or entrained gas scatters the acoustic beam.
Doppler technology fires a continuous ultrasonic beam into the fluid and measures the frequency shift of reflections from suspended particles or gas bubbles. Because Doppler meters require acoustic reflectors in the fluid, they are designed specifically for dirty, aerated, or slurry-bearing flows where transit-time meters fail. Accuracy is typically ±2–5% of full scale—adequate for process monitoring, not for custody transfer.
Why Non-Invasive Measurement Appeals to Your Cost-Conscious Clients
The commercial breakthrough of clamp-on ultrasonic technology is that it eliminates the physical act of cutting pipe. No isolation valves needed, no process shutdown, no hot-work permits, no line draining. For a DN600 water main, the civil and pipe-cutting cost avoided by a clamp-on installation can exceed USD $15,000 on a single measurement point.
For clients running continuous processes where downtime costs $5,000–$15,000 per hour, this is not a minor technical distinction. It is the primary financial justification for the technology and the strongest opening for a distributor conversation.
2. Liquid Flow Measurement: Solving Your Customers’ Most Common Applications
When Traditional Meters Deliver Superior Results for Liquids
Handling Viscous Fluids — Where Mechanical Meters Excel
Viscosity is the performance variable that most rapidly disqualifies ultrasonic and other velocity-based technologies. As fluid viscosity increases above approximately 5 centipoise (cP)—the range where lubricating oils, glycols, resins, and thick syrups operate—the drag-to-drive ratio inside a turbine meter shifts, causing the rotor to slow faster than the fluid and producing under-reading. A well-calibrated turbine meter with multi-point viscosity correction can manage up to approximately 20–30 cP; above that, PD meters become the standard.
PD meters for viscous liquids—particularly oval gear and helical rotor designs—actually improve accuracy as viscosity increases. Higher viscosity reduces internal leakage between the rotating chambers and the meter body (the so-called “slippage” effect), so the volumetric accounting becomes more precise. PD meters for petroleum product dispensing and lubricant transfer routinely achieve ±0.1% of reading across viscosity ranges from 5 to 5,000 cP.
Accuracy in Custody Transfer and Billing Applications
For liquid custody transfer under OIML R117 or API MPMS, approved measurement technologies are specified by regulation—not by preference. Turbine and PD meters carry the longest approval history, and in many jurisdictions, switching to ultrasonic technology for fiscal metering requires a formal application, metrological validation, and regulatory acceptance. Your clients in petroleum, LPG, and refined product distribution need to understand this compliance dimension before any meter replacement discussion begins.
A 0.1% measurement error on a metering station transferring 10,000 barrels of crude oil per hour at $80/barrel represents $8,000 per hour in financial exposure. This is the context in which “accuracy” becomes a commercially precise, legally consequential specification—not a marketing number.
Ultrasonic Meters for Liquids — The Game-Changer for Retrofit Situations
Non-Invasive Installation: Solving the Downtime Problem Your Customers Face
The retrofit scenario is where clamp-on ultrasonic meters create the most compelling value proposition for your distribution business. An existing plant with operating meters that are reaching end-of-life, or a facility that needs additional measurement points without a scheduled shutdown, or a client who wants to verify an existing meter’s performance without disturbing it—these are all situations where the clamp-on approach is the only practical solution.
Jade Ant Instruments’ clamp-on ultrasonic range covers pipe diameters from DN32 to DN6000, enabling non-invasive measurement on everything from laboratory-scale tubing to large transmission mains. The practical implication for distributors: one product family covers an application range that would otherwise require four or five different inline technologies—and none of those inline technologies can be installed without a process shutdown.
Multi-Path Ultrasonic Technology — Why It Matters for Corrosive and Abrasive Liquids
For in-line (wetted) ultrasonic meters in corrosive or aggressive liquid service, multi-path configurations—using four, six, or eight independent acoustic beam paths—provide two distinct advantages. First, they average velocity across multiple cross-sectional positions, reducing sensitivity to flow profile asymmetry caused by upstream pipe disturbances. Second, if one transducer pair is damaged by chemical attack or deposition, the remaining paths continue to operate at reduced but still functional accuracy, providing graceful degradation rather than sudden failure.
For chemical processing applications with aggressive solvents, strong acids, or oxidizing agents, the alternative to clamp-on or multi-path ultrasonic is often a turbine or PD meter with wetted components specified in exotic alloys—a significantly more expensive proposition. The ultrasonic clamp-on, by eliminating all fluid contact, removes material compatibility from the equation entirely.
3. Gas Flow Measurement: Navigating the Unique Challenges
 Gas turbine flow meter installation on a natural gas custody transfer line — pulse output, high accuracy, and AGA-7 compliance for fiscal metering.
Traditional Gas Meters and Their Reliability in Harsh Conditions
Turbine Meters vs. Rotary Vane Meters — Which Solves Your Customers’ Problems
Gas turbine meters and rotary vane meters occupy different positions in the gas measurement market and are not interchangeable for the same applications.
Gas turbine meters (per AGA-7) achieve ±0.25% of reading on dry, clean natural gas over their linear range. They respond quickly to flow changes, produce a clean pulse output, and carry approval for custody transfer in virtually every hydrocarbon-producing jurisdiction worldwide. Their limitation is contamination sensitivity: liquid slugs, particulates, and compressor oil carry-over damage bearings rapidly and shift the K-factor. In-line filtration and liquid separators upstream of the meter are not optional—they are functional requirements.
Rotary vane (or rotary lobe) meters measure gas through fixed-volume displacement, similar in principle to a PD liquid meter. They are more tolerant of measurement at low pressures and low velocities than turbine meters, and they maintain accuracy down to much lower flow rates. Where a gas turbine meter begins to lose accuracy below approximately 10–15% of its rated maximum flow, a rotary vane meter can remain accurate down to 2–3% of maximum. For customers with highly variable gas demand—industrial bakeries, seasonal heating systems, small-scale industrial processes—this extended low-flow performance justifies the choice.
Handling Pressure Fluctuations and Temperature Variations
Gas measurement has a complication that liquid measurement does not: gas volume is strongly dependent on pressure and temperature. A cubic meter of natural gas measured at pipeline pressure (e.g., 30 bar) represents 30 times more actual gas content than a cubic meter measured at atmospheric pressure. All billing and custody transfer for gas must be reported in standard conditions (e.g., 0°C, 1 atm)—meaning every gas meter installation requires pressure and temperature sensors plus a flow computer to calculate corrected volumes.
Traditional gas meters with pressure/temperature compensation have managed this for decades. The practical challenge for your clients is that P/T compensation adds cost, adds calibration points, and adds failure modes. A temperature sensor that drifts 2°C on a 20°C gas stream introduces approximately 0.7% volume error—invisible in transmitter diagnostics but measurable in billing.
Ultrasonic Gas Meters — Why They’re Winning Over Distributors
Superior Accuracy at Low Flow Rates — The Problem Traditional Meters Can’t Solve
The AGA-9 standard governs multi-path ultrasonic meters for natural gas custody transfer. Four-path and eight-path transit-time designs now achieve ±0.3% of reading from 10% to 100% of maximum flow—performance that matches or exceeds turbine meters, without the mechanical wear that requires custody-transfer-grade recalibration every 6–12 months.
At low flow rates—where turbine meters lose accuracy due to bearing drag and rotary vane meters begin to show increased leakage—transit-time ultrasonic meters maintain their accuracy because there are no mechanical drag forces. Sound travels through the gas regardless of velocity; the time difference remains measurable even at very low flow rates. This is the physics that enables ultrasonic gas meters to achieve 100:1 or greater turndown ratios while maintaining ±0.3% accuracy throughout—something no turbine meter can match.
Wide Turndown Ratio — Flexibility Your Customers Demand
Turndown ratio—the ratio of maximum to minimum accurately-measurable flow—is directly relevant to your customers’ operational reality. Industrial gas consumers rarely operate at a single steady demand level. A food processing plant might use 80% of design gas flow during production and 5% during cleandown and weekends. If the meter only measures accurately above 15% of maximum flow, the plant is unmetered for approximately 40% of its operating time.
Ultrasonic gas meters with 100:1 turndown eliminate this problem. The customer pays for what they actually consume, even during low-demand periods—and avoids the estimation-based billing that traditionally generates disputes.
4. Steam Measurement: The Most Challenging Application
Why Traditional Orifice Plates and Turbine Meters Struggle with Steam
Condensation Issues and Pressure Drop Complications
Steam presents the harshest measurement environment of any common industrial fluid. At saturation conditions, a small temperature reduction causes phase change—steam becomes water—instantly altering density by a factor of several hundred. This phase change can occur inside an orifice plate impulse line, filling the sensing tubes with condensate and changing the differential pressure reading in a way that looks like a flow change but isn’t.
Condensate pots (small chambers installed on impulse lines to maintain a fixed condensate level) are standard practice for steam measurement with differential pressure meters. They work, but they add installation complexity, require periodic inspection, and introduce additional uncertainty if not correctly sized and positioned.
Traditional turbine meters in steam service face a different set of problems. Moving blades in high-velocity steam accumulate erosion; liquid droplets in wet steam act like solid particles, pitting blade surfaces. A turbine meter rated for dry steam at 5 bar may survive for 3–5 years; the same meter in wet steam service at a paper mill may require replacement within 12 months.
Maintenance Headaches That Cost Your Customers Money
The maintenance burden of steam measurement with traditional technologies is the direct commercial entry point for ultrasonic alternatives. Every time an orifice plate requires inspection—to check for erosion of the bore edge, which directly affects the discharge coefficient and therefore measurement accuracy—the steam line must be isolated, depressurized, and cooled before the plate can be removed. In a facility running 24/7 continuous steam for process heating, that maintenance window is a scheduled production loss.
Orifice plate maintenance in typical industrial steam service: bore edge inspection and replacement every 2–4 years. Cost per event: $3,000–$12,000 in labor, scaffold, and downtime. Over a 15-year meter life, this cumulative maintenance cost often exceeds the original installation cost.
Ultrasonic Steam Meters — The Emerging Solution
How Clamp-On Technology Eliminates Installation Disruptions
Clamp-on ultrasonic meters for steam are an emerging category rather than an established standard—but they are advancing rapidly. Emerson’s clamp-on portfolio includes units rated for saturated steam up to 180°C, and multi-path clamp-on designs can achieve ±2–5% of reading on dry steam in validated installations.
The installation advantage is the same as for liquids: no process shutdown, no pipe cutting, no hot-work in a steam environment. For clients with steam lines that carry significant pressure and cannot be safely depressurized during a production campaign, the clamp-on approach may be the only safe option for adding a measurement point.
For your distribution business, the current limitation is important to communicate honestly: clamp-on steam measurement is appropriate for process monitoring and energy management applications, not yet for custody transfer or fiscal metering where ±0.3% or better accuracy with certified traceability is required. The right framing for clients is “energy monitoring and loss detection”—where ±3–5% accuracy identifies whether a steam trap or heat exchanger is performing correctly, not whether a custody transfer value is financially defensible.
Real-Time Compensation for Pressure and Temperature Changes
Inline ultrasonic vortex meters—not clamp-on—are the current standard for steam custody transfer in many industrial applications. Vortex meters with integrated temperature and pressure sensors calculate mass flow (not just volumetric flow) in real time, compensating for steam condition changes as they occur. This is a significant improvement over orifice plate systems where P/T compensation runs through external transmitters and introduces additional calibration complexity.
For your customers’ steam accounting—energy cost allocation, boiler efficiency monitoring, heat exchanger performance tracking—a properly specified inline ultrasonic or vortex meter with integrated compensation provides a measurement system that requires no condensate pots, no impulse line maintenance, and no routine bore inspection.
5. The Economics Your Customers Care About: Total Cost of Ownership
Installation and Integration Costs — Where You Can Win Deals
Downtime Reduction: Quantifying the Value of Non-Invasive Installation
Purchase price accounts for only 30–40% of a flow meter’s 10-year total cost of ownership (TCO). This is a well-documented industry reality—and it is the framework that turns a price objection into a value conversation.
For a facility running continuous process at $5,000/hour gross margin, a 4-hour traditional meter installation (isolation, line drain, flange-up, recommission) costs $20,000 in lost production. A clamp-on installation that takes 2 hours with the process running costs $0 in lost production. The meter itself might cost $1,500 more. The financial case closes itself.
The table below frames this specifically for your sales team:
| Installation Type | Typical Time | Process Running? | Est. Downtime Cost (at $2,000/hr) | Net Installation Advantage |
|---|---|---|---|---|
| Traditional inline (new install) | 6–10 hrs | Non | $12,000–$20,000 | Valeur de référence |
| Traditional inline (replacement) | 8–12 hrs | Non | $16,000–$24,000 | Valeur de référence |
| Clamp-on ultrasonic (retrofit) | 1–3 hrs | Oui | $0 | $16,000–$24,000 saved |
| Inline ultrasonic (planned shutdown) | 4–6 hrs | Non | $8,000–$12,000 | $8,000–$12,000 saved vs. traditional |
Piping Modifications and Infrastructure Expenses
Traditional meters often require piping modifications for installation: flanged connections, isolation valve pairs, bypass lines, and in some cases, straight-run extensions to meet upstream pipe requirements. For retrofitting an existing installation, these civil costs can be 3–5 times the meter cost on large-diameter pipes.
For your clients, this is not abstract. A DN300 turbine meter replacement on a petroleum product line might involve: two new flanged weld-neck connections ($800 each), a bypass line fabrication ($2,500), isolation valve procurement ($1,200 each), hot-work permits and scaffold ($3,000), and engineering review ($1,500). Total civil cost before the meter: approximately $10,000–$15,000—for a meter that might cost $4,000.
Ongoing Maintenance and Operational Expenses
Calibration Frequency and Spare Parts Inventory
The calibration requirements for each technology type reflect the fundamental physics of how that technology can fail.
| Meter Type | Typical Calibration Interval | Primary Failure Mode | Annual Spare Parts Cost (DN50–100) |
|---|---|---|---|
| Turbine (liquid) | 12–18 months | Bearing wear shifts K-factor | $300–$600 (bearings, seals) |
| Turbine (gas, custody transfer) | 6–12 months | Bearing wear, contamination | $400–$800 |
| PD Meter | 12–24 months | Chamber wear, seals | $200–$500 |
| Orifice plate (DP) | 2–3 years (bore inspection) | Bore edge erosion | $150–$300 |
| Électromagnétique | 2–4 years | Electrode coating, liner degradation | $50–$150 |
| À ultrasons (en ligne) | 3–5 years (with in-situ verification) | Transducer fouling, signal degradation | $80–$200 |
| Ultrasonic (clamp-on) | 3–5 years | Coupling degradation | $30–$80 (couplant) |
For your customers who stock spare parts—and most industrial operations do—the difference between a turbine meter’s bearing inventory and a magnetic or ultrasonic meter’s near-zero parts requirement is not trivial. A plant running 40 turbine meters needs a warehouse of spare rotors, bearings, and seals; the same plant running 40 electromagnetic meters needs almost nothing.
When Minimal Maintenance Justifies a Higher Upfront Investment
The argument for paying more upfront is most compelling when the client operates in a continuously running facility where maintenance access requires scheduled outages, when the fluid is aggressive enough to accelerate wear on mechanical components, or when the process handles a high-value product where measurement drift between calibration intervals creates meaningful financial exposure.
A chemical plant running a turbine meter on a specialty solvent at $200/liter needs to calibrate that meter every 12 months because bearing wear changes the K-factor over that interval—and a 0.5% K-factor shift represents $1,200/hour in billing uncertainty at a 600 L/hour flow rate. The same application with an electromagnetic meter (no K-factor, no moving parts, 3-year calibration interval) reduces that ongoing financial exposure by $120,000–$180,000 over a 3-year period.
Accuracy-Related Costs and Compliance Expenses
Billing Disputes and Revenue Loss from Measurement Errors
The financial exposure from measurement error scales directly with product value and throughput volume. Control Engineering’s documented analysis shows that a 0.25% measurement error in a mid-sized natural gas metering station generates approximately $500,000 per year in financial exposure at $3/MSCF. At higher product values—specialty chemicals, pharmaceutical solvents, LNG—the same percentage error produces proportionally larger losses.
For distributors, the commercial implication is that customers who have experienced a billing dispute—even once—are acutely aware of measurement accuracy risk. These clients are your best prospects for a technology upgrade conversation, because they have already internalized the financial cost of measurement failure.
Regulatory Compliance — Why Better Accuracy Protects Your Customers
Regulatory frameworks for flow measurement specify maximum permissible measurement uncertainty at custody transfer points. In EU jurisdictions, OIML R117 specifies accuracy class requirements; in the US, API and AGA standards govern. A meter operating outside its certified accuracy range is not just a technical problem—it is a regulatory violation that can result in financial penalties, forced recalibration programs, and, in serious cases, operating permit conditions.
The key insight for your clients: keeping their meters within specification is cheaper than the consequence of operating outside it.
6. Accuracy, Repeatability, and Uncertainty: What the Specs Really Mean
Understanding Measurement Uncertainty in Technical Specifications
Why ±2% Traditional Meter Accuracy Isn’t the Same as ±2% Ultrasonic Accuracy
When a turbine meter is specified as ±0.5% of reading and an ultrasonic meter is specified as ±0.5% of reading, these are equivalent claims only under the specific conditions in which each was tested. The difference lies in what degrades that accuracy over time and across operating conditions.
A turbine meter’s K-factor is a constant established at factory calibration. As the rotor bearings wear, the K-factor shifts continuously and progressively. A ±0.5% meter one month after calibration may be a ±1.5% meter 10 months later—and nobody knows until the next calibration. The error is systematic (always in the same direction) and invisible in routine diagnostics.
A transit-time ultrasonic meter has no moving parts and no wear mechanism. Its acoustic transit time is a direct physical measurement, not derived from a calibration constant that can shift. Accuracy degradation in ultrasonic meters occurs through different mechanisms—transducer fouling, coating on internal surfaces affecting acoustic path length, and signal attenuation from pipe wall changes—but these mechanisms are generally slower, more detectable (signal strength is a standard diagnostic parameter), and less directionally biased.
Repeatability vs. Absolute Accuracy — Which Matters for Your Customers’ Applications
Repeatability describes how consistently a meter gives the same reading for the same flow condition, regardless of whether that reading is absolutely correct. Absolute accuracy describes how close the reading is to the true flow value.
For process control applications—where the controller reacts to changes in the flow signal to maintain a setpoint—repeatability is the primary performance criterion. A meter that reads 2.3% high but does so consistently enables a well-tuned control loop. A meter that is accurate on average but has ±1% random scatter makes control loop tuning unstable.
For custody transfer and billing applications, absolute accuracy with a traceable calibration is the primary criterion. Repeatability is assumed; the question is whether the meter is measuring the right thing.
Understanding this distinction helps you ask the right pre-sale question: “Is this meter for control or for billing?” The answer changes the specification.
Environmental Factors That Affect Real-World Performance
Temperature Stability and Pressure Compensation
Temperature affects both the fluid properties and the meter’s mechanical components. For turbine meters in gas service, temperature changes alter gas density and therefore the relationship between volumetric flow and mass. Without accurate temperature compensation, a turbine meter calibrated at 20°C will give systematic errors when measuring gas at -5°C or 40°C—errors that accumulate into billing discrepancies over time.
Ultrasonic meters respond to temperature through changes in the speed of sound in the fluid—a parameter that must be either measured directly (via an additional sensor) or modeled from known fluid properties. Modern transit-time transmitters include fluid property libraries and temperature inputs to compensate in real time. A transit-time meter without temperature compensation on a process where fluid temperature varies by more than 10°C will produce systematic errors of comparable magnitude to an uncompensated turbine meter.
Fluid Properties and Composition Changes
The most common cause of undetected measurement drift in any flow meter technology is a change in fluid properties that shifts the meter’s response without triggering any diagnostic alarm. For turbine meters, viscosity changes are the primary variable. For electromagnetic meters, conductivity changes (unusual but possible in mixed-composition fluids) can affect signal quality. For ultrasonic meters, changes in the speed of sound of the fluid—driven by composition, temperature, or dissolved gas content—directly affect the transit-time calculation.
Clients whose processes involve variable-composition fluids (seasonal changes in water chemistry, variable product grades, mixed solvents) should be advised to verify their meters against an independent reference after any significant process change, not just on the routine calibration schedule.
7. Industry-Specific Applications: Tailored Solutions for Your Customer Base
 Sanitary electromagnetic flow meter on a pharmaceutical CIP line — PTFE liner, hygienic electrodes, and zero obstruction meet FDA 21 CFR requirements.
Chemical and Petrochemical — Where Corrosion and Viscosity Dominate
Material Compatibility and Coating Challenges
In chemical and petrochemical environments, material compatibility between the wetted instrument components and the process fluid is the non-negotiable starting point. Getting this wrong doesn’t produce a measurement error—it produces a safety incident. A standard rubber-lined electromagnetic meter in concentrated hydrofluoric acid service will fail within hours.
The practical selection matrix for wetted materials starts with the fluid’s pH, oxidizing potential, temperature, and specific chemical identity. Guide de sélection des débitmètres électromagnétiques de Jade Ant Instruments covers liner and electrode compatibility for over 40 process chemicals—including the combination of liner type, electrode material, and maximum temperature that defines safe, reliable operation.
For your clients in chemical distribution and specialty chemical production, the recommendation framework is: if the fluid is conductive and below 130°C, start with electromagnetic meters, match materials carefully, and verify with the application engineering team before specifying. If the fluid is non-conductive or above 130°C, clamp-on ultrasonic avoids the material compatibility problem entirely by removing all fluid contact.
Why Ultrasonic Clamp-On Meters Prevent Contamination Issues
For high-purity chemical processes—pharmaceutical intermediates, electronic-grade chemicals, food-contact solvents—contamination from wetted meter components is a product quality risk, not just a maintenance concern. Any metal surface in contact with a high-purity fluid is a potential source of trace metal contamination. Every gasket is a potential leaching point.
Clamp-on ultrasonic meters completely eliminate this risk category. The transducers attach to the outside of the pipe; nothing enters the fluid boundary. For customers handling products where trace metal contamination above parts-per-billion levels fails product specification, this is not a nice-to-have—it is the only technology that meets the contamination protocol without expensive specialized materials throughout.
HVAC and District Heating/Cooling — Energy Management Applications
Low-Flow Accuracy and Seasonal Demand Fluctuations
District heating and cooling systems—where thermal energy is metered and billed based on flow rate and temperature differential—present a measurement challenge that favors ultrasonic technology for a specific reason: demand fluctuations are extreme.
A district heating system designed for peak winter demand at 100% flow may run at 8–12% of maximum flow on a mild autumn day. A turbine meter’s typical 10:1 turndown means it is outside its accuracy range for most of the year. A transit-time ultrasonic meter with 100:1 turndown remains accurate throughout the seasonal range—metering accurately whether the system is serving peak load or a single overnight building.
Ultrasonic BTU (thermal energy) meters that integrate flow measurement with temperature differential calculation are now standard for district energy billing in most European countries and increasingly in Asian infrastructure projects. The measurement principle is straightforward: where the flow meter provides mass flow and two temperature sensors measure supply and return temperatures.
Building Management System Integration and Data Logging
HVAC applications increasingly require flow meters to function as connected data sources rather than standalone indicators. Building management systems (BMS) aggregate energy consumption data across multiple zones, floors, and buildings—requiring meters with digital communication outputs (Modbus RTU, BACnet, M-Bus) and data logging capability at 15-minute or hourly intervals.
Modern ultrasonic and electromagnetic meters support these protocols natively. For your clients in the HVAC and smart building segment, specifying a meter with the correct output protocol from the start avoids the additional cost of signal converters and eliminates a common source of integration failures.
Oil and Gas Operations — Custody Transfer and Fiscal Metering
Regulatory Requirements and Approved Meter Types
Oil and gas custody transfer is the most tightly regulated flow measurement environment in any industry. In the United States, the relevant framework is API MPMS; for European and international applications, OIML R117 governs liquid measurement and AGA-9 governs ultrasonic gas meters. Neither framework allows a meter to be self-declared accurate—measurement must be traceable to a recognized national standard, documented, and periodically re-verified using an approved proving method.
For turbine meters on petroleum lines, this means a regularly scheduled meter proving run using a piston prover or master meter comparison. For multi-path ultrasonic meters approved under AGA-9, it means factory calibration at an accredited flow laboratory plus periodic field verification using a portable master meter or sonic nozzle. The compliance record-keeping requirement is substantial—but it is entirely manageable with the right documentation framework, and your clients in custody transfer applications need this support from their meter supplier.
Pressure and Temperature Extremes That Challenge Both Technologies
Offshore and deep-well production environments impose pressure ratings of 1,500–5,000 psi and temperature ranges of -40°C to 150°C—conditions that eliminate many standard commercial meter designs. Both turbine and ultrasonic technologies have designs qualified for these ranges, but qualification testing and documentation are mandatory. A meter specified for standard API Class 150 flanges does not simply “work” at 5,000 psi because it physically fits the connection.
For your clients procuring meters for high-pressure service, the specification requirement is explicit: ANSI Class 900 or Class 1500 rated bodies, low-temperature impact-tested materials where applicable, and pressure test documentation. This is a specialization within custody transfer where getting the technical specification right before ordering protects both your client and your business relationship.
Water and Wastewater Treatment — Reliability Under Difficult Conditions
Handling Slurries, Suspended Solids, and Biological Growth
Water treatment and wastewater applications cover the widest range of fluid conditions of any single industry sector. Upstream of the treatment process: raw sewage, storm-water runoff, and activated sludge with 2–5% suspended solids. Downstream: treated effluent meeting drinking water standards. Between: chemicals dosing, backwash flows, sludge thickener underflows.
For raw water and wastewater applications, electromagnetic flow meters with hard rubber or polyurethane liners are the standard technology—full-bore design means no obstruction to catch fibrous material, and the measurement principle is entirely unaffected by suspended solids concentration up to approximately 40% by weight in well-engineered designs. Biological growth on electrode surfaces can impair the signal; self-cleaning electrode designs with increased excitation frequency reduce but do not eliminate this effect.
A water treatment plant in Shandong Province running electromagnetic meters on four measurement points—coagulant dosing, clarifier feed, filter backwash, and final effluent—reported a 12% reduction in coagulant consumption after upgrading from turbine meters. The improvement was entirely attributable to the 0.2% dosing accuracy achievable with electromagnetic measurement, versus the ±1.5–2% accuracy the turbine meters delivered under the slurry conditions present in the coagulant feed lines. Annual chemical cost savings: approximately USD $52,000.
Non-Invasive Monitoring Without Process Interruption
Municipal water transmission mains are among the most expensive lines to interrupt for meter installation. A DN800 raw water main serving a city of 500,000 people cannot be taken out of service without significant coordination. Clamp-on ultrasonic provides the only installation pathway that doesn’t require this—and for water utilities adding leak detection or flow balance measurement points without a capital construction program, it is routinely the enabling technology.
8. Practical Selection Criteria: A Decision Framework for Your Sales Team
Questions to Ask Your Customers Before Recommending a Technology
Fluid Type, Temperature Range, and Pressure Specifications
Before any technology is discussed, these seven questions determine which options are physically viable:
- What is the fluid? Is it electrically conductive (>5 μS/cm)?
- Does the fluid contain suspended solids or entrained gas? At what concentration?
- What is the operating temperature range (minimum, normal, maximum)?
- What is the operating pressure range?
- What is the fluid viscosity at operating temperature? Does it change significantly?
- Are there chemical compatibility requirements for wetted materials?
- Is this application custody transfer, process control, or general monitoring?
Questions 1–3 immediately eliminate at least one major technology in most scenarios. A non-conductive fluid eliminates electromagnetic meters. Significant suspended solids eliminate transit-time ultrasonic. Steam at atmospheric pressure eliminates most clamp-on designs. Getting this information before the technology discussion means the recommendation is grounded in physics, not preference.
Installation Constraints and Available Downtime Windows
The installation conversation is equally important. Ask:
- Can the line be shut down for installation? For how long?
- How much straight pipe is available upstream and downstream of the planned location?
- Is the pipe material suitable for clamp-on transducers? (Cast iron with thick walls, lined pipes, and composite pipes each require specific attention.)
- What is the pipe wall condition? (Heavy external corrosion or internal scaling affects clamp-on acoustic signal transmission.)
- What signal outputs does the client’s control system require?
These practical constraints often override the theoretically optimal technology choice. A 25D straight-run upstream requirement for an orifice plate may simply not fit the available space. In that case, the choice isn’t “which technology is better”—it’s “which technology works in this installation.”
Red Flags That Indicate One Technology Over Another
When Ultrasonic Clamp-On Is the Only Practical Solution
- The line cannot be shut down under any circumstances during the project window
- The pipe diameter is DN300 or above and civil work costs for inline installation are prohibitive
- The fluid is corrosive or high-purity and no wetted materials can be accepted in contact
- The application is temporary or periodic (portable clamp-on audit meter)
- The pipe exterior is accessible but the fluid boundary cannot be broken (hazardous area, high-pressure, cryogenic)
When Traditional Meters Are Non-Negotiable for Your Customer
- Custody transfer under API MPMS or AGA-7 requires a turbine or PD meter as the approved technology, and regulatory change approval is unavailable
- Fluid is non-conductive and contains no acoustic reflectors (eliminating both electromagnetic and both types of ultrasonic)
- Batch control requires pulse-based cut-off with <50ms response time
- Viscosity exceeds 100 cP (where PD meters outperform all alternatives)
- High particulate loading in a non-conductive fluid (neither electromagnetic nor ultrasonic is viable—PD or turbine with robust filtration may be the only option)
Future-Proofing the Recommendation
Scalability and Flexibility for Process Changes
Process changes over a 10–15 year meter life are more common than most clients plan for. Product switches, capacity expansions, fluid reformulations, and pipe rerouting can each invalidate a meter selection that was correct at installation. Recommending a technology with flexibility—a clamp-on meter that can be repositioned, an electromagnetic meter that works on any conductive fluid regardless of composition, or a multi-path ultrasonic with configurable path weighting—reduces the probability of a forced replacement due to process change.
Integration with Industry 4.0 and Data Analytics Platforms
Modern industrial operations increasingly rely on SCADA systems, digital twins, and predictive maintenance platforms that require rich data from field instruments. A meter that outputs only a 4–20 mA analog signal is not compatible with this infrastructure. Specifying meters with HART, Modbus, or Profibus digital outputs from the start—even if the client’s current system only uses the 4–20 mA signal—ensures the measurement point is ready for the digital integration that most industrial facilities will require within the next 5 years.
The diagnostic data available through digital protocols—signal quality metrics, electrode resistance, transmitter temperature, totalizer records—transforms a flow meter from a single-variable sensor into a process health monitoring tool. This is a concrete value proposition for clients who are managing measurement reliability across large installations.
9. Common Customer Objections and How to Address Them
 Side-by-side comparison of measurement principles: ultrasonic transit-time (left) vs. turbine rotor mechanism (right). The physics of each technology defines where it excels and where it fails.
“Ultrasonic Meters Are Too Expensive”
Reframing the Conversation Around Total Cost of Ownership
The price objection almost always compares the purchase price of an ultrasonic meter against the purchase price of a turbine meter—and stops there. The comparison is incomplete by design. Industry analysis confirms that purchase price represents only 30–40% of a flow meter’s 10-year TCO.
The complete comparison must include: installation cost (including downtime), calibration cost over the life, spare parts and labor for wear-component replacement, and the cost of any measurement errors that accumulate between calibration intervals. When all of these are included, a turbine meter that costs $600 at purchase may cost $12,000–$19,800 over 10 years on a petroleum service line. An inline ultrasonic meter costing $2,500 may cost $8,000–$10,000 over the same period.
Calculating the ROI of Reduced Downtime and Maintenance
The ROI calculation for reduced downtime is straightforward: multiply the number of avoided maintenance events (bearing replacements, calibration pulls) by the process downtime each event requires, and multiply by the client’s cost of downtime per hour. For most industrial processes, a single avoided 8-hour maintenance event justifies the price difference between a turbine meter and a no-moving-parts alternative.
For a facility running at $3,000/hour process value with two avoided 8-hour calibration events per year: $3,000 × 8 × 2 = $48,000/year in avoided downtime cost. The incremental meter cost difference is recovered in weeks.
“Traditional Meters Have Decades of Proven Performance”
Acknowledging the Valid Concerns While Introducing Modern Alternatives
This objection contains a legitimate concern: proven performance in documented applications with regulatory approval is genuinely valuable. Your clients are right to weight it. The appropriate response is not to dismiss the concern but to examine whether the “proven performance” claim applies to their specific application conditions.
A turbine meter with a 40-year track record in clean, dry natural gas at 5 bar is not automatically appropriate for a new application involving wet gas, particulate-bearing compressed air, or variable-viscosity condensate. The technology is proven—but in the application conditions that generated that track record, not necessarily in the new application being considered.
Case Studies Showing Successful Transitions in Similar Industries
A North Sea operator documented a switch from turbine to 4-path AGA-9 ultrasonic meters across 40 fiscal gas measurement stations, reducing annual calibration costs by approximately USD $1.8 million while maintaining accuracy within AGA-9 limits. The technology is not “new”—the AGA-9 standard has governed ultrasonic gas metering since 1998. What is new is the accumulated field experience that now justifies this transition for distributors and end-users who were previously cautious about departing from turbine technology.
“We’re Worried About Accuracy Degradation Over Time”
Understanding Drift Characteristics in Both Technologies
Traditional meters drift through a predictable, physics-driven mechanism: moving parts wear. The turbine rotor’s K-factor shifts as bearing friction increases; the orifice plate’s discharge coefficient changes as the bore edge erodes. Both mechanisms are directional (always causing under-reading as the meter ages) and progressive. The only way to detect them is through periodic calibration using a reference standard.
Ultrasonic meters drift through different mechanisms: transducer fouling reduces signal amplitude, pipe wall changes affect acoustic path length calculation, and in clamp-on configurations, couplant degradation reduces coupling efficiency. These mechanisms are generally slower, non-directional, and—critically—detectable in real time through the meter’s signal quality diagnostic. A transit-time meter whose signal strength drops from 100% to 60% is telling the operator that its acoustic path is degrading, before the accuracy degrades to an unacceptable level.
Maintenance Protocols That Preserve Measurement Integrity
For ultrasonic meters, the most impactful maintenance activity is periodic inspection and replacement of coupling gel (for clamp-on configurations) and verification that the pipe wall acoustic properties have not changed significantly due to scaling or corrosion. These checks can be performed without interrupting the process and take 15–30 minutes per measurement point.
For traditional meters, a preventive maintenance protocol that replaces bearings before they exhibit measurable wear—rather than waiting for the annual calibration to reveal drift—maintains tighter accuracy between calibration checks. For petroleum custody transfer turbine meters, this means bearing inspection at 9-month intervals and replacement at first sign of roughness, rather than waiting for the 12-month calibration cycle to document the shift.
“Our Existing Systems Use Traditional Meters — Switching Is Too Disruptive”
Hybrid Approaches and Phased Replacement Strategies
Complete technology transitions are rarely necessary or appropriate. The practical approach is a phased strategy that targets the highest-risk or highest-cost measurement points first—typically custody transfer meters, meters in aggressive service conditions, or meters with documented measurement history suggesting accuracy issues.
A practical 3-phase approach for a facility with 20 traditional meters: Phase 1 — add clamp-on ultrasonic meters alongside the five existing custody transfer meters to establish 12 months of comparison data. Phase 2 — replace the three meters showing the largest systematic bias with inline ultrasonic or electromagnetic alternatives at the next scheduled maintenance window. Phase 3 — evaluate the remaining 17 meters on a risk-based schedule, replacing based on application criticality and TCO analysis.
This approach preserves continuity of operations, generates comparison data that validates the transition, and avoids the organizational resistance that comes with mandated wholesale technology change.
Demonstrating Compatibility with Legacy Equipment
Modern electromagnetic and ultrasonic meters support the same 4–20 mA output and pulse output protocols as the traditional meters they replace. A turbine meter’s pulse output feeds directly into an existing flow totalizer; a replacement electromagnetic meter with the same output protocol requires no changes to the downstream control system. The “disruption” concern often diminishes when clients see that the new meter speaks the same electrical language as the one it replaces.
10. Implementation Strategy: From Recommendation to Successful Installation
Pre-Installation Assessment and Site Evaluation
Piping Configuration, Straight-Run Requirements, and Accessibility
Before any meter is ordered, someone—either from your team or the client’s engineering group—needs to physically walk the installation location and measure actual conditions, not rely on design drawings. The most common installation failure we see across industrial facilities is this: straight pipe distances are verified on P&IDs, but the as-built piping differs from the design. A control valve moved 5 meters closer to the meter location during construction can reduce a 22D upstream run to 8D—which eliminates the orifice plate as a viable option entirely.
The minimum information required for a pre-installation assessment is: the actual distance from the meter location to every upstream disturbance within 50 pipe diameters (elbows, valves, reducers, pump outlets, tees), the pipe material and wall thickness (critical for clamp-on ultrasonic selection), the pipe surface condition (external corrosion or painting affects transducer coupling), and the available access space for installation and future maintenance.
Fluid Sampling and Property Analysis
For applications involving complex fluids, process fluids at non-ambient temperatures, or fluids with variable composition, a fluid sample should be analyzed before finalizing the specification. The critical properties to confirm are viscosity at operating temperature (not at ambient), electrical conductivity (for electromagnetic meters), speed of sound (for ultrasonic meter configuration), and chemical composition (for material compatibility verification).
A fluid sample analysis costs $200–$500 through a commercial laboratory. The cost of specifying a meter based on assumed fluid properties and discovering the error after installation is orders of magnitude higher.
Installation Best Practices That Protect Your Reputation
Minimizing Process Disruption and Safety Considerations
For inline meter installations that require a process shutdown, the sequence matters significantly to commissioning success. The correct order is: complete all piping work first (weld, flush, inspect), commission the flow meter last (after all upstream pipe work is stable and clean), and perform the initial verification before any process fluid reaches the meter. Commissioning a turbine meter on a line that has just been welded and is carrying weld slag and scale is the most common cause of premature bearing failure—and one of the most common sources of distributor reputation damage.
For clamp-on installations, the primary safety consideration is pipe wall condition. A clamp-on installation on a corroded pipe section with 2mm external pitting can look acceptable to visual inspection while having internal wall loss that changes the acoustic path geometry and introduces systematic error. In critical applications, pipe wall thickness measurement at the proposed transducer location using an ultrasonic thickness gauge (a $300–$500 instrument) should be standard practice.
Commissioning and Initial Calibration Verification
Commissioning verification for any new installation should include an independent comparison measurement before the meter enters service. For most applications, a portable clamp-on ultrasonic meter provides this comparison at low cost. If the new meter and the portable reference agree within their combined uncertainty limits, commissioning is validated. If they don’t, the disagreement identifies a problem before it becomes a billing dispute.
Document the commissioning verification results, including the portable meter model, serial number, and calibration date. This record—a one-page commissioning report—protects both your business and your client if the measurement is questioned later.
Post-Installation Support and Customer Success
Training Your Customers’ Operators on New Technology
The most technically correct meter, installed perfectly, fails in service when operators don’t understand its diagnostic outputs. An electromagnetic meter transmitter displaying “Empty Pipe Detected” is indicating that the pipe is running partially empty—a process condition that operators need to address, not a meter fault. An ultrasonic meter displaying “Signal Quality: 45%” is warning of developing transducer fouling—a maintenance action that should be scheduled, not ignored.
A one-day operator familiarization session covering the new meter’s diagnostic indicators, alarm meanings, and routine checks is the difference between a successful installation that stays successful and one that generates service calls 18 months later. Include this in your installation and commissioning scope as a standard deliverable—it costs two to three hours of your time and eliminates the majority of post-installation support issues.
Establishing Maintenance Schedules and Monitoring Protocols
Provide each installation with a written maintenance schedule tailored to the technology and application. For an electromagnetic meter on a wastewater application, this includes: electrode impedance check at 6 months, transmitter diagnostic review at 12 months, liner inspection at 24 months, full calibration verification at 36 months. For a clamp-on ultrasonic on a water main, it includes: transducer coupling check at 12 months, signal quality trend review at 6 months, comparative verification against portable reference at 24 months.
The distributor who hands the client a physical maintenance schedule at commissioning becomes the first call when that schedule generates a question 2 years later—which is the right time to discuss the next phase of instrumentation.
📺 Recommended Video — Share This With Your Clients’ Engineering Teams:
Ultrasonic Flow Meter Explained | Working Principles — RealPars
This 8-minute video provides a clear visual explanation of transit-time measurement, beam path geometry, and the physics difference between transit-time and Doppler ultrasonic meters. Ideal to send ahead of a technical conversation with a client who is new to ultrasonic technology.
Technology Selection at a Glance: Master Reference Table
| Paramètre | Ultrasonic Transit-Time | Ultrasonic Doppler | Électromagnétique | Turbine | Positive Displacement |
|---|---|---|---|---|---|
| Measurement principle | Time-of-flight difference | Doppler frequency shift | Faraday’s law (EMF) | Rotor pulse frequency | Fixed-volume displacement |
| Best accuracy (inline) | ±0.5% of reading | ±2–5% of FS | ±0,21 TP3T de lecture | ±0.25% of reading | ±0.1% of reading |
| Rapport de réduction | 100:1 (multi-path) | 10:1 | 33:1 | 10:1 | 20:1 |
| Fluid requirement | Clean, no significant solids or gas | Requires solids/bubbles | Conductive (>5 μS/cm) | Clean, low viscosity | Clean to moderately viscous |
| Gas measurement? | Yes (specialized) | Non | Non | Yes (AGA-7) | Some designs |
| Moving parts | Aucun | Aucun | Aucun | Yes (rotor, bearings) | Yes (gears/pistons) |
| Non-invasive option? | Yes (clamp-on) | Yes (clamp-on) | Non | Non | Non |
| Perte de charge | Zero (clamp-on) | Zero (clamp-on) | Zero (full-bore) | 0.1–0.8 bar | 0,3 à 1,5 bar |
| Viscosity sensitivity | Modéré | Faible | Aucun | High (>5 cP) | Improves with viscosity |
| Calibration interval | 3–5 years | 2–3 years | 2–4 years | 12–18 months | 12–24 months |
| Upstream straight pipe | 10D / 5D downstream | 10D / 5D downstream | 5D / 2–3D downstream | 15–20D / 5D downstream | 0–5D / 2D downstream |
| Typical 10-year TCO (DN50) | $8,000–$10,000 | $6,000–$9,000 | $7,000–$12,000 | $7,600–$19,800 | $8,000–$15,000 |
| Best applications | Large-bore water, clean liquid, gas fiscal metering | Wastewater, slurry monitoring | Water, chemical, wastewater, food | Petroleum, clean gas, batch | Viscous liquid, petroleum billing |
Positioning Your Distribution Business as a Trusted Technical Advisor
The flow meter market is commoditizing at the low end—online platforms now sell standard electromagnetic and turbine meters at prices that make pure price-based competition unsustainable for distributors who rely on margin. The protection against that commoditization is technical depth.
Every concept in this guide—the physics of transit-time measurement, the material compatibility matrix for electromagnetic liners, the TCO calculation for turbine meter bearing replacement, the regulatory framework for custody transfer approval—is a conversation starter that a catalog supplier cannot have. These are the conversations that move you from vendor to partner.
Jade Ant Instruments manufacturers ISO-certified electromagnetic, turbine, ultrasonic, vortex, and clamp-on flow meters designed for the full range of industrial applications described in this guide. The distributor partners who perform best are the ones who use technical knowledge—not just product availability—to earn their clients’ trust and protect their own margins.
The risk of continuing to compete on price alone is visible in distributor margins across the industry. The opportunity of competing on technical value is visible in the contract retention data of distributors who make the investment.
🔧 Ready to Confidently Recommend the Right Flow Measurement Solution to Your Customers?
Download our Technical Selection Worksheet and use it in your next customer conversation to identify which technology solves their specific challenges. Included: a decision tree, ROI calculator, and compliance checklist tailored for B2B distributors.
The worksheet walks through the seven pre-sale questions from Section 8 of this guide, generates a technology shortlist based on fluid properties and installation constraints, and includes a blank TCO comparison template for calculating 10-year cost differences between competing options.
Use it in your next customer visit. It takes 20 minutes and produces a defensible, data-backed recommendation.
Get the Selection Worksheet + 30-Minute Technical Consultation →
Glossary of Key Technical Terms
Transit-Time (Time-of-Flight) Measurement: The ultrasonic measurement principle where flow velocity is calculated from the difference in travel time between acoustic pulses sent upstream and downstream. Requires clean, homogeneous fluid.
Doppler Shift: The change in frequency of an acoustic signal reflected from moving particles or bubbles. Used in Doppler ultrasonic meters for dirty or aerated fluids.
K-Factor: The calibration constant of a turbine meter, expressed as pulses per unit volume. Shifts with bearing wear or viscosity changes, making periodic calibration mandatory.
Turndown Ratio (Rangeability): The ratio of maximum to minimum flow rate at which a meter maintains its specified accuracy. A 100:1 turndown means the meter is accurate from 1% to 100% of its rated maximum flow.
Faraday’s Law: The electromagnetic induction principle underlying all magnetic flow meters: a conductor (conductive fluid) moving through a magnetic field generates a voltage proportional to its velocity.
Total Cost of Ownership (TCO): The complete cost of a flow meter over its operational life, including purchase price, installation, calibration, maintenance, spare parts, and downtime costs. Purchase price typically represents only 30–40% of 10-year TCO.
Coefficient bêta (β) : For orifice plates and differential pressure primary elements, the ratio of the orifice bore to the pipe internal diameter. Higher beta ratios require longer upstream straight pipe runs.
AGA-9: The American Gas Association standard governing multi-path ultrasonic meters for natural gas custody transfer. Requires a minimum of four acoustic paths and factory calibration traceable to national standards.
OIML R117: The International Organization of Legal Metrology standard governing dynamic measuring systems for liquids, used for liquid custody transfer metering in EU and international applications.
Clamp-On Installation: Attachment of ultrasonic transducers to the external surface of a pipe, requiring no pipe penetration, no process shutdown, and no fluid contact. The defining commercial advantage of clamp-on ultrasonic technology.
 Flow measurement control panel at an oil refinery — multiple technologies selected for specific applications, integrated through common digital communication protocols.
Frequently Asked Questions Your Customers Are Actually Asking
FAQ 1: What’s the practical difference in accuracy between a ±2% traditional meter and a ±2% ultrasonic meter in real-world conditions?
The specification may be identical on paper, but the mechanism of accuracy degradation is completely different—and this is what matters in the field. A traditional mechanical meter rated at ±2% is accurate at that level immediately after calibration. As bearings wear or the orifice bore erodes, accuracy degrades progressively and directionally (always toward under-reading), and no diagnostic on the meter will warn you this is happening. By the time the next calibration reveals the drift, the meter may have been operating at ±4–6% for several months. In a custody transfer application handling specialty chemical at $150/liter at 500 L/hour, six months of 3% systematic error represents approximately $350,000 in billing discrepancy.
A transit-time ultrasonic meter rated at ±2% degrades through different mechanisms—primarily transducer fouling and signal attenuation—that are visible in real time through the meter’s signal quality diagnostic. A signal quality dropping from 95% to 60% is a measurable, actionable warning that accuracy may be compromised, well before billing errors accumulate. This diagnostic transparency is the practical difference: not the specification, but the early warning capability.
FAQ 2: Can ultrasonic clamp-on meters measure steam accurately, or should we stick with traditional insertion meters?
Clamp-on ultrasonic for steam is advancing but currently carries important limitations that your clients need to understand before they specify it. Modern clamp-on designs (including Emerson’s portfolio) can measure saturated steam up to 180°C with approximately ±2–5% accuracy in validated installations—appropriate for energy monitoring, heat exchanger performance tracking, and steam trap auditing. For these applications, the clamp-on approach is valid and its non-invasive installation is a genuine advantage.
For steam custody transfer or fiscal metering where ±0.5% or better accuracy with regulatory traceability is required, clamp-on ultrasonic is not yet an approved or validated technology in most regulatory frameworks. In these applications, inline vortex meters with integrated P/T compensation or differential pressure primary elements with condensate pots remain the established approach. The decision framework: if the application is monitoring and the client needs accuracy within ±5%, clamp-on is appropriate; if the application involves billing or compliance with an accuracy requirement below ±1%, use inline vortex or DP.
FAQ 3: How often do traditional turbine meters need calibration compared to ultrasonic meters?
Turbine meters in general industrial liquid service require calibration every 12–18 months because bearing wear progressively shifts the K-factor. For custody transfer applications, annual or bi-annual calibration is typical, often mandated by regulation. Each calibration event requires meter removal, transport to a calibration facility, calibration against a certified flow standard, return shipping, and reinstallation—with associated process downtime. A conservative estimate for a DN50 turbine meter in petroleum service: 3 calibration events in 5 years at $800–$1,200 per event plus 8 hours downtime each = $6,400–$9,600 in calibration cost plus $24,000–$72,000 in downtime cost (at $1,000–$3,000/hour).
Transit-time ultrasonic meters in the same service typically require calibration every 3–5 years, and modern designs with in-situ verification capability (signal quality diagnostics, zero-flow verification) can justify extension to 5–7 years under ISO 9001 risk-based quality management. Over a 15-year lifecycle, the calibration cost difference alone—without counting downtime—is $15,000–$25,000 per measurement point. For a distributor managing a plant with 20+ measurement points, this TCO argument is the foundation of a multi-year account relationship.
FAQ 4: If we install an ultrasonic meter in a pipe with scaling or buildup, will it still work?
Internal scaling affects clamp-on and inline ultrasonic meters differently, and understanding the distinction helps you give accurate advice. For clamp-on meters, internal scaling that is acoustically similar to the pipe wall (e.g., calcium carbonate scale) will appear as additional pipe wall thickness and shift the acoustic path calculation. If the scale layer is uniform and stable, and the meter configuration accounts for it correctly, accuracy impact can be minimal. If the scale is patchy, irregular, or growing, it will change the acoustic path length unpredictably and introduce systematic error. Clamp-on meters on known scaling services should be configured with periodic acoustic pipe wall profile verification.
For inline ultrasonic meters, internal buildup on the transducer faces or within the acoustic path reduces signal amplitude—which appears directly as declining signal quality in the transmitter diagnostics. This is actually useful: the meter tells you the scale is building up, before it significantly affects accuracy. Regular monitoring of signal quality (a 5-minute weekly check of the diagnostic output) provides early warning of scaling development. For very heavy scaling services, external periodic cleaning access points on inline meters are worth specifying.
FAQ 5: What’s the maximum turndown ratio we can expect from each technology, and why does it matter for our variable-demand application?
Turndown ratios for industrial flow meter technologies: ultrasonic transit-time (multi-path) achieves 100:1 or greater; electromagnetic meters typically 33:1; turbine meters 10:1; PD meters 20:1; orifice plates (differential pressure) approximately 4:1 to 6:1. These ratios define the flow range over which each technology meets its accuracy specification.
For a variable-demand application—say, a gas distribution network serving industrial customers whose demand swings from peak production at 95% of maximum to overnight minimum at 7%—the orifice plate’s 4:1 ratio means it is only accurately measuring when the system is above 25% of maximum flow. For the remaining time, it is either outside its specified accuracy range or below its minimum measurable flow entirely. A transit-time ultrasonic meter with 100:1 turndown covers the entire operating range with the same accuracy specification. If the product being measured costs $80/unit and the annual low-flow period represents 3 million units, the difference between “measured accurately” and “estimated or outside range” is significant regardless of industry.
FAQ 6: Are there fluid types or conditions where ultrasonic meters simply won’t work?
Yes—and being clear about these prevents specification errors that damage your reputation. Transit-time ultrasonic meters will not work reliably in: fluids with more than approximately 1–2% entrained gas by volume (signal scatter causes no-signal conditions), fluids with significant suspended solids above 1–2% by volume (same issue), fluids with very low speed of sound (certain dense organic solvents), and pipes smaller than approximately DN15 where the acoustic path geometry cannot be established accurately. Clamp-on designs additionally fail on pipes with composite walls, rubber-lined interiors where the lining produces separate acoustic reflections, thick concrete pipe sections where signal attenuation is excessive, and pipes with heavy external corrosion that prevents reliable transducer coupling.
In these conditions, Doppler ultrasonic (for dirty/aerated fluids at lower accuracy), electromagnetic (for conductive fluids), Coriolis (for high-accuracy requirements on challenging fluids), or traditional turbine/PD meters (for clean non-conductive fluids) are the alternatives. Knowing these boundaries in advance—before the meter is ordered and installed—is the technical competency that distinguishes a distributor from a box-shipper.
FAQ 7: How do temperature and pressure fluctuations affect measurement accuracy differently in traditional vs. ultrasonic meters?
In turbine and PD meters, temperature fluctuation affects fluid viscosity, which affects rotor drag in turbine meters and internal leakage in PD meters. A turbine meter calibrated at 20°C on water (viscosity ~1 cP) will give a systematic error on the same water at 80°C (viscosity ~0.35 cP) because the reduced viscosity changes the rotor’s drag-to-drive balance. Without a viscosity correction applied in the transmitter, this error can reach 1–3% on highly variable temperature applications. Pressure fluctuations affect gas measurement through density changes—a turbine meter measuring gas at 5 bar that experiences pressure surges to 8 bar will report the same volumetric flow, but the corrected volume (at standard conditions) will be wrong unless real-time pressure compensation is applied.
Transit-time ultrasonic meters respond to temperature through changes in the speed of sound in the fluid—a parameter that the transmitter must know accurately to calculate flow correctly. Modern transmitters apply real-time temperature compensation using the fluid’s acoustic property model. For liquids with stable composition (water, petroleum), this compensation is accurate and robust. For gases, temperature and pressure compensation is mandatory and well-established through integration with P/T transmitters and a flow computer. The key practical advantage of ultrasonic for variable-temperature gas service: the non-invasive design means the transducers are at pipe wall temperature, which is directly measurable—whereas a turbine meter’s internal K-factor shift occurs where it’s not directly measurable.
FAQ 8: Can we retrofit an existing traditional meter installation with an ultrasonic clamp-on meter without modifying the piping?
In the majority of cases, yes—with specific practical requirements. Clamp-on installation needs: a pipe material that transmits ultrasound (metallic pipe, or non-metallic pipe without acoustic-barrier liners), a pipe that is full of liquid under all operating conditions, a minimum straight pipe run of approximately 10D upstream and 5D downstream from the transducer position, and an accessible external pipe surface at the chosen location without major corrosion, pipe support clamps, or insulation that cannot be locally removed.
The most common constraints that prevent a clean retrofit: insufficient straight pipe upstream (too close to an elbow or valve), a rubber or HDPE liner that reflects acoustic energy before it enters the fluid, and pipe surfaces so corroded externally that reliable transducer coupling cannot be achieved. A 15-minute site walk with a portable pipe thickness gauge and a tape measure identifies all of these conditions before any equipment is ordered. For clients who want an on-site feasibility check before committing to the purchase, offering this pre-sale site visit is a differentiating service that costs you one person-hour and typically closes the deal.
FAQ 9: What’s the impact on measurement data if we install a meter with insufficient straight-run pipe upstream and downstream?
Flow profile distortion from insufficient straight pipe creates systematic measurement error—meaning the meter reads consistently wrong by a fixed percentage, every reading, every day. This is distinct from random error (scatter around the true value); it is a steady, invisible bias that accumulates into billing discrepancies and process control problems over time.
The magnitude of the error depends on the meter type and disturbance severity. An orifice plate with 50% of its specified upstream straight run can produce 5–10% systematic error due to the square-law amplification of velocity asymmetry. A turbine meter with insufficient upstream run can show 2–4% error. An electromagnetic meter is more forgiving—typically 0.5–2% error with moderate profile distortion. A Coriolis meter is essentially immune. The critical point: this error will not appear in any diagnostic check, because the instrument is performing correctly—it’s just measuring a distorted flow profile accurately. The only detection method is comparison against an independent measurement reference.
FAQ 10: How do we validate that a newly installed meter is performing within specification before we put it into service?
A proper commissioning verification consists of three steps: instrument self-check, signal quality verification, and independent comparative measurement. The instrument self-check confirms that transmitter diagnostics show no faults, signal quality parameters (for ultrasonic) or electrode impedance (for electromagnetic) are within normal range, and zero-flow verification shows the output is within the transmitter’s zero stability specification.
Signal quality verification (ultrasonic) confirms that the acoustic path is correctly established and the signal-to-noise ratio exceeds the manufacturer’s minimum requirement—typically 80%+ signal quality for a reliable measurement. Below 60%, the measurement should not be trusted until the cause (coupling issue, pipe condition, or fluid contamination) is resolved.
Independent comparison uses a portable clamp-on ultrasonic meter at the same location to provide a reference measurement. If the installed meter and the portable reference agree within their combined uncertainty (typically ±1.5–2.5% for this comparison), the installation is validated. Document the portable meter’s model, serial number, calibration date, and the comparison results. This one-page commissioning record protects both your business and your client for the life of the installation.
FAQ 11: What’s the difference in cost between owning a traditional meter vs. an ultrasonic meter over 15 years, including maintenance, calibration, and potential downtime?
The following model uses conservative assumptions for a DN50 turbine meter versus an inline ultrasonic meter in industrial liquid service. Adjust the downtime cost per hour to match your client’s specific operation.
| Catégorie de coûts | Turbine Meter (15 years) | Inline Ultrasonic (15 years) |
|---|---|---|
| Purchase price | $800 | $2,200 |
| Installation | $1,200 | $1,500 |
| Calibration (10 events vs. 4 events) | $9,000–$15,000 | $3,600–$6,000 |
| Spare parts (bearings, seals) | $2,400–$4,500 | $600–$1,200 |
| Process downtime (calibration + repair) | $18,000–$60,000 | $4,800–$12,000 |
| Total 15-Year TCO | $31,400–$83,500 | $12,700–$22,900 |
Downtime cost at $1,500/hr, 8 hrs per turbine calibration event, 4 hrs per ultrasonic. Actual figures vary significantly by application.
The turbine meter wins on purchase price in every scenario. It loses on 15-year TCO in almost every scenario where the process has meaningful downtime cost. Use this model as a template your clients can populate with their own downtime cost figure—most industrial procurement decisions change once this calculation is completed.
FAQ 12: If we need to measure custody transfer volumes for billing purposes, which technology does our regulatory body require?
This varies by industry, product, country, and the specific regulatory framework that governs the transaction. For natural gas in the United States, the relevant standards are AGA-7 (turbine meters) and AGA-9 (ultrasonic meters)—both are approved for fiscal metering. For petroleum liquids under API jurisdiction, API MPMS Chapters 5 and 6 approve turbine, PD, and Coriolis meters; specific ultrasonic liquid meters approved under AGA or ISO standards are increasingly accepted but require documented performance testing. In EU jurisdictions, OIML R117 covers liquid meters and specifies accuracy classes—the technology is not prescribed, but the measurement uncertainty must be documented and traceable.
The practical advice for your clients: before specifying any meter for custody transfer, identify the specific standard or regulation that governs the measurement, confirm that the proposed meter type is approved under that standard, and verify that the approval applies to the specific operating conditions (pressure, temperature, flow range, fluid composition) of the installation. Do not assume that because a meter is used for custody transfer elsewhere, it is automatically approved for your specific regulatory jurisdiction. A conversation with the local weights-and-measures authority or metrological institute will confirm applicability—and that conversation is one of the services you can facilitate as a knowledgeable distributor.
FAQ 13: How does the presence of entrained gas in a liquid affect measurement accuracy for each technology?
Entrained gas—air or other gas bubbles dispersed in a liquid flow—affects different technologies through completely different physical mechanisms. In turbine meters, small gas bubbles cause the rotor to spin faster than the liquid alone would justify, because gas offers less drag than liquid—producing consistent over-reading. The magnitude depends on gas fraction and bubble size; at 1% gas by volume, over-reading of 3–6% is typical.
In transit-time ultrasonic meters, gas bubbles scatter the acoustic signal. Even 0.5% gas by volume is sufficient to significantly attenuate or completely block the acoustic path, causing the transmitter to enter a “no-signal” or “poor-signal” condition and either hold the last good reading or alarm. This is actually a safety advantage: the meter tells you the fluid is not single-phase, rather than silently reading wrong. In Doppler ultrasonic meters, gas bubbles are the measurement mechanism—the meter requires them to work. For liquids with significant and consistent gas entrainment, Doppler technology provides a measurement where transit-time cannot.
In electromagnetic meters, gas bubbles are largely ignored if they are small relative to the pipe diameter and evenly distributed—the magnetic field measurement integrates over the full pipe cross-section and the fluid average. For large slugs of gas or stratified flow where gas occupies the top of the pipe, the “empty pipe” detector will alarm.
FAQ 14: Can ultrasonic meters handle the vibration and noise in our industrial environment without giving false readings?
Vibration and acoustic noise are legitimate concerns for ultrasonic meters, and modern designs address them specifically. Mechanical vibration at the pipe wall can couple into clamp-on transducers and add noise to the acoustic signal. Most modern transit-time transmitters use frequency filtering to distinguish the measurement frequency (typically 100 kHz–1 MHz) from mechanical vibration frequencies (typically 1–1,000 Hz)—the separation is large enough that properly designed transmitters are not affected by typical industrial vibration levels.
The specific scenario that does cause problems is acoustic vibration in the measurement frequency range—generated by ultrasonic cleaning systems, certain pump types with acoustic signatures in the MHz range, or nearby ultrasonic welding equipment. These are uncommon but real installation constraints that should be flagged during pre-installation site assessment. Electromagnetic interference from variable-frequency drives (VFDs) can affect the 4–20 mA output signal from any transmitter (not just ultrasonic) if signal cables are routed alongside power cables without proper shielding. Standard instrumentation cable routing practice (separate conduit from power wiring, shielded cable with single-point earthing) eliminates this issue.
For technical support, meter selection consultation, or distributor partnership inquiries, visit www.jadeantinstruments.com or explore the complete flow meter product range including electromagnetic, turbine, ultrasonic, vortex, and Coriolis technologies.