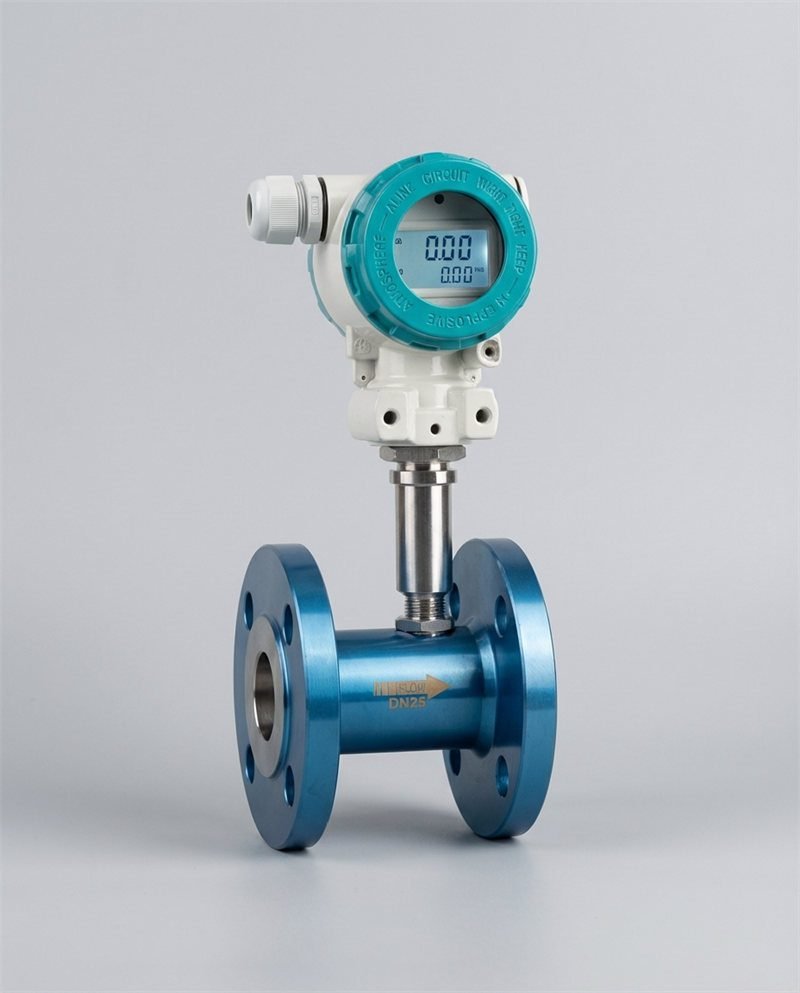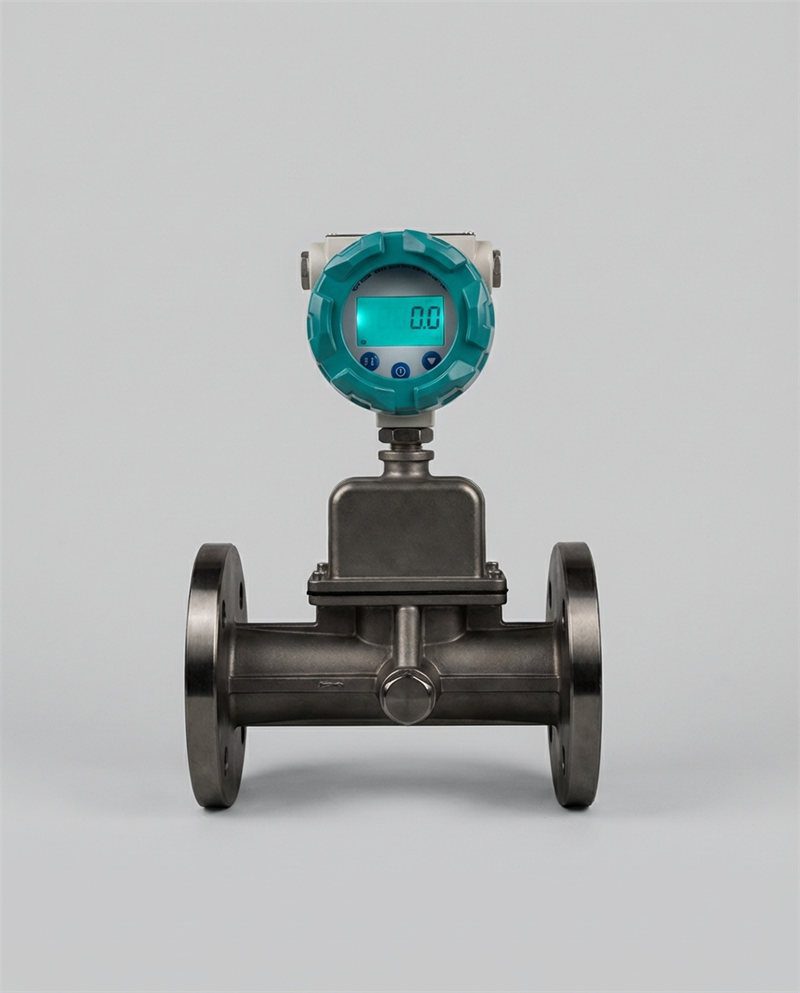
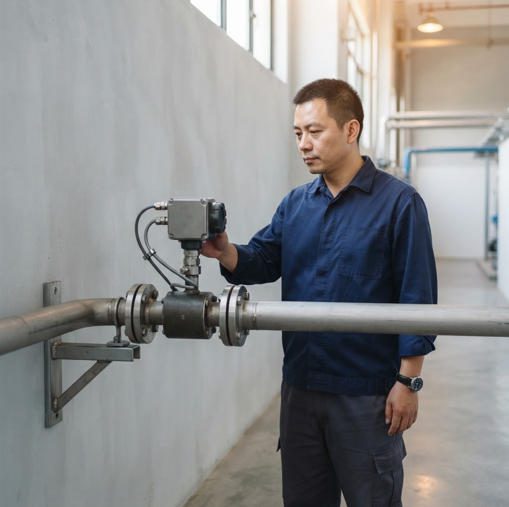

When you recommend the wrong thermal mass flow meter to your clients, the costs don’t stop at the purchase price. This real-world case study reveals how a single specification error cascaded into $847,000 in losses for a mid-sized chemical manufacturer—and how you can prevent this from happening to your customers.
Understanding the Stakes for Your Distributor Business
Why Flow Meter Selection Matters More Than Your Customers Think
Most plant managers think of a flow meter as a commodity purchase—a $1,500 to $4,000 instrument that measures gas moving through a pipe. What they don’t realize is that a misspecified meter doesn’t just measure flow incorrectly. It silently distorts every batch calculation, every raw material ratio, and every regulatory record that depends on it. By the time the damage surfaces, it has already compounded across months of production.
As a distributor or agent, you sit at the centre of this risk. You’re the technical bridge between a manufacturer’s datasheets and your customer’s real process. That position carries more accountability than most sales teams acknowledge.
The Ripple Effect of Incorrect Specifications
How Measurement Errors Compound Over Time
A thermal mass flow meter (a device that measures gas flow by detecting how much heat the moving gas carries away from a sensor element) with an ±8% accuracy error at low operating flow doesn’t produce one wrong reading. It produces thousands of wrong readings—every minute, every hour, every batch cycle. In a specialty chemical plant running 200 batches per year, a systematic 8% bias on a key gas feed means every single batch is formulated with the wrong ratio. The first 5 batches might pass quality control. By batch 50, process engineers start seeing unexplained yield drift. By batch 150, they’re filing regulatory documentation based on measurements that were never accurate to begin with.
The critical word here is systematic. Random errors cancel each other out over time. Systematic errors—caused by a meter that is fundamentally mismatched to its operating conditions—do not. They accumulate.
The Difference Between “Close Enough” and Accurate Specifications
There is a meaningful performance gap between a meter specified correctly for its actual operating range and one that was “close enough” on paper. A thermal mass flow meter rated for 0–100 SLPM (Standard Liters Per Minute—a volume flow rate referenced to standard temperature and pressure conditions, so it represents a true mass quantity regardless of process conditions) may be specified at ±1% full scale accuracy. That sounds precise. But if the actual process flow runs between 5 and 15 SLPM—just 5–15% of the meter’s full scale—that same ±1% full scale specification translates to a real-world accuracy of ±7% to ±20% of the actual reading. “Close enough” on the datasheet became unusable in the field.
Your Role as the Trusted Advisor
Why Distributors Are Increasingly Accountable for Application Outcomes
The purchasing dynamic has changed. Customers are no longer satisfied with a product recommendation followed by a purchase order. When a meter fails in the field—whether through outright malfunction or insidious specification error—they trace the conversation back to the person who recommended it. That’s you.
In the era of documented application discussions, email trails, and CRM records, the specification conversation lives forever. If your team recommended a meter without fully understanding the customer’s process variability, operating range, or gas composition, that gap in due diligence is visible in hindsight.
This is not a liability argument designed to frighten you. It is a business opportunity. Distributors who invest in genuine application expertise build a moat that price-focused competitors cannot cross. Every customer who experiences a specification failure with another supplier is a customer who becomes intensely loyal to the next distributor who prevents one.
How Specification Errors Damage Customer Relationships and Reputation
A customer who loses $847,000 because of a wrong meter recommendation does not quietly move on. They tell procurement managers. They write internal post-mortems. They may post in industry forums. In the tightly networked world of specialty chemical, pharmaceutical, and semiconductor manufacturing, one high-profile failure can cost you multiple accounts. Conversely, one high-profile prevention—where your team’s thoroughness averted a problem—can open entire vertical markets.
The Financial Reality Your Clients Face
Hidden Costs That Appear Months After Installation
The initial purchase and installation cost of a flow meter is the most visible number in any procurement conversation. What doesn’t appear in that number: the cost of off-spec product rework, the cost of regulatory audit preparation triggered by measurement anomalies, the cost of production downtime while an emergency replacement is expedited, the cost of customer complaints and potential contract penalties downstream, and the reputational cost of explaining to a regulatory body why your flow records were inaccurate for 18 months.
These costs are not hypothetical. They are the documented consequence of the case study you are about to read.
Why Warranty Claims Won’t Cover Specification Failures
Here is the uncomfortable truth that every distributor needs to understand: a meter that is operating exactly as designed—but was specified for the wrong application—is not a warranty claim. The manufacturer built a perfectly functional instrument. The failure was in the selection process. Warranty coverage applies to defects in materials and workmanship. It does not apply to a meter that was oversized for its actual operating range, that was calibrated for one gas composition and exposed to another, or that was installed without understanding seasonal flow variability. The financial exposure in a specification failure lands entirely on the customer and, increasingly, on the distributor who provided the recommendation.
The Chemical Manufacturing Case Study
The Company, The Problem, and The Consequences
Background: A Mid-Sized Specialty Chemical Manufacturer’s Operations
The company in this case study is a mid-sized specialty chemical manufacturer operating a multi-reactor batch processing facility. Their primary product line involves gas-phase reactions where precise ratios of two reactant gases—controlled to within 2–3% of target stoichiometry—determine both product purity and yield. They run approximately 220 production batches per year, with an average batch value of approximately $18,000 in finished goods.
Production Volume and Process Criticality
The facility processes roughly $3.96 million in annual product output from the affected reactor lines. Regulatory compliance is critical: the end-use applications for their specialty chemicals require adherence to EPA reporting standards and ISO 9001 quality management documentation. Every batch is accompanied by a measurement record that includes the gas flow data from the meters on the reactant feed lines. These records are submitted to customers and retained for regulatory audit purposes.
Why They Trusted the Initial Meter Recommendation
The plant’s instrumentation engineer received a quotation from their distributor for a thermal mass flow meter to replace an aging rotameter on the primary gas feed line. The distributor’s recommendation was based on the plant’s stated maximum flow requirement of 80 SLPM. The meter selected had a 0–100 SLPM range and a published accuracy of ±1% full scale. On paper, this appeared to be a conservative, well-specified installation. The plant accepted the recommendation without a detailed application audit. The meter was commissioned, passed initial calibration verification at full-scale flow, and was put into continuous service.
The Baseline Measurement Requirements They Thought They Had
The plant believed they had installed a meter accurate to within ±1 SLPM at any point in their operating range. What they actually had was a meter accurate to ±1 SLPM only near full scale. At their actual typical operating flows—which ranged from 8 to 22 SLPM depending on the reaction phase and batch type—the absolute accuracy remained ±1 SLPM, but that represented a relative error of 4.5% to 12.5% of actual flow. Nobody had checked this distinction.
How the Wrong Thermal Mass Flow Meter Was Selected
The Specification Error: Oversized Meter for Variable Flow Conditions
The core error was specifying a 0–100 SLPM meter for a process that almost never operated above 25 SLPM. The design maximum of 80 SLPM cited in the original enquiry represented a future capacity expansion scenario, not current operating reality. The distributor did not ask about actual operating flow distribution. They sized the meter for the stated maximum and moved on.
What the Distributor Missed During the Application Consultation
The application consultation lasted approximately 20 minutes and covered: fluid type (nitrogen-hydrogen mixture), pipe size, and connection specification. It did not cover: actual operating flow range (minimum, typical, and maximum), the percentage of operating hours spent at each flow level, seasonal or batch-to-batch variability in flow demand, or the gas composition variation across different batch types (the H₂/N₂ ratio changed from 60/40 to 80/20 depending on the product recipe).
The Gap Between Nameplate Specifications and Actual Operating Conditions
| Specification Parameter | Nameplate Value | Actual Operating Reality |
|---|---|---|
| Full Scale Flow | 100 SLPM | Maximum actual: 28 SLPM |
| Typical Operating Range | 0–100 SLPM | Typical: 8–22 SLPM (8–22% of FS) |
| Stated Accuracy | ±1% Full Scale | Real-world: ±4.5% to ±12.5% of reading |
| Gas Composition | N₂/H₂ mixture (stated) | Variable: 40/60 to 20/80 H₂/N₂ by batch type |
| Calibration Gas | Pure N₂ (factory standard) | Actual: variable H₂/N₂ mixture (no correction factor applied) |
| Turn-Down Ratio Required | ~12.5:1 (max/min actual flow) | Meter design: 10:1 effective accurate range |
| Installation Validation | None post-commissioning | Baseline accuracy check never performed at actual flow |
The Measurement Errors That Went Undetected for 18 Months
How ±8% Accuracy Degradation Flew Under the Radar
An 8% error on any single measurement reading is not dramatic enough to trigger an alarm in most process control systems. The DCS (Distributed Control System—the plant-wide computer network that monitors and controls all process instruments simultaneously) continued to log flow values that appeared numerically reasonable. The meter never flatlined. It never threw a fault code. It simply read the wrong value, consistently and quietly, for every operating hour over 18 months.
The compounding problem was the gas composition variation. When the plant ran H₂-rich batches (80% H₂, 20% N₂), the meter—calibrated for pure N₂—applied incorrect heat transfer assumptions. Hydrogen has a specific heat approximately 14 times higher than nitrogen per unit mass. Even with a standard conversion factor, the compositional drift between batch types introduced an additional 3–5% systematic error on top of the range-induced inaccuracy. The total measurement bias on H₂-rich batches reached approximately ±8.3% of actual flow.
Why Standard QA Checks Didn’t Catch the Problem
The plant’s quality assurance protocol included quarterly calibration verification—but the verification was performed at a convenient test flow of 70–80 SLPM, well within the meter’s accurate range. The meter passed every quarterly check. The problem was structural: calibration verification at full scale does not reveal performance at 10–20% of full scale. This is like testing a car’s fuel gauge only when the tank is full and declaring it accurate.
The False Confidence That Comes From “Acceptable” Readings
When the meter reported H₂ flows of 12.4 SLPM and the target was 12.0 SLPM, operators saw a 3.3% deviation and applied minor manual corrections. They attributed the persistent deviation to supply pressure fluctuations in the H₂ header—a plausible explanation that prevented anyone from questioning the meter’s fundamental accuracy. False confidence built by an instrument that appeared to be functioning normally is more dangerous than an instrument that fails outright.
The Financial and Operational Fallout
Batch Failures and Product Rejections ($340,000 in Losses)
Over 18 months, the systematic measurement error caused 23 batches to fall outside the product purity specification. At an average batch value of $14,800 net margin contribution, the batch rejection cost totalled approximately $340,400. Some batches were reworked at additional cost; others were disposed of entirely. In three cases, off-spec product reached a downstream customer before in-process QC could intercept it, triggering customer quality incidents.
Regulatory Compliance Violations and Fines ($180,000)
The inaccurate flow records submitted as part of batch documentation triggered an EPA greenhouse gas reporting discrepancy during a routine audit. The plant’s reported H₂ consumption volumes did not reconcile with procurement records, raising a red flag. The subsequent compliance investigation resulted in a corrective action requirement, retroactive reporting amendments, and regulatory fines totalling $180,000. An ISO 9001 recertification audit also flagged the measurement system inadequacy, requiring a documented corrective action plan with third-party verification—adding $27,000 in audit and remediation costs.
Emergency Replacement and Downtime Costs ($210,000)
Once the specification error was identified, the affected meter had to be replaced immediately. Emergency procurement of the correct Coriolis-type meter (a flow meter that measures mass flow by detecting the twisting force a moving fluid exerts on a vibrating tube—inherently accurate regardless of gas composition or density variation) cost $8,400 for the meter and $3,200 in installation materials. But the real cost was production downtime: the reactor line was shut down for 4.5 days while the replacement was installed, validated, and commissioned. At a production value of $44,000 per operating day for that reactor line, the downtime cost $198,000. Total replacement and downtime: $209,600.
Reputation Damage and Lost Contracts ($117,000 in Projected Revenue)
Two contract manufacturers who had been receiving specialty chemical batches from this facility declined to renew their supply agreements following the quality incidents. Both cited measurement system reliability as a concern. The combined annual revenue from these two contracts was $117,000. The plant was in active discussions to recover one relationship with additional quality audits and third-party verification, at further cost and distraction.
Root Cause Analysis—What Went Wrong
The Application Mistakes That Cost Real Money
Mistake #1: Confusing Nameplate Specifications With Real-World Performance
Why a Meter Rated for 0–100 SLPM Fails at 5–15 SLPM
Every flow meter has a published accuracy specification, but that specification is only valid across a defined operating range—not from zero to full scale. For a typical thermal mass flow meter with ±1% full scale (FS) accuracy, the absolute error is fixed regardless of the actual flow. At 100 SLPM, ±1 SLPM is a 1% relative error. At 10 SLPM, ±1 SLPM is a 10% relative error. The meter hasn’t changed. The physics hasn’t changed. But the practical accuracy at low flow has degraded by a factor of 10.
The Turn-Down Ratio Trap That Catches Distributors Unprepared
Turn-down ratio (also called rangeability) is the ratio of a meter’s maximum measurable flow to its minimum measurable flow while maintaining its accuracy specification. A thermal mass flow meter with a 10:1 turn-down and a 100 SLPM full scale is only accurately measuring flows down to 10 SLPM. Below that, accuracy degrades rapidly and is unspecified. In the case study above, the process regularly operated at 8 SLPM—below the meter’s minimum accurate flow threshold. Every reading below 10 SLPM was essentially an extrapolation, not a calibrated measurement.
The turn-down ratio is one of the most commonly overlooked specifications in distributor application reviews. Asking “what is the maximum flow?” without also asking “what is the minimum typical operating flow?” leaves half the relevant data on the table.
How to Read Performance Curves Your Customers Don’t Understand
Manufacturer performance curves (accuracy vs flow rate plots) show the real-world accuracy degradation at low flow. Most customers never look at these curves. Most distributors never share them. Building the habit of reviewing the performance curve at the customer’s actual typical operating flow—not the maximum design flow—is one of the highest-value habits a technical sales team can develop.
Mistake #2: Ignoring Process Variability During the Specification Phase
Why Static Flow Rate Estimates Aren’t Enough
A customer who says “our flow is about 80 SLPM” is giving you the number they remember from the last time someone asked. It may be the design capacity. It may be the peak flow. It may be a number from a proposal that was written 3 years ago. What it almost certainly is not is a validated description of the actual flow distribution across a full operating year.
The Cost of Overlooking Seasonal, Batch-to-Batch, and Demand Fluctuations
In batch chemical manufacturing, flow requirements vary by recipe, by season (if cooling water temperatures affect reaction rates), and by production schedule (capacity utilization varies). The 8–22 SLPM operating range in this case study—spanning nearly a 3:1 ratio—was entirely predictable if the distributor had asked about it. It was not discussed.
Questions You Should Be Asking (But Probably Aren’t)
To specify correctly, you need to understand:
- What is the minimum flow the process ever requires, and under what conditions?
- What percentage of annual operating hours is spent at each flow level?
- Does the flow rate change within a single batch cycle, or only between batches?
- Is there a startup or shutdown phase with flow rates outside the normal operating window?
- How frequently does the process run at maximum design capacity?
Mistake #3: Underestimating the Impact of Process Gas Composition Changes
How Thermal Mass Flow Meters Respond to Density Variations
Thermal mass flow meters work by measuring heat transfer between a heated sensor element and the flowing gas. The rate of heat transfer depends on the gas’s specific heat capacity (Cp—a measure of how much thermal energy the gas can absorb per unit mass) and its density. Different gases have different Cp values: hydrogen’s Cp is approximately 14 times higher than nitrogen’s. When a meter calibrated for one gas composition encounters a different composition, its heat transfer model is wrong, and its output is systematically biased.
This is not an obscure limitation. It is printed in every thermal mass flow meter manual. But when gas composition is described verbally during a quick sales conversation—”it’s a nitrogen-hydrogen mix”—without specifying the range of mixing ratios or the batch-to-batch variation, the distributor cannot catch this risk.
Why “Close Enough” Compensation Isn’t Acceptable in Chemical Manufacturing
Every thermal mass flow meter manufacturer publishes gas conversion factors (CFs)—multipliers that correct the meter’s N₂-referenced output when measuring a different gas. These factors work well for single-component gases (pure argon, pure CO₂). For variable-composition mixtures, they require either a fixed assumed composition or a real-time composition input. If neither is provided, the CF applied to a 60/40 H₂/N₂ mixture will be wrong when the composition shifts to 80/20 H₂/N₂—and the error is invisible unless the composition change is logged and tracked alongside the meter readings.
The Compensation Curve Errors That Compound Measurement Uncertainty
In the case study, the distributor specified a standard conversion factor for a nominal 70/30 H₂/N₂ mix. When the plant ran H₂-rich batches at 80/20, the applied CF introduced a 2.1% additional error on top of the range-induced inaccuracy. On N₂-rich batches at 40/60, the CF error was 1.8% in the opposite direction. The result: not only was the meter systematically biased, but the bias changed sign depending on the batch type. This pattern disguised itself as process variability for months.
Mistake #4: Skipping Proper Installation Validation
Why Post-Installation Verification Is Your Insurance Policy
The moment a meter is commissioned is the best time to establish a performance baseline. A baseline measurement—comparing the new meter’s output against an independent reference measurement at actual process conditions and actual operating flow rates—answers the question: “Is this meter performing as specified at the conditions it will actually see?” If the answer is no, the problem is caught before it compounds into $847,000. If the answer is yes, you have a documented record that protects both you and your customer.
The Commissioning Steps That Prevent 80% of Specification Failures
A proper commissioning protocol for a thermal mass flow meter installation should include: verification of meter zeroing at zero flow, accuracy check at three points across the actual operating range (not just at full scale), comparison against a calibrated reference instrument or mass balance at actual process gas composition, documentation of the gas conversion factor applied and the basis for selecting it, and sign-off by both the distributor’s application engineer and the plant’s instrumentation engineer.
How to Document Baseline Performance So Problems Surface Faster
A baseline performance record—even a simple one-page document with the test date, test conditions, reference measurement, and meter output—transforms future troubleshooting. When a problem emerges 12 months later, the first question becomes: “Has something changed since commissioning?” With a baseline, that question has a data-driven answer. Without one, it becomes a forensic investigation.
The Measurement Accuracy Impact
How ±8% Error Becomes a $847,000 Problem

Understanding Measurement Uncertainty in Chemical Processes
Why 2% Uncertainty Is Not the Same as 8% Uncertainty
A 2% flow measurement error on a $18,000 batch means the batch was formulated with a reactant ratio that was off by 2%. For most specialty chemical processes, a 2% ratio deviation is within process tolerance—the product still passes specification, customer complaints are rare, and regulatory records are defensible. An 8% error changes the calculus entirely. At 8%, reactant stoichiometry is materially wrong. Yield and purity are affected. Product that should have been in-specification fails QC. Regulatory records reflect measurements that never corresponded to actual mass flows.
How Errors Propagate Through Batch Calculations and Formulations
Batch formulation in chemical manufacturing uses the flow meter reading as a primary input. If the meter reads 12 SLPM when the actual flow is 13 SLPM (an 8% under-reading), the batch record documents a lower gas consumption than actually occurred. The formulation calculation assumes less reagent was delivered than was actually present. The product composition is therefore different from what the batch record describes. Every compliance document, every certificate of analysis, and every customer declaration of conformity is built on data that is factually incorrect.
The Domino Effect: One Wrong Meter Affecting Multiple Downstream Processes
| Downstream Impact | Triggered By | Financial Consequence |
|---|---|---|
| Off-spec product batches | Wrong gas ratio from measurement bias | $340,000 batch rejection losses |
| Regulatory reporting discrepancy | Inaccurate flow records submitted to EPA | $180,000 fines + audit costs |
| Emergency meter replacement | Root cause identified after 18 months | $209,600 downtime + procurement |
| Customer contract non-renewal | Quality incidents traced to measurement failure | $117,000 lost annual revenue |
| Total | $846,600 |
The Real Cost of Inaccuracy in This Industry
Product Quality Failures and Customer Complaints
Of the 23 off-spec batches, 3 reached customer hands. Each customer complaint triggered a formal corrective action request, an investigation report, and a concession procedure under the plant’s ISO 9001 quality management system. Beyond the direct cost, each incident consumed an estimated 40 hours of quality engineering and management time—time that was not available for improvement projects or capacity expansion planning.
Regulatory Documentation Failures (FDA, EPA, ISO Compliance)
The EPA’s greenhouse gas reporting requirements under 40 CFR Part 98 specify flow measurement accuracy requirements—typically ±5% error for flow meters used in GHG calculations. An ±8% systematic bias exceeded this threshold. The plant’s flow records for 18 months were effectively non-compliant. EPA enforcement action under these rules can reach $25,000 per day per violation; the plant’s $180,000 settlement represented a negotiated resolution that avoided the maximum penalty scenario.
The Hidden Cost of Rework and Reprocessing
Of the 23 failed batches, 14 were reprocessed at an average additional processing cost of $4,200 per batch—adding $58,800 in direct manufacturing costs not captured in the batch rejection figure. These rework costs appear in manufacturing overhead accounts, not in the quality incident log, making them invisible in post-incident financial summaries and therefore consistently underestimated in ROI calculations for meter upgrades.
Why Detection Was Delayed
The Gap Between Meter Output and Actual Process Problems
The measurement error was not dramatic enough to trigger process alarms. The meter was reading in a range that appeared plausible—8–22 SLPM when targets were 9–20 SLPM. The systematic bias meant the actual flow was consistently higher than indicated, but not so much higher that operators questioned the instrument. Process engineers noticed batch yield variability, but attributed it to raw material quality variation, seasonal temperature effects, and other factors that were genuinely variable in the process.
Why Operators Trusted the Readings Until Failures Mounted
Operators are trained to trust calibrated instruments. The meter had passed quarterly calibration checks. It had a current calibration sticker. It reported numbers within expected ranges. The human tendency to trust a recently calibrated, nominally functioning instrument is not a failure of vigilance—it is a rational response to a measurement system that had not been designed to reveal its own limitations.
How to Implement Early Warning Systems for Specification Drift
Effective early warning systems for thermal mass flow meter performance include: monthly mass balance reconciliation (comparing total gas consumed per batch against procurement records), periodic comparison of the meter output against a portable reference instrument at actual operating flow rates, tracking of batch yield and purity trends with statistical process control charts that flag shifts that correlate with meter installation dates or calibration events, and DCS alarm setpoints for meter output stability (detecting sudden shifts that may indicate sensor fouling or CF errors).
Industry-Specific Vulnerabilities
Why Chemical Manufacturing Is Particularly Vulnerable
The Unique Challenges of Chemical Process Measurement
Multiple Feed Streams with Varying Compositions
A specialty chemical reactor may have three, five, or eight gas feed streams, each measured by its own flow meter. Each meter has its own potential for specification error. When multiple meters are each carrying small biases, those biases combine in the batch calculation. A 3% bias on stream A and a 2% bias on stream B can combine into a 5–8% ratio error in the formulated product—even if neither individual error was large enough to trigger concern during routine monitoring.
Temperature and Pressure Fluctuations During Reactions
Exothermic and endothermic reactions change the temperature and pressure conditions in the feed lines during the reaction cycle. A thermal mass flow meter calibrated under stable conditions may see different heat transfer characteristics during the high-temperature phase of an exothermic reaction. This dynamic variability adds to the static specification error described in the case study.
The Criticality of Precise Stoichiometric Ratios
Stoichiometry (the precise quantitative relationship between reactants in a chemical reaction—too much or too little of any reactant changes the product yield, purity, and by-product profile) is non-negotiable in specialty chemical synthesis. Unlike bulk chemical production where a few percent deviation is absorbed by excess reagent strategies, specialty chemical reactions often have narrow windows of acceptable ratio deviation. The financial value of each batch makes accuracy economically critical; the regulatory requirements for documentation make it legally critical.
Why Biogas and Semiconductor Industries Face Similar Risks
Biogas: Composition Variability and Corrosive Environments
Biogas production involves a gas stream whose composition changes continuously as the biological fermentation process evolves. Methane content can vary from 45% to 70%; CO₂ content varies inversely; trace hydrogen sulfide (H₂S) is present and corrosive. A thermal mass flow meter specified for a nominal composition will carry a composition-induced accuracy error whenever actual composition deviates from the calibration basis—which in a biogas digester is almost always. Additionally, H₂S corrodes standard 316 stainless steel sensor materials, causing physical degradation that introduces additional measurement drift over time. Distributors who specify standard thermal mass meters for biogas applications without addressing these factors are creating future failures.
Semiconductors: Ultra-High Purity Requirements and Trace Gas Measurement
Semiconductor chip fabrication involves gas flows measured in sccm (Standard Cubic Centimeters per Minute—used for very small flow rates in semiconductor processes), where a 1% measurement error in a silane or dichlorosilane feed line translates directly to a 1% film thickness non-uniformity across a silicon wafer. The electrical performance specifications of modern transistors (gate oxide thickness tolerances of ±0.1 nm on layers that are 1–3 nm total) leave no room for gas flow measurement errors at the 1% level, let alone 8%. Wrong meter specification in a semiconductor fab doesn’t just cost money—it can shut down a production line.
How Each Industry’s Specifications Differ (And Why It Matters to Your Recommendations)
| Industry | Primary Accuracy Concern | Composition Risk | Regulatory Driver | Recommended Approach |
|---|---|---|---|---|
| Specialty Chemical | Stoichiometric ratio error | Variable feed compositions | EPA, ISO 9001 | Coriolis or composition-compensated TMF |
| Biogas | Composition variability + corrosion | CH₄/CO₂ ratio drift, H₂S | Environmental permit | Corrosion-resistant TMF with real-time CF update |
| Semiconductor | Ultra-precision at trace flows | Ultra-pure single component | SEMI standards, customer spec | High-end digital MFC with NIST traceability |
| Pharmaceutical | Batch record compliance | Inert gas blanketing | FDA 21 CFR Part 11 | Digital MFC with electronic audit trail |
Regulatory Pressure That Makes Accuracy Non-Negotiable
FDA, EPA, and ISO Requirements Your Customers Must Meet
- EPA 40 CFR Part 98: Flow meters used for greenhouse gas reporting must meet ±5% accuracy. Systematic errors above this threshold constitute a compliance violation.
- FDA 21 CFR Part 11: In pharmaceutical manufacturing, electronic flow records must accurately represent the physical measurement. Inaccurate instrument data embedded in validated batch records creates GMP violations.
- ISO 9001:2015: Requires that measurement instruments used in product conformity determination be calibrated and verified to known standards. A systematically biased meter—even one with a current calibration sticker—may violate Clause 7.1.5 if the calibration was not performed under conditions representative of actual use.
How Measurement Failures Trigger Compliance Audits
Regulatory auditors are trained to perform mass balance cross-checks: comparing reported gas consumption with procurement records, utility bills, and production outputs. A systematic measurement error of 8% will show up as a persistent discrepancy that experienced auditors recognize immediately. The audit trail that follows typically requires retroactive investigation of all production records since the last verified accurate measurement—which in this case was the commissioning date.
What Your Customers Should Have Done (And What You Should Do Now)
The Specification Process That Prevents $847,000 Losses

▶️ Watch: How Thermal Mass Flow Meter Technology Works – Sierra Instruments. Understanding the physics of heat transfer in thermal sensing helps you explain to customers exactly why operating range and gas composition matter so much to accuracy.
Step 1—The Detailed Application Audit You’re Probably Skipping
What Information You Actually Need to Collect
A complete application audit for a thermal mass flow meter specification requires, at minimum:
- Fluid identification: gas type, typical composition range (not just nominal), and worst-case composition extremes
- Full operating flow range: minimum, typical (most common), and maximum—with the percentage of operating time at each level
- Operating pressure range: normal and maximum, with expected fluctuation during operation
- Operating temperature range: process temperature at the measurement point, and ambient temperature range at the installation location
- Required accuracy: expressed as % of reading at the actual operating flow, not % of full scale
- Applicable regulatory standards: any EPA, FDA, ISO, or customer-specific measurement requirements
- Installation constraints: available straight pipe run, orientation, proximity to valves or fittings
The Process Variability Questions That Reveal Hidden Risks
“What is the typical flow rate?” is an inadequate question. The questions that reveal hidden risks are: “What is the lowest flow you ever need to measure accurately, and how often does the process run at that level?” and “Does your gas composition change between different product recipes or operating modes?” and “Have you experienced any unexplained batch yield variations in the past two years?”
That last question is particularly powerful. Unexplained yield variations in batch processes are frequently caused by measurement errors that have not yet been identified. Asking it positions you as a diagnostician, not just a vendor—and it occasionally reveals problems your new meter can solve before the customer even knew they had them.
How to Document Assumptions So Accountability Is Clear
Every significant application assumption—”customer confirms flow does not drop below 15 SLPM,” “gas composition is fixed at 70/30 H₂/N₂,” “no regulatory compliance measurement requirements apply”—should be documented in writing and confirmed by the customer before an order is placed. This is not bureaucracy. It is the professional equivalent of a doctor getting informed consent. It protects the customer from accepting a meter without understanding its limitations, and it protects you from being held accountable for assumptions you made in good faith with insufficient information.
Step 2—Matching Meter Type to Application Reality
When Thermal Mass Flow Meters Are the Right Choice (And When They’re Not)
Thermal mass flow meters excel in applications involving clean, dry single-component gases or well-characterized gas mixtures with known, stable compositions, operating at moderate temperature and pressure, where the flow range stays comfortably within the meter’s specified accurate range. They are particularly effective for compressed air monitoring, nitrogen blanketing, and process gas applications in semiconductor and pharmaceutical environments where gas purity is maintained and composition is controlled.
They are not the right choice—or require careful supplementary specification—when: gas composition varies significantly batch-to-batch; the operating flow range spans less than 20% of the meter’s full scale for most of its operating hours; the gas contains moisture, particulates, or corrosive components that can coat or degrade the thermal sensor; or when the application requires regulatory compliance documentation and the meter’s calibration basis does not match actual operating conditions.
For applications where gas composition variability or wide flow range is a hard constraint, a Coriolis mass flow meter—which measures mass flow directly through inertial forces independent of gas composition—is typically the more defensible specification. The higher capital cost is real, but so is the insurance it provides against the failure mode described in this case study. Explore the complete flow meter selection guide from Jade Ant Instruments to match meter technology to your application reality.
Turn-Down Ratio Requirements: The Number That Predicts Accuracy
Before finalizing any thermal mass flow meter specification, calculate the required turn-down ratio:
In the case study: Maximum = 28 SLPM, Minimum = 8 SLPM. Required turn-down = 28/8 = 3.5:1. This is a modest requirement that most quality thermal mass meters can meet—if the meter is sized appropriately. The error was not in the required turn-down itself, but in sizing the meter at 100 SLPM full scale, which shifted the effective turn-down requirement to 100/8 = 12.5:1—exceeding the meter’s accurate range.
Compensation Strategy: Why One-Size-Fits-All Approaches Fail
For applications with variable gas composition, three strategies exist: (1) specify a meter with multi-gas CF capability and provide the composition input from an online gas analyser or a scheduled CF update protocol tied to recipe changes; (2) specify a Coriolis meter whose measurement principle is inherently composition-independent; (3) accept that the measurement will carry composition-induced error and quantify and document that error as part of the measurement uncertainty budget. Only option 3 requires no additional instrumentation, but it requires explicit agreement from the customer and their regulatory contacts that the documented uncertainty is acceptable. Option 3 is frequently deployed implicitly—without the customer or distributor realizing the error budget they are accepting.
Step 3—Validation and Commissioning That Catches Errors Early
The Baseline Performance Test That Should Happen Before Acceptance
The acceptance test for a new thermal mass flow meter installation should include at minimum three test points: 100% of the maximum actual operating flow, 50% of the maximum actual operating flow, and the minimum actual operating flow at which accuracy is required. Each test point should be compared against an independent reference—a portable Coriolis reference meter, a calibrated rotameter of appropriate range, or a mass balance using a precision weighing system. If all three test points are within specification, document them and accept the installation. If any point fails, investigate before the meter enters service.
How to Compare Meter Output Against Independent Verification
The most practical independent reference for field commissioning is a calibrated portable Coriolis meter (available from multiple manufacturers as a rental instrument for commissioning purposes), which provides composition-independent mass flow measurement against which the installed thermal mass meter can be compared at actual process gas conditions. The cost of a one-day rental plus engineering time is typically $800–$1,500. Against the $847,000 loss documented in this case study, the cost-benefit calculation requires no explanation.
Step 4—Ongoing Monitoring That Prevents Future Surprises
Why Periodic Recalibration Is Your Early Warning System
Industry best practice for thermal mass flow meters in critical process applications suggests calibration intervals of 6–12 months for reactive or compositionally variable gas services, and 12–24 months for stable clean-gas applications. But recalibration alone is not sufficient if it is performed at the wrong test conditions. Calibration at 80–100% of full scale while the process typically operates at 10–20% of full scale will miss the performance degradation that matters most. Calibration intervals must specify both the frequency and the test flow points—which must include the actual typical operating range.
For more on how to structure calibration intervals and what to check, the Endress+Hauser flow calibration management guide provides a rigorous framework applicable to any flow technology.
The Customer Communication That Keeps You Positioned as the Expert
Proactive outreach beats reactive damage control every time. A quarterly email to key accounts—”Here is a short checklist of the three things that most commonly cause thermal mass flow meter performance to drift: sensor fouling, gas composition changes, and supply pressure variation. Here is how to check each one in 10 minutes”—builds trust, keeps your name in front of the right decision-makers, and often surfaces problems before they become expensive.
Protecting Your Distributor Business
Risk Management Strategies for Your Sales Team
How to Identify High-Risk Applications Before They Become Problems
Red Flags in Customer Specifications That Signal Trouble Ahead
Not every application carries the same specification risk. The following conditions in a customer’s specification should trigger a deeper application review before any meter recommendation is made:
- Stated maximum flow that is significantly higher than the typical operating flow
- Gas composition described as “variable” or “depends on the recipe”
- Applications in regulated industries (pharmaceutical, semiconductor, specialty chemical, food and beverage)
- Applications involving gas mixtures where the customer cannot provide a precise composition range
- Replacement of a “failed” meter without root-cause investigation of the previous failure
- Customers who are asking for the cheapest available meter for “just monitoring”
The Conversations That Reveal Hidden Process Complexity
The most valuable application information rarely appears in the initial customer enquiry. It surfaces in conversation. Questions such as: “Walk me through what happens during a typical production batch from startup to shutdown—when does the flow change, and by how much?” and “Have you had any unexplained quality problems in the past year that you haven’t been able to fully explain?” are diagnostic questions that separate competent technical sales from order-taking.
When to Recommend a More Expensive (But Correct) Solution
There will be applications where the technically correct solution costs 40–60% more than the alternative a customer is requesting. Recommending the correct solution in these cases—clearly explaining the technical reason, documenting the recommendation, and letting the customer make an informed decision—is both the ethical and the commercially smart approach. Customers who are pushed toward cheaper solutions and experience failures remember the experience. Customers who were advised toward the correct solution—even if they declined it—remember that advice when a failure occurs somewhere else. In either case, your credibility is built by the quality of your technical judgement, not the size of the initial sale.
Documentation Practices That Protect Your Liability
The Specification Confirmation Email That Prevents “He Said/She Said”
After every substantive application discussion, send a summary email to the customer that documents: the application parameters you discussed, the assumptions your recommendation is based on, the specific meter you recommended and why, and any limitations or conditions under which the recommendation applies. This takes 10 minutes. It is the most cost-effective risk management tool available to a distributor.
A simple format works: “To confirm our discussion today: the application is [gas type], [flow range], [pressure], [temperature]. Based on these parameters, I recommend [meter model] for the following reasons. Please note that this recommendation assumes [key assumptions]. If any of these parameters change, please let us know before ordering.” This email creates a professional record that protects both parties and signals to the customer that they are dealing with a technically competent organization.
Why Application Notes Matter More Than Purchase Orders
A purchase order is a financial document. An application note is a technical document. The purchase order captures what was bought. The application note captures why it was bought and what it was expected to do. In a warranty dispute, a regulatory audit, or a post-incident investigation, the application note is the document that determines accountability. Distributors who generate application notes for every significant sale have a professional record that stands up to scrutiny. Those who do not are relying on memory, which erodes, and email threads, which are incomplete.
Building Customer Relationships That Survive Specification Failures
The Proactive Follow-Up That Catches Problems Early
A 30-day follow-up call after any new meter installation is standard practice for distributors who take application outcomes seriously. The question to ask: “Is the meter reading what you expected at your actual operating conditions?” This question, asked early, catches the majority of specification problems before they compound. Most customers will answer honestly if asked directly. Few will volunteer the information unprompted, because they assume minor deviations are normal.
How to Position Yourself as a Problem-Solver, Not Just a Vendor
The distributors who build lasting relationships in the flow instrumentation sector are those who bring information their customers wouldn’t otherwise have—case studies from similar applications, calibration reminders, regulatory updates that affect measurement requirements, or technical alerts when a product line is updated in a way that affects existing installations. Being the person who tells a customer about a regulatory change before their auditor does creates the kind of trust that survives price competition.
Training Your Team to Ask the Right Questions
The Application Assessment Checklist Every Sales Rep Needs
Every sales representative who handles thermal mass flow meter specifications should be able to work through the following checklist before making any recommendation:
- Fluid: What gas or gas mixture? What is the composition range?
- Flow range: What is the minimum, typical, and maximum flow? How much time is spent at each level?
- Pressure: What is the operating pressure range? Does it fluctuate significantly?
- Temperature: What is the process temperature at the measurement point? What is the ambient temperature range?
- Accuracy: What accuracy is required, expressed as % of reading at the typical operating flow?
- Regulatory: Are there any EPA, FDA, ISO, or customer-specific measurement documentation requirements?
- Installation: What is the available straight pipe run upstream? Are there valves, fittings, or other disturbances nearby?
- Validation: Is there an opportunity to perform a baseline performance check at commissioning?
Case Study Lessons Applied to Other Industries
How These Mistakes Show Up in Biogas and Semiconductor Applications

Biogas Production: Why Composition Variability Creates Measurement Nightmares
The Methane/CO₂ Ratio Problem and Thermal Mass Flow Meter Compensation
A biogas stream from an anaerobic digester (a sealed tank where microorganisms break down organic material in the absence of oxygen, producing a mixture of primarily methane and carbon dioxide) typically contains 55–65% CH₄ and 30–45% CO₂, with the ratio shifting continuously as the biological process evolves. A thermal mass flow meter calibrated for a fixed 60/40 CH₄/CO₂ composition will carry a systematic error whenever the actual composition deviates from that basis.
For a biogas plant selling power under a renewable energy feed-in tariff where payment is based on gas energy content, a 5% systematic flow measurement error on a plant producing 500 m³/hour of biogas represents an annual revenue error of approximately €40,000–€80,000 (depending on the tariff rate), depending on whether the meter over-reads or under-reads relative to the energy content.
How Moisture and Trace Compounds Affect Meter Accuracy
Biogas typically carries saturated water vapour and trace amounts of H₂S (5–500 ppm). Water vapour condenses on the thermal sensor in cold ambient conditions, coating the sensing element and reducing heat transfer—causing the meter to progressively under-read as the coating builds up. H₂S corrodes standard sensor materials over months of continuous exposure. Both effects are gradual and invisible in routine monitoring unless specifically tested for. A distributor who specifies a standard thermal mass meter for biogas without addressing moisture protection and material compatibility is delivering a meter with a built-in failure timeline.
Semiconductor Manufacturing: Ultra-High Purity Requirements and Trace Gas Measurement
Why Standard Thermal Mass Flow Meters Fail in Semiconductor Cleanrooms
Semiconductor-grade thermal mass flow controllers (MFCs—Mass Flow Controllers, a term used interchangeably with TMC in the semiconductor industry) must meet SEMI F-1 standards for ultra-high purity (UHP) gas handling, which prohibit wetted materials or surface finishes that can outgas (release trace chemical contaminants into the gas stream) or accumulate deposits that affect gas purity. Standard industrial thermal mass meters—designed for process gas applications at 99.5% purity levels—have internal geometries and surface finishes that are entirely incompatible with the 99.9999% (6N) purity requirements of semiconductor precursor gas delivery.
The ppb-Level Accuracy Requirements That Demand Specialized Solutions
Modern sub-10 nm transistor fabrication processes require gas flows to be controlled with uncertainties less than 0.5% of reading at flows ranging from 5 sccm to 50 slm—a 10,000:1 range that demands high-end MEMS-based digital MFC technology. A distributor who quotes a standard industrial thermal mass meter for a semiconductor application because “it’s cheaper and the specs look close” is making a specification error with potentially seven-figure consequences.
Cross-Industry Pattern Recognition
The Common Specification Errors That Appear Across All Three Industries
The same four mistakes appear in every industry: oversizing the meter relative to actual operating flow; ignoring composition variability; skipping commissioning validation at actual process conditions; and specifying for the easy questions (maximum flow, pipe size, connection type) while leaving the hard questions (minimum flow, composition range, regulatory requirements) unasked. The industries differ in their cost of failure and their regulatory framework, but the root cause pattern is identical.
How to Position Your Expertise Across Multiple Vertical Markets
Distributors who develop demonstrated expertise in one industry can transfer the specification discipline—not just the product knowledge—to adjacent markets. The application audit protocol that prevents specification failures in specialty chemical manufacturing is the same protocol that prevents them in biogas and semiconductor applications. The questions differ in their technical vocabulary; the underlying framework is identical.
Building Your Competitive Advantage
How to Differentiate Your Distribution Business
Becoming the Application Specialist Your Customers Desperately Need
The Knowledge Gap That Most Distributors Ignore
Most flow meter distributors can describe the difference between a thermal mass flow meter and a Coriolis meter. Far fewer can explain, quantitatively, the accuracy impact of operating a 100 SLPM thermal mass meter at 10 SLPM in a variable-composition gas application. That second level of knowledge—the ability to model the real-world performance impact of a specification decision—is where genuine expertise lives, and it is where the majority of distributors compete weakly.
Developing this expertise does not require an engineering degree. It requires investing time in understanding the performance curves, operating specifications, and failure modes of the meter technologies you sell. For distributors working with Jade Ant Instruments‘ portfolio of thermal, electromagnetic, vortex, turbine, Coriolis, and ultrasonic flow meters, the full range of application support documentation, selection guides, and technical training resources provides the foundation for building this expertise systematically.
How to Develop Industry-Specific Expertise That Justifies Premium Pricing
Expertise is demonstrated through behaviour, not claims. A distributor who includes a written application note with every thermal mass flow meter quotation—documenting the operating range analysis, the turn-down ratio calculation, and the gas composition assumption—demonstrates expertise through the act of doing it. A distributor who calls back 30 days after installation to verify performance demonstrates commitment through follow-through. These behaviours build the reputation that justifies premium pricing over purely price-driven competitors.
Offering Value-Added Services That Competitors Can’t Match
Application Audits and Specification Validation Services
A formal application audit service—where your team reviews a customer’s existing meter installations against their current operating conditions and identifies potential specification mismatches—is a high-value service that most customers would pay for if positioned correctly. Framed as a “measurement system health check,” it creates direct opportunities to identify and replace undersized, oversized, or compositionally mismatched instruments, while demonstrating technical credibility that strengthens the customer relationship regardless of whether an immediate sale results.
Commissioning and Baseline Performance Documentation
Offering to perform a calibrated commissioning check at actual process conditions—using a portable Coriolis reference meter—as a paid service differentiates you from competitors who ship meters and consider the sale complete. The service typically costs $800–$2,500 per installation depending on complexity. More importantly, it creates a documented performance baseline that protects the customer’s measurement system and your own professional reputation simultaneously.
Creating Accountability Structures That Protect Relationships
Performance Guarantees That Demonstrate Confidence in Your Recommendations
A performance guarantee—”If this meter does not achieve the specified accuracy at your actual operating flow conditions within 90 days of commissioning, we will replace it at our cost”—is only risky for distributors who are not confident in their specifications. For distributors who have done the application audit properly and selected the correct instrument, it is a nearly risk-free commitment that signals a level of confidence competitors rarely match. It is also a powerful commercial differentiator in competitive tenders.
For a comprehensive view of how Jade Ant Instruments compares across flow meter technologies, explore their technical comparison guide—it provides the distributor with detailed application guidance across the full meter portfolio.
Action Plan for Your Sales Team
Implementing These Lessons Starting This Week

Immediate Actions to Reduce Specification Risk
Audit Your Last 20 Thermal Mass Flow Meter Installations
Pull the application records—or reconstruct them from memory and CRM notes—for your last 20 thermal mass flow meter installations. For each one, ask: What was the stated maximum flow? What is the likely actual typical operating flow? Is that typical operating flow above 20% of the meter’s full scale? Was gas composition documented and used to verify the conversion factor? Was any commissioning validation performed?
This audit will likely reveal 3–5 installations that carry similar vulnerabilities to the case study. These are not failures yet—but they are candidates for a proactive customer conversation.
Reach Out to Those Customers With a “Compliance Verification” Conversation
Contact the customers identified in your audit with a straightforward message: “We’re conducting a proactive review of thermal mass flow meter installations in your industry to ensure they’re performing within specification at actual operating conditions. Can we schedule a 20-minute call to review your installation?” Most customers will appreciate the initiative. Some will reveal problems they haven’t fully diagnosed. A few will already be experiencing the early symptoms of the issues described in this case study.
Medium-Term Improvements to Your Specification Process
Develop an Application Assessment Template Specific to Your Target Industries
A one-page application assessment form—tailored to the specific questions that matter for thermal mass flow meter specification in your primary target industries—is the single most impactful process improvement your team can implement. It takes 2–3 hours to develop, and it transforms every application discussion from a free-form conversation into a structured data collection exercise. It also signals professionalism to customers who are used to being asked only for pipe size and maximum flow.
Establish a 90-Day Post-Installation Follow-Up Protocol
A calendar trigger for a 30-minute follow-up call or site visit 90 days after every thermal mass flow meter installation costs almost nothing and catches the majority of early-stage specification problems before they compound. The call agenda: “How is the meter performing? Any unexpected readings? Any process changes since installation? Any scheduled changes to gas composition or operating range?” Four questions. Thirty minutes. Insurance against $847,000 problems.
Long-Term Positioning as the Trusted Advisor
Build Relationships With Application Engineers at Key Customers
The most valuable relationship in a customer’s organization is not with the purchasing manager—it’s with the process engineer or instrumentation engineer who understands the technical requirements and influences specifications. These individuals are usually willing to engage in substantive technical conversations if you can bring real value. Sharing relevant technical papers, calibration best practice guides, or application case studies—such as this one—is a legitimate and effective way to build these relationships over time.
Metrics to Track Your Progress
A specification-focused distributor should track performance using metrics beyond revenue and margin:
| Metric | Target | Why It Matters |
|---|---|---|
| % of installations with documented application audits | >80% within 12 months | Measures discipline of specification process |
| 30-day post-installation follow-up completion rate | >90% | Measures commitment to application outcomes |
| Warranty claims related to specification errors | Trending toward zero | Measures specification quality improvement |
| Customer satisfaction score on specification accuracy | >4.5/5.0 | Measures customer perception of technical competence |
| Revenue from value-added services (audits, commissioning) | Growing quarter-on-quarter | Measures progress on service-based differentiation |
The Real Cost of Cutting Corners
Why This Case Study Matters to Your Bottom Line
The $847,000 loss in the chemical manufacturing case study represents not just a customer’s pain—it represents a warning signal for your distribution business. Every customer who experiences a specification failure is a customer you risk losing. Every dollar they lose is a dollar that could have been invested in additional orders from you.
What makes this case study particularly valuable is not the size of the loss—it is the ordinariness of the mistakes. There was no catastrophic oversight, no reckless shortcut, no obvious red flag that any competent person would have caught. There was a reasonable application discussion that missed three specific questions, a meter selection that was defensible on paper, and 18 months of systematic measurement error that was invisible to everyone until the financial damage was done.
The companies that thrive in flow instrumentation distribution are not the ones with the lowest prices. They are the ones who take specification seriously, invest in application expertise, and position themselves as trusted advisors rather than order-takers. Every customer conversation you approach with a structured application audit instead of a datasheet comparison is a step toward that positioning.
Your customers need you to be the expert they can’t afford not to consult. This case study gives you the evidence and the framework to prove it.
🔧 Schedule Your Specification Risk Audit Today
Don’t wait for a $847,000 problem to teach you the cost of specification errors. Contact the application engineering team at Jade Ant Instruments to audit your current customer installations and identify potential vulnerabilities before they become expensive failures.
Schedule Your Free 30-Minute Risk Assessment →
📊 : Download the Flow Meter Selection Guide
If you’re not yet familiar with the full range of flow meter technologies and their application boundaries, the Jade Ant Instruments Flow Meter Selection Guide provides a structured framework for matching meter technology to process requirements—the starting point for every specification conversation.
📧 Review the Thermal Mass Flow Controller Comparison
For applications where you’re weighing thermal mass technology against alternatives, the Thermal Mass Flow Controller vs. Conventional Flow Meters guide provides the quantitative TCO framework and decision logic your team needs to make confident, defensible recommendations.
Glossary of Key Terms
Turn-Down Ratio (Rangeability): The ratio of a meter’s maximum to minimum accurately measurable flow. A 10:1 turn-down meter rated at 100 SLPM is only accurate down to 10 SLPM. Below that threshold, accuracy is unspecified and typically degrades rapidly.
Full Scale (FS) Accuracy vs. % Reading (Rd) Accuracy: FS accuracy is a fixed absolute error—±1% of 100 SLPM = ±1 SLPM at all flows. % Reading accuracy is proportional—±1% Rd at 10 SLPM = ±0.1 SLPM. FS accuracy gets worse as a proportion of actual flow; % Rd accuracy stays constant. For variable-flow applications, % Rd specifications are significantly more informative.
Gas Conversion Factor (CF): A multiplier applied to a thermal mass flow meter’s output (referenced to the factory calibration gas, typically N₂) to calculate the actual flow of a different gas. Derived from the gas’s specific heat and density relative to N₂. Incorrect CF selection is a leading cause of systematic measurement error.
Stoichiometric Ratio: The precise quantitative relationship between reactants in a chemical reaction. A meter that misreads a reactant flow by 8% delivers a formulation that is 8% away from the target stoichiometry—which translates directly into yield loss, purity failure, and off-spec product.
Systematic Error vs. Random Error: A systematic error is a consistent, directional bias in measurement—the meter always reads high or always reads low by a predictable amount. Random errors scatter around the true value and cancel out over time. Specification failures produce systematic errors, which compound with every reading and never self-correct.
Coriolis Flow Meter: A meter that measures mass flow by detecting the inertial force a moving fluid exerts on a vibrating tube. This measurement principle is independent of fluid density, temperature, pressure, or composition—making Coriolis meters the correct choice when gas composition is variable and thermal mass flow meters’ composition-dependence cannot be adequately managed.
Frequently Asked Questions
1. How do I know if a thermal mass flow meter is oversized for my application?
An oversized thermal mass flow meter is one where the actual typical operating flow is below approximately 20% of the meter’s full scale range. To check this: divide your actual typical operating flow by the meter’s full scale range. If the result is less than 0.20 (20%), the meter is operating in the lower portion of its range where full-scale accuracy specifications translate to high relative errors. The correct approach is to re-specify the meter at a full scale range that places typical operating flow between 40% and 80% of full scale—the zone where thermal mass meters deliver their published accuracy.
2. What’s the difference between accuracy at full scale and accuracy at actual operating conditions?
A thermal mass flow meter with ±1% full scale (FS) accuracy has an absolute error of ±1 SLPM for a 100 SLPM meter, regardless of the actual flow. At 100 SLPM, that’s ±1% relative error. At 10 SLPM, it becomes ±10% relative error. At 5 SLPM, it’s ±20%. Full scale accuracy specs look precise in datasheets but can mask extremely poor real-world performance at low flows. Always ask manufacturers for the accuracy specification expressed as % of reading at your actual minimum and typical operating flow rates, not just at full scale.
3. Why does my meter reading change when my process gas composition changes?
Thermal mass flow meters measure heat transfer between a heated sensor element and the flowing gas. The amount of heat transferred depends on the gas’s specific heat capacity (Cp) and density—both of which are unique to each gas composition. When your process gas composition changes (for example, from 60% H₂ / 40% N₂ to 80% H₂ / 20% N₂), the heat transfer characteristics change, and the meter’s reading shifts accordingly unless a corrected gas conversion factor (CF) is applied. If your process composition varies batch-to-batch, a single fixed CF will be wrong for some batches, introducing a systematic bias that changes sign depending on whether the actual composition is richer or leaner in the high-Cp component.
4. Should I be concerned about the turn-down ratio specification on my thermal mass flow meter?
Yes—turn-down ratio is one of the most important and most commonly overlooked specifications in thermal mass flow meter selection. Turn-down ratio (also called rangeability) defines the range over which the meter maintains its published accuracy specification. A 10:1 turn-down meter rated at 100 SLPM is only accurate between 10 and 100 SLPM. If your process requires accurate measurement at 8 SLPM, this meter is outside its accurate range. To calculate the required turn-down: divide your maximum required flow by your minimum required flow. Compare this to the manufacturer’s stated turn-down ratio. If your required ratio exceeds the meter’s rated turn-down, either choose a smaller full-scale range or specify a different meter technology.
5. How often should thermal mass flow meters be recalibrated?
Industry best practice recommends calibration intervals of 6–12 months for thermal mass flow meters in reactive gas or variable-composition services, and 12–24 months for clean, stable-composition gas applications. The critical factor that most maintenance programs miss is that recalibration must be performed at the actual operating flow range, not just at or near full scale. A calibration that only tests meter performance at 70–100% of full scale will not detect accuracy degradation at the 10–25% of full scale range where many thermal mass meters actually operate. Work with your calibration service provider to specify test points that match your actual process conditions.
6. Can a meter specification error cause regulatory compliance violations?
Yes, and the case study above documents exactly how this happens. EPA 40 CFR Part 98 requires flow meters used for greenhouse gas reporting to meet ±5% accuracy. A systematically biased thermal mass flow meter exceeding this threshold renders all associated emissions records non-compliant. FDA 21 CFR Part 11 requires electronic records—including flow data embedded in batch records—to accurately represent physical measurements. ISO 9001:2015 Clause 7.1.5 requires calibration under conditions representative of actual use. A meter calibrated at full scale but operated at 10% of full scale may be technically in calibration while systematically failing its measurement purpose. All three of these regulatory frameworks can be triggered by a specification error that was never intended to create a compliance issue.
7. What questions should I ask my distributor before ordering a thermal mass flow meter?
Ask your distributor: What accuracy does this meter provide at my actual minimum operating flow (not at full scale)? What turn-down ratio does this meter support, and does my required flow range fit within it? What gas conversion factor should be applied for my gas composition, and how sensitive is the meter’s accuracy to composition changes? What commissioning validation is included or recommended? What recalibration interval and protocol do you recommend for my application? If your distributor cannot answer these questions with specific numbers and technical explanations, consider whether their application knowledge is sufficient for your specification needs. The 8 flow meter distributor mistakes guide from Jade Ant Instruments covers the most common gaps in distributor technical practice.
8. How do I know if my current meter installation is at risk for the problems described in this case study?
Red flags that indicate a potentially vulnerable thermal mass flow meter installation include: the meter’s full scale range is more than 5 times the typical operating flow; gas composition varies between operating modes or batch types; no commissioning validation was performed at actual operating conditions; the meter is in a regulated application (EPA, FDA, ISO) and recalibration is not performed at the actual operating flow range; there have been unexplained batch yield variations, product purity deviations, or operator complaints about inconsistent readings. If two or more of these conditions apply, a proactive performance verification is warranted.
9. What’s the cost difference between getting the specification right the first time versus fixing it later?
Based on the case study documented in this article: correct specification at installation would have involved a one-day application audit ($0 from a quality distributor), selection of an appropriately sized or Coriolis-class meter (approximately $3,000–$8,000 premium over the misspecified instrument), and a commissioning validation check ($800–$1,500 for a portable reference measurement). Total additional upfront cost: approximately $4,000–$10,000. Total cost of the specification failure: $846,600. The ratio of prevention cost to failure cost is approximately 1:85 to 1:210. No investment in specification quality has a lower cost or higher return in flow instrumentation.
10. Why would a distributor recommend an oversized meter if it creates measurement problems?
The honest answer involves a combination of factors: incomplete application information (the customer only stated a maximum flow, not the operating range), time pressure in the sales process, inventory or lead-time considerations that favour stocked items, unfamiliarity with the operating-range impact on full-scale accuracy specifications, and—occasionally—higher margin on premium-range meters. None of these reasons reflect bad faith, but all of them represent gaps in specification discipline that customers are entitled to demand their distributors close. The standard to hold your distributor to is simple: can they show you the accuracy specification at your actual minimum operating flow, calculated using the meter they’re recommending? If not, the specification isn’t complete.
11. How does process variability affect meter selection?
Process variability—the range of flows, temperatures, pressures, and compositions your process actually experiences during normal operation—is the single most important input to a correct meter specification. Static flow estimates (a single maximum flow figure) capture only one point in what is typically a distribution of operating conditions. For variable processes, the correct specification process involves characterizing the operating envelope: minimum, typical, and maximum values for flow, composition, and process conditions, plus the percentage of operating time spent at each level. A meter must perform accurately across this entire envelope, not just at its corners.
12. What role does installation and commissioning play in preventing measurement errors?
Proper installation and commissioning prevents the majority of specification-related failures. Installation issues that matter most for thermal mass flow meters: ensuring the meter is oriented with the correct flow direction; providing adequate straight pipe run to avoid upstream turbulence effects; verifying that the installation is not subject to vibration that can affect the sensor; and confirming that the process temperature and pressure at the meter location match the conditions assumed in the specification. Commissioning validation—testing the meter at actual process conditions against an independent reference—is the safety net that catches specification errors before they compound. A detailed commissioning guide from Yokogawa covers common commissioning gaps and their consequences.
13. Are there alternatives to thermal mass flow meters for applications where they’ve failed?
Yes. The most important alternative for applications where gas composition variability is the root cause of thermal mass meter failure is the Coriolis mass flow meter—a device that measures mass flow through inertial forces independent of gas composition or density. Coriolis meters cost 2–4 times more than comparable thermal mass meters but eliminate composition-induced measurement error entirely. For applications where the primary failure mode is operating range mismatch (meter oversized relative to actual flow), simply respecifying a thermal mass meter with a smaller full scale range and appropriate turn-down ratio often resolves the problem at no additional technology cost. The Coriolis vs. magnetic, turbine, and ultrasonic comparison guide from Jade Ant Instruments provides structured guidance on selecting between these technologies.
14. How can I protect my company from the financial impact of a specification error?
Distributors can implement several protective measures: require documented application audits before recommending any meter for a regulated or high-value application; issue written specification confirmation emails that document application parameters, assumptions, and the basis for your recommendation; recommend commissioning validation at actual process conditions as a standard service; establish a 90-day follow-up protocol to verify performance before any warranty period expires; and include explicit scope limitations in your recommendation documents (“this recommendation assumes gas composition remains within the stated range”). For high-value applications, performance guarantee language—”this meter will achieve the specified accuracy at the stated operating conditions or we will provide a replacement at no charge”—demonstrates technical confidence and protects both parties.
15. What’s the first step I should take if I suspect a specification error in an existing installation?
Do not wait for the customer to contact you. If you suspect a specification error, act proactively: contact the customer and request a 20-minute technical call to review the installation parameters. Ask them to pull the meter’s current readings at actual operating conditions and compare them against any available independent measurements (lab analysis, mass balance, alternative measurement points). Arrange for a portable reference measurement at actual process flow conditions if the initial review raises concerns. Document everything—the suspected issue, the evidence, the steps you’re taking, and the customer’s response. Early identification and transparent communication about a potential specification problem, even before it has become expensive, builds the kind of trust that survives adversity. Silence after identifying a potential problem—hoping it won’t manifest—is the single most damaging professional choice a distributor can make.