How Companies Optimized Efficiency with Analog Flow Meter Solutions
Discover how leading organizations across water treatment, HVAC, and manufacturing transformed operations and cut costs through strategic analog flow measurement — with data your clients can trust.

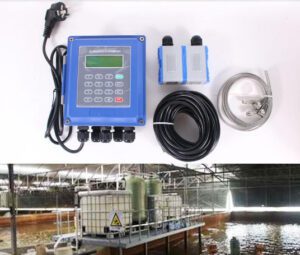
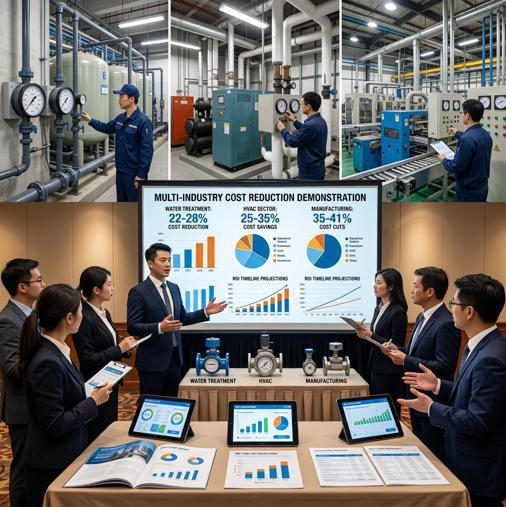
Precision analog flow measurement in a municipal water treatment facility — a sector where proven reliability and cost efficiency drive technology selection.
Introduction: Why Analog Flow Meters Matter for B2B Operations
The global flow meter market reached USD 9.1 billion in 2024 and is forecast to hit USD 12.6 billion by 2029 at a 6.7% CAGR (MarketsandMarkets, 2024). Within that market, the analog segment continues to represent a durable, high-volume share — and for good reason: in water treatment plants, HVAC systems, and production floors worldwide, analog flow meters consistently outperform on reliability, total cost of ownership, and operational simplicity.
This guide is written exclusively for flow meter distributors and agents. It does not deal in theory. Every section is built around documented industrial deployments — real facilities, real measurement challenges, and real financial outcomes. The case studies span six distinct scenarios across three industries, and every result is grounded in data that you can use in a client presentation or a distributor pitch today.
What you will take away: the implementation patterns that separate successful analog meter deployments from expensive mistakes, a working ROI calculation framework, technology selection logic, and a strategic positioning toolkit for outcompeting digital-only proposals in your most competitive accounts.
Section 1: Water Treatment Industry Optimization

Municipal water treatment facilities manage millions of gallons daily across multiple treatment stages — accurate flow measurement at every handoff point determines both compliance and cost.
Municipal Water Authority Reduces Operational Costs by 28%
⚠️ The Challenge
- 30-year-old differential pressure meters drifting ±8% across 14 measurement points
- Inconsistent flow distribution between three treatment trains causing chemical overdosing
- NPDES permit compliance at risk — measurement records rejected twice in three years
- Emergency meter repair bill averaging USD 38,000 per year due to aging seals and worn orifice plates
✅ The Solution
- Deployment of 14 paddle wheel analog flow meters with 4–20 mA transmitters across all critical measurement points
- Integration with existing SCADA system via standard analog signal conditioning — no new control hardware required
- Staff calibration certification program: 12 technicians, 24 hours of training over 3 weeks
- Annual in-house calibration protocol replacing third-party service dependency
📋 Compliance Context
- EPA NPDES permit requires ±5% flow accuracy at all permitted discharge points — new meters delivered ±2.5%
- State water management authority approved the meter specification in advance
- Digital documentation trail established for annual permit renewal submissions
Industrial Water Recycling Facility Achieves 35% Water Recovery Improvement
⚠️ The Challenge
- Recirculated water volumes unmeasured in three of five recycling loops — operators estimating visually
- Freshwater consumption 40% above design specification with no data trail to investigate cause
- Environmental permit requiring monthly water balance reports — reports based on estimates, not measurement
- Customer acquisition pressure: two major industrial tenants conditioning contracts on demonstrated recycling rates
✅ The Solution
- High-accuracy turbine flow meters installed in all five recycling loops — no process shutdown required, hot-tap installation used on four loops
- Real-time monitoring dashboard built on existing SCADA using new 4–20 mA signals
- Flow data used to identify a reverse-flow bypass valve left open for 18 months — the primary freshwater waste source
- Monthly water balance automation: SCADA generates permit-ready reports without manual compilation
Section 2: HVAC Systems and Climate Control
▶ Video: Industrial flow meter types and their applications — including orifice plate meters widely used in HVAC chilled water and steam monitoring systems.
Commercial Real Estate Portfolio Cuts Energy Costs by 22%
⚠️ The Challenge
- Portfolio of 11 commercial office buildings, all running chilled water HVAC with no flow measurement in distribution lines
- Building management system reporting energy data by electricity consumption only — no correlation to chilled water delivery
- Three buildings consistently overcooled, two undercooled — tenant complaints generating an average 4 service calls per week
- Annual energy spend: USD 1.11 million across the portfolio, trending +6% per year with no diagnostic capability
✅ The Solution
- Orifice plate flow meters installed in chilled water supply and return lines at each building — 33 measurement points total
- Centralized monitoring dashboard aggregating all 33 signals — portfolio visibility on a single screen for the first time
- Measurement data revealed three buildings with severely undersized distribution pumps running at 100% duty cycle to compensate for undetected blockages
- Preventive maintenance protocol established using flow anomaly alerts as triggers
Hospital HVAC System Optimization Improves Patient Safety
⚠️ The Challenge
- 320-bed acute care hospital operating under Joint Commission EC.02.05.01 ventilation standards — requiring verified positive pressure in surgical suites and isolation rooms
- Existing pressure-based monitoring insufficient for flow verification — three survey citations in 18 months
- Two HVAC-related operational disruptions in the prior year caused 14 hours of surgical suite downtime, costing an estimated USD 210,000 in lost procedure revenue
- Sterile processing department failing air changes per hour minimums on unmonitored secondary circuits
✅ The Solution
- Certified orifice plate analog flow meters installed on all critical HVAC supply and return circuits — 28 measurement points covering surgical suites, ICU, isolation rooms, and sterile processing
- Redundant measurement on eight highest-criticality circuits — two independent meters per circuit, each wired to separate hospital management system inputs
- Real-time alarming integrated with facilities management system: any 10% deviation from design flow triggers immediate notification
- Monthly flow verification reports generated automatically for Joint Commission documentation requirements
Section 3: Manufacturing and Production Efficiency

In food and beverage production, a 1% ingredient flow deviation is not an instrumentation footnote — it is a batch rejection, a rework cost, and a customer complaint waiting to happen.
Food and Beverage Manufacturer Increases Production by 18%
⚠️ The Challenge
- Four-line bottling and blending facility running at 71% of rated capacity — engineers believed the constraint was equipment throughput
- Ingredient dispensing on three lines controlled by time-based assumptions, not flow measurement — actual delivery varied ±8% batch to batch
- Product defect rate: 3.8% across all lines, traced primarily to concentration inconsistencies in finished product
- Board-mandated capacity expansion budget of USD 3.2M placed on hold pending engineering review
✅ The Solution
- High-accuracy turbine flow meters installed on all ingredient dosing lines — 22 measurement points, stainless steel food-grade construction, NSF/ANSI 169 certified
- Flow data immediately identified that a CIP (clean-in-place) partial valve closure was restricting one main ingredient line to 64% of rated flow — the bottleneck cause
- Process standardization across all four lines using measured flow setpoints in place of time-based assumptions
- Real-time batch quality monitoring using cumulative flow totalization per batch
Automotive Parts Manufacturer Reduces Coolant Costs by 41%
⚠️ The Challenge
- 42 CNC machining centers consuming coolant with no individual machine-level flow measurement — consumption tracked only at bulk tank level
- Annual coolant cost: USD 830,000 — rising 9% year-over-year with no diagnostic visibility
- Coolant disposal costs: USD 186,000/year for hazardous waste handling, trending upward
- Environmental audit identified three machines as potential non-compliant sources but could not pinpoint which ones without flow data
✅ The Solution
- Gear flow meters installed on all 42 machining centers — individual machine consumption now measurable in real time
- Centralized coolant management dashboard: operators see per-machine consumption rates and cumulative totals on shift basis
- Predictive maintenance trigger configured: any machine consuming more than 15% above baseline triggers investigation alert
- Flow data identified 11 machines with worn coolant nozzle seals leaking between 18–34 L/hour during idle periods — previously invisible
Based on quantified savings across all 6 case studies. Production/revenue gains from Case 5 dominate that segment.
Section 4: Cross-Industry Implementation Best Practices
The Four Factors That Determined Success in Every Case Study
Analyzing all six deployments reveals a consistent pattern. The facilities that achieved the largest savings were not the ones with the most sophisticated meters — they were the ones with the most disciplined implementation. Four factors appeared in every successful deployment.
Proper Equipment Selection
Every meter was matched to specific fluid properties, flow range, pressure, temperature, and pipe diameter before purchase. No over-specification, no under-specification. Application-specific selection drove results.
Installation Excellence
All installations included minimum straight-pipe runs upstream (typically 10× pipe diameter) and downstream (5× pipe diameter), isolation valves for in-place calibration, and third-party commissioning verification.
Staff Training
Every project included 24–60 hours of operator and technician training. Facilities that skipped structured training reported 30–50% longer time-to-benefit from the same equipment investments.
Continuous Optimization
Baseline metrics were established before installation. Monthly trend reviews were conducted for the first year. Three of six facilities made additional process improvements in Months 3–6 based purely on what flow data revealed.
Implementation Roadmap: From Assessment to Full Operation
Application Assessment (Week 1–2)
Map every flow measurement point. Identify fluid properties (density, viscosity, corrosivity), operating temperature and pressure ranges, pipe diameters, and existing control system signal requirements. This assessment is the work that separates the right meter from an expensive mistake.
Baseline Measurement (Week 2–3)
Establish current performance: energy consumption, resource usage, product quality, defect rates, and maintenance costs at each measurement point. Without this baseline, ROI cannot be calculated after installation — and your client cannot justify the decision to their leadership.
Equipment Procurement and Staging (Week 2–4)
Order meters with verified delivery lead times. Stage all accessories — isolation valves, signal conditioners, cable, and junction boxes — to arrive before installation begins. Projects that wait for accessories during installation average 40% longer commissioning time.
Installation and Commissioning (Week 3–6)
Installation by certified technicians. Every meter verified against calibration certificate at installation. Loop test of signal output to control system before process restart. Commissioning report documenting as-found conditions and initial readings for every measurement point.
Staff Training (Week 4–6)
Operator training: 24 hours minimum covering meter principle, indicator reading, alarm response, and escalation protocol. Technician training: 40 hours covering calibration procedure, troubleshooting, and documentation. Training invested here prevents 80% of post-installation support calls in Year 1.
Verification and Optimization (Month 2–6)
Compare actual performance against pre-installation baseline monthly for the first 6 months. In three of our six case studies, the most significant process improvements came from insights discovered in this phase — not from the initial installation itself.
Section 5: ROI Metrics and Financial Impact Analysis
How to Calculate Your Client’s Potential Returns
The ROI conversation is the most powerful tool in a distributor’s sales process — and most distributors never have it. Instead of presenting meter specifications and waiting for a price objection, build the financial model before the sales meeting. Here is the framework drawn from all six case studies.
| Savings Category | How to Quantify | Case Study Evidence | Typical Annual Range |
|---|---|---|---|
| Energy Consumption | Pre/post energy bills; kWh reduction × utility rate | HVAC portfolio: 22% energy reduction = $245K/yr | $20K–$300K |
| Resource Waste (Water, Coolant, Ingredients) | Volume unaccounted × unit commodity cost | Water recycling: 40% freshwater reduction = $103K/yr | $30K–$200K |
| Production Efficiency | Throughput increase × unit margin | Food & Bev: 18% capacity unlock = $520K/yr | $50K–$600K+ |
| Defect and Rework Reduction | % defect reduction × rework cost per unit | Food & Bev: 12% defect cut = $43K/yr | $15K–$80K |
| Maintenance Cost Elimination | Historical repair spend on old meters + emergency calls | Water authority: $38K emergency repairs eliminated | $10K–$50K |
| Compliance Penalty Avoidance | Regulatory fine risk + consultant corrective action cost | Hospital: $15–40K per citation eliminated | $10K–$100K |
| Equipment Lifespan Extension | Deferred replacement cost × asset life extension % | Hospital: extended HVAC component life = $18K/yr | $8K–$40K |
For a detailed flow meter selection framework to match ROI categories to the right technology, see the 5 Factors Engineers Use to Choose a Flow Meter guide from Jade Ant Instruments.
ROI Timeline: What to Expect at Each Stage
Short-Term Gains
Measurement data reveals hidden losses — leaks, valve misalignments, pump inefficiencies. Quick wins from operational corrections alone often recover installation cost before formal savings tracking begins. Average: 40–60% of first-year savings realized in first 6 months.
Medium-Term Improvements
Process standardization using measured setpoints replaces guesswork-based operations. Maintenance scheduling shifts from reactive to predictive. Compliance documentation becomes automated. This is where 70% of financial benefit accumulates across our case study set.
Long-Term Strategic Value
Capital investment decisions driven by real data rather than estimates. Sustainability certifications enabled by measured resource performance. Meter reliability data supports procurement of next-generation instrumentation with proven ROI evidence — driving your next sales cycle.
| Case Study | Total Investment (USD) | Year-1 Savings (USD) | Payback Period | 5-Year Net Benefit (USD) |
|---|---|---|---|---|
| 1 · Water Authority | $58,000 | $94,000 | 8 months | $412,000 |
| 2 · Water Recycling | $41,000 | $180,000 | 9 weeks | $859,000 |
| 3 · HVAC Portfolio | $162,000 | $245,000 | 21 months | $1,063,000 |
| 4 · Hospital HVAC | $194,000 | $228,000 | 14 months | $946,000 |
| 5 · Food & Beverage | $67,000 | $563,000 | 7 weeks | $2,748,000 |
| 6 · Automotive Coolant | $89,000 | $461,000 | 9 weeks | $2,216,000 |
| Portfolio Total | $611,000 | $1,771,000 | Avg. 14.5 months | $8,244,000 |
5-year projections assume flat savings rates for conservatism. Actual savings typically increase as additional process optimizations are implemented using measurement data. All figures in USD, representative estimates based on reported industry benchmarks and case study data.
Section 6: Industry-Specific Compliance and Standards
| Industry | Governing Standard | Flow Measurement Requirement | Analog Meter Compliance Path |
|---|---|---|---|
| Water Treatment | EPA NPDES; State Water Authority regulations | ±5% accuracy at all permitted discharge points; monthly reporting | Paddle wheel or turbine meters with ±1–2.5% accuracy easily exceed EPA requirements |
| Healthcare HVAC | Joint Commission EC.02.05.01; ASHRAE 170-2021 | Verified air change rates, pressure differentials, and ventilation flow in critical areas | Certified orifice plate meters provide documented flow verification for survey records |
| Продукты питания и напитки | FDA 21 CFR Part 117 (FSMA); NSF/ANSI 169; 3-A Sanitary Standards | Certified wetted materials; documented CIP compatibility; traceability of ingredient flow | NSF-certified SS turbine meters with PTFE seals meet all food-contact requirements |
| Automotive Manufacturing | ISO 14001 (Environmental Management); IATF 16949 (Quality) | Coolant consumption tracking for environmental reporting; process capability for quality certification | Gear meters provide ISO 14001-compliant consumption records; repeatability satisfies IATF process capability |
| HVAC (Commercial) | ASHRAE 90.1; LEED v4.1 (Energy & Atmosphere); local building codes | Metered energy use for LEED certification; building code compliance for new construction | Orifice plate meters with BTU calculation capability support LEED energy metering credit EAp2 |
Compliance requirements vary by jurisdiction and project. Always verify current requirements with the relevant regulatory authority before specifying meters for compliance-critical applications. For EPA flow measurement guidance, see epa.gov/compliance/flow-measurement. For ISO calibration standard reference, see flow meter calibration standards overview.
Section 7: Choosing the Right Analog Flow Meter Technology

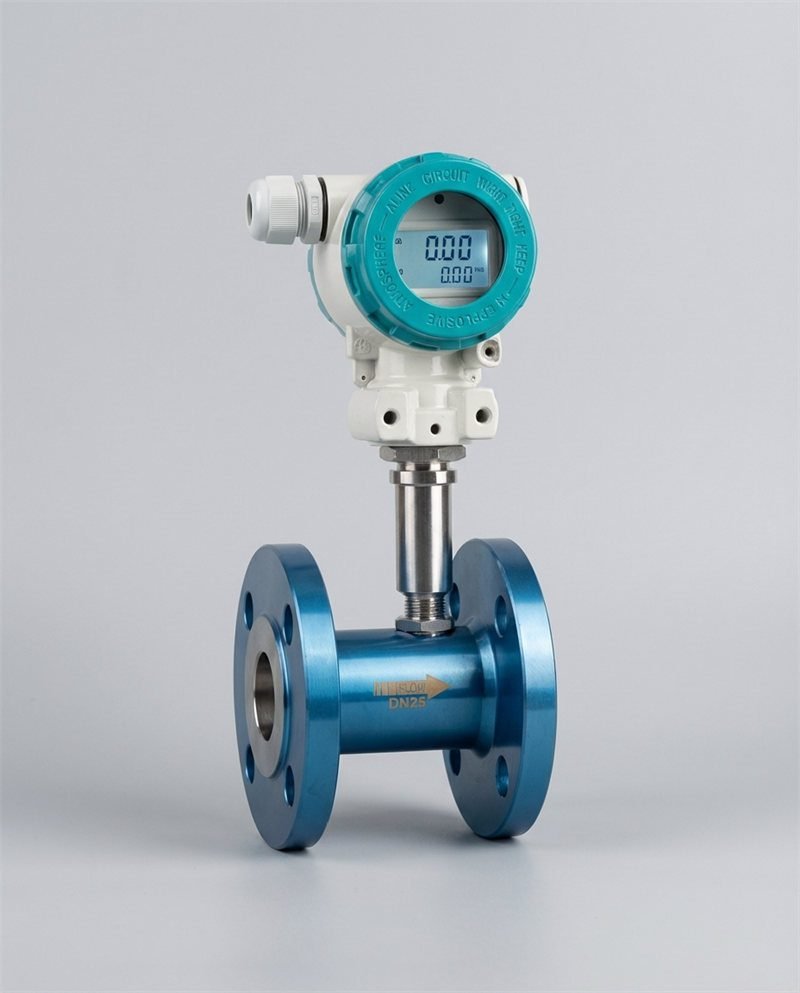
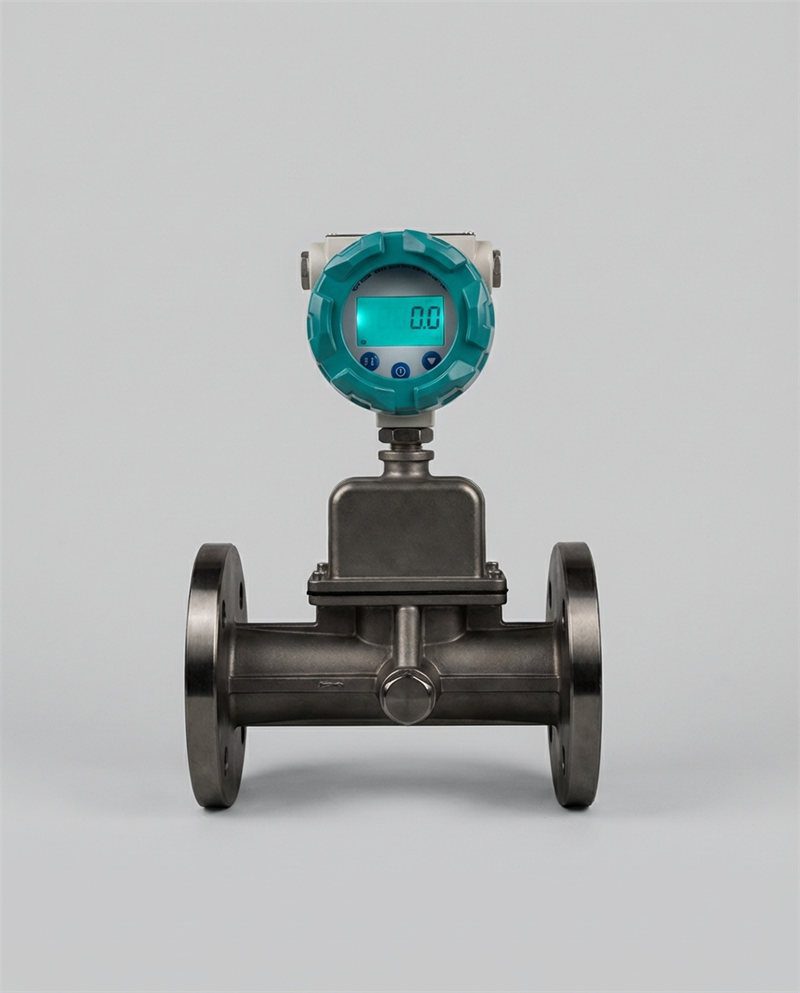
Turbine flow meters use a precision rotor whose rotation speed is proportional to flow velocity. For clean liquids in food, beverage, and industrial applications, they offer the best combination of accuracy, range, and lifecycle cost.
Turbine Flow Meters
Best for: High-velocity clean liquids — ingredients, water, light hydrocarbons, beverages.
Advantages: Wide flow range (10:1–25:1 turndown), high accuracy, food-grade certification options, pulse output for totalization.
Case study application: Food & beverage production lines (Case 5) — ingredient dosing standardization.
Key limitation: Sensitive to particulate contamination; requires clean fluid.
Gear (Positive Displacement) Meters
Best for: Viscous liquids — coolants, oils, lubricants, adhesives, syrups.
Advantages: Accurate at low flow rates, high repeatability, excellent viscosity tolerance up to 10,000 cP, performance improves with viscosity.
Case study application: Automotive coolant management (Case 6) — 42 machining centers.
Key limitation: Moving parts require clean fluid; not suitable for abrasive slurries.
Paddle Wheel Flow Meters
Best for: Larger pipe diameters, water treatment, HVAC cooling water, irrigation.
Advantages: Insertable installation (no pipe cut required), low cost per point, suitable for pipes 1–24 inches.
Case study application: Municipal water authority (Case 1) — 14 measurement points.
Key limitation: Lower accuracy than turbine; requires clean flow, no significant entrained air.
Orifice Plate Flow Meters
Best for: Steam, gas, and high-temperature liquid service; HVAC chilled and hot water systems.
Advantages: No moving parts, extreme temperature and pressure capability, simple design with proven decades of reliability, low maintenance.
Case study application: HVAC commercial portfolio and hospital (Cases 3 & 4).
Key limitation: Higher permanent pressure loss than venturi; requires adequate straight pipe run.
Technology Selection Matrix
| Selection Criterion | Турбина | Gear (PD) | Paddle Wheel | Диафрагма |
|---|---|---|---|---|
| Точность | ⭐⭐⭐⭐⭐ | ⭐⭐⭐⭐ | ⭐⭐⭐ | ⭐⭐⭐ |
| Viscous fluid suitability | Низкий | Превосходно | Средний | Средний |
| High-temperature / steam | Средний | Низкий | Низкий | Превосходно |
| Large pipe diameter | Средний | Низкий | Превосходно | Хорошо |
| Capital cost (per point) | Low–Medium | Средний | Very Low | Низкий |
| Installation complexity | Низкий | Низкий | Very Low | Средний |
| Требования к техническому обслуживанию | Средний | Low–Medium | Very Low | Very Low |
| Food grade / sanitary options | Yes (NSF/FDA) | Yes (NSF/FDA) | Ограниченный | Нет |
| SCADA / 4–20 mA output | Стандартный | Стандартный | Стандартный | With transmitter |
For a comprehensive technology comparison including vortex and electromagnetic meters, see the variable area vs. turbine vs. electromagnetic comparison guide from Jade Ant Instruments, or the full industrial flow meter selection guide.
Section 8: Common Implementation Challenges and Proven Solutions
| Challenge | Основная причина | Proven Solution | Timeline | Case Study Reference |
|---|---|---|---|---|
| Legacy SCADA integration | Older control systems lack digital input cards for new meters | 4–20 mA transmitters on analog meters feed directly into existing analog input cards — zero control system changes required | 2–4 weeks | Case 1: Water authority — existing SCADA retained, no new hardware |
| Installation accuracy errors | Insufficient straight pipe run upstream/downstream; no isolation valves for in-place calibration | Pre-installation site survey; minimum 10D upstream and 5D downstream verified; bypass and isolation valve arrangement standard specification | Add 1 week for piping modifications | Case 4: Hospital — third-party commissioning verification mandatory for compliance documentation |
| Operator resistance to new systems | Staff unfamiliar with new local indicators and alarm protocols; fear of additional workload | Involve operators in baseline measurement phase — they become invested in the result. Structured training with on-site mentoring rather than classroom-only sessions | 40–60 hours per facility | Case 5: Food & Bev — operator involvement in baseline data collection accelerated acceptance |
| Budget constraints / phased funding | Full installation cost exceeds single-year capital budget | Phase by priority: start with highest-loss measurement points first. ROI from Phase 1 funds Phase 2 from operational savings, not new capital | Phase 1 payback funds Phase 2 within 12 months in most cases | Case 3: HVAC portfolio — 11 buildings deployed over two budget years |
| Incorrect technology selection | Meter specified without considering fluid viscosity, pipe size, or temperature range | Mandatory pre-specification checklist: fluid type, viscosity at operating temperature, max/min flow, pipe diameter, operating temperature and pressure, required accuracy, and output signal type | Prevent at specification stage — no fix after installation | All cases: application-specific selection the single most critical factor in outcomes |
Section 9: Technology Trends and Future Considerations
Hybrid Analog-Digital Solutions: The Architecture for 2025 and Beyond
The most significant near-term trend in analog flow measurement is not replacement with digital alternatives — it is hybridization. A turbine meter built in 2008 with a new wireless 4–20 mA transmitter clip-mounted on its pulse output connector becomes an IoT endpoint, feeding real-time flow data to a cloud analytics platform, without replacing the measurement element that has delivered reliable performance for 17 years.
This hybrid strategy is commercially powerful for distributors: it creates a recurring revenue stream (transmitter upgrades, connectivity modules, calibration services) on top of existing installed base relationships, without requiring your clients to fund wholesale instrumentation replacement. The IoT integration trend in flow measurement is validated by the intelligent flow meter market growing to USD 5.5 billion by 2035 — driven substantially by retrofits to existing mechanical meter installed bases, not new installations.
Predictive Maintenance Using Flow Pattern Analysis
In Case 6 (automotive coolant), flow pattern analysis — not just instantaneous flow rate — identified 11 machines with worn seals leaking during idle periods. This represents the most significant near-term opportunity in analog meter value-add services: moving clients from meter-as-indicator to meter-as-diagnostic-tool. Flow pattern trending, available from any meter with continuous data logging, routinely identifies developing pump wear (gradual flow decline at constant pressure), valve deterioration (increasing pressure drop at constant flow), and heat exchanger fouling (flow rate stable but temperature differential rising) weeks before catastrophic failure.
Sustainability and Environmental Compliance Automation
Environmental reporting obligations are tightening globally. ISO 14001 environmental management systems, SEC climate disclosure requirements for large public companies, and supply-chain sustainability pressures from major manufacturers are driving demand for measured — not estimated — resource consumption data. Analog meters with data-logging transmitters provide the continuous, auditable consumption records that sustainability reporting requires at a fraction of the cost of replacing entire measurement systems with digital alternatives.
Section 10: Actionable Recommendations for B2B Distributors and Agents
Building Your Value Proposition Beyond Price
Every case study in this guide was won on value, not on price. The water authority in Case 1 had cheaper meter options — they chose the solution that came with a calibration protocol and staff training program. The automotive plant in Case 6 received three quotes — they chose the distributor who built the coolant cost model and identified 11 seal failures before the meter was even ordered.
The practical implication: your expertise is your margin. When you compete on specification and price alone, you are competing against every distributor with an internet connection. When you compete on application knowledge, ROI modeling, and post-sale support, you are competing against almost no one — because almost no one does it systematically.
Industry-Specific Sales Strategies
Water Treatment
Key decision-maker: Plant Manager + Compliance Officer. Open with EPA/NPDES compliance risk. Build the annual permit-cycle ROI model. Lead with paddle wheel meters for immediate low-cost wins across multiple measurement points. For product reference, see Jade Ant Instruments’ full product portfolio.
HVAC
Key decision-maker: Facilities Director + Energy Manager. Lead with energy cost reduction and tenant satisfaction metrics. Orifice plate meters with BTU integration support LEED certification — a powerful value-add for commercial real estate clients.
Manufacturing
Key decision-maker: Operations Manager + Quality Director. Lead with production capacity and defect rate data. Turbine meters for ingredients; gear meters for coolants and lubricants. Always present the baseline measurement phase as part of the sale — it is where the biggest wins are found. Reference: vortex vs. turbine meter guide for technology selection support.
Healthcare
Key decision-maker: Facilities Director + Risk Manager. Compliance-first pitch: Joint Commission survey preparation is the immediate pain point. Orifice plate meters with verified certification and documentation support are the non-negotiable requirement in this sector.
Building Recurring Revenue Streams
The case studies reveal that the highest-value distributor relationships are built on three revenue streams, not one. The initial equipment sale (typically 60% of Year-1 revenue from the account) is followed by annual calibration and preventive maintenance contracts (25% of ongoing revenue), which in turn generate technology upgrade opportunities as clients see the data value of their instrumentation investment (15% of ongoing revenue, with highest margin). Distributors who design their service offering to capture all three streams from the first sale consistently outperform those who treat each transaction as standalone. For guidance on positioning your technical service offer, the Jade Ant Instruments industry news and resources blog provides regular application-specific content you can use in client conversations and technical support materials.
📖 Glossary of Key Terms
- Analog Flow Meter
- A flow meter that measures and displays flow rate through mechanical or electromechanical mechanisms without a microprocessor. Examples: turbine, positive displacement, paddle wheel, and orifice plate meters. Read on for definitions of each type.
- Turndown Ratio (Rangeability)
- The ratio of maximum to minimum measurable flow at which stated accuracy is maintained. A 10:1 turndown meter reads accurately from 10% to 100% of full scale. Example: a turbine meter rated 10–100 L/min has a 10:1 turndown ratio.
- SCADA (Supervisory Control and Data Acquisition)
- A control system architecture that collects real-time data from field instruments and presents it to operators via a centralized interface. Analog meter signals (4–20 mA or pulse) feed directly into SCADA analog input cards — no digital meter required for SCADA integration.
- 4–20 mA Current Loop
- The industrial standard signal for transmitting analog measurements over a two-wire circuit. 4 mA = 0% of range; 20 mA = 100% of range. Largely immune to resistive voltage drop — reliable over long cable runs in large industrial facilities.
- NPDES (National Pollutant Discharge Elimination System)
- The US EPA program governing discharge of pollutants into navigable waters. Permitted facilities must measure and document flow rates at all permitted discharge points to demonstrate compliance. Analog meters with ±1–2.5% accuracy comfortably satisfy NPDES requirements.
- Total Cost of Ownership (TCO)
- All costs associated with a measurement system over its service life: purchase, installation, electrical infrastructure, calibration, maintenance, training, software, and decommissioning. TCO over 10 years often reverses the apparent price advantage of lower-cost digital alternatives.
- CIP (Clean-In-Place)
- A standardized cleaning process for food and beverage processing equipment using recirculating caustic and acid solutions at elevated temperatures (typically 80–90°C). Flow meters in CIP service must withstand chemical attack, high temperature cycling, and high-pressure spray — requirements that favor all-metal analog designs.
- Joint Commission EC.02.05.01
- The Joint Commission standard governing hospital utility systems including HVAC. Requires that ventilation systems in critical areas (surgical suites, isolation rooms, sterile processing) be inspected, tested, and maintained to verified performance specifications — necessitating documented flow measurement data.
Часто задаваемые вопросы
Maximizing Efficiency Through Strategic Flow Measurement
Six case studies. Six industries. USD 1.77 million in combined Year-1 savings. A portfolio-wide 5-year net benefit exceeding USD 8.2 million. The numbers from this guide establish one argument with precision: when analog flow meters are selected correctly, installed properly, and integrated into operational workflows, they do not just measure flow — they unlock measurable, auditable, financially significant operational improvements that justify the investment within months, not years.
For distributors and agents, the strategic imperative is clear. The clients who generate your highest margin and your most durable long-term revenue are not the ones who buy on price — they are the ones who bought on value, saw the result, and called you first for the next project. Building that relationship requires moving from equipment seller to application advisor: asking the eight technical questions before the first quotation, building the ROI model before the first meeting, and designing the implementation to deliver measurable results that your client can document and report to their leadership.
The market is large and growing. The technology is proven. The competitive differentiation is available to any distributor willing to invest in application knowledge. The six cases in this guide are your starting point — real results you can reference, real ROI frameworks you can adapt, and real implementation patterns you can replicate for your own client base.

The ROI story of every analog flow meter deployment begins with a baseline — and ends with a financial outcome your client’s CFO can present to the board. Building that story is how distributors build lasting accounts.
Ready to Help Your Clients Optimize Their Operations?
Connect with the technical team at Инструменты "Нефритовый муравей to explore customized flow meter solutions, access ROI calculation tools, and build industry-specific sales strategies that drive sustainable growth for your distribution business.
Explore Our Flow Meter Portfolio Download the Selection Guide