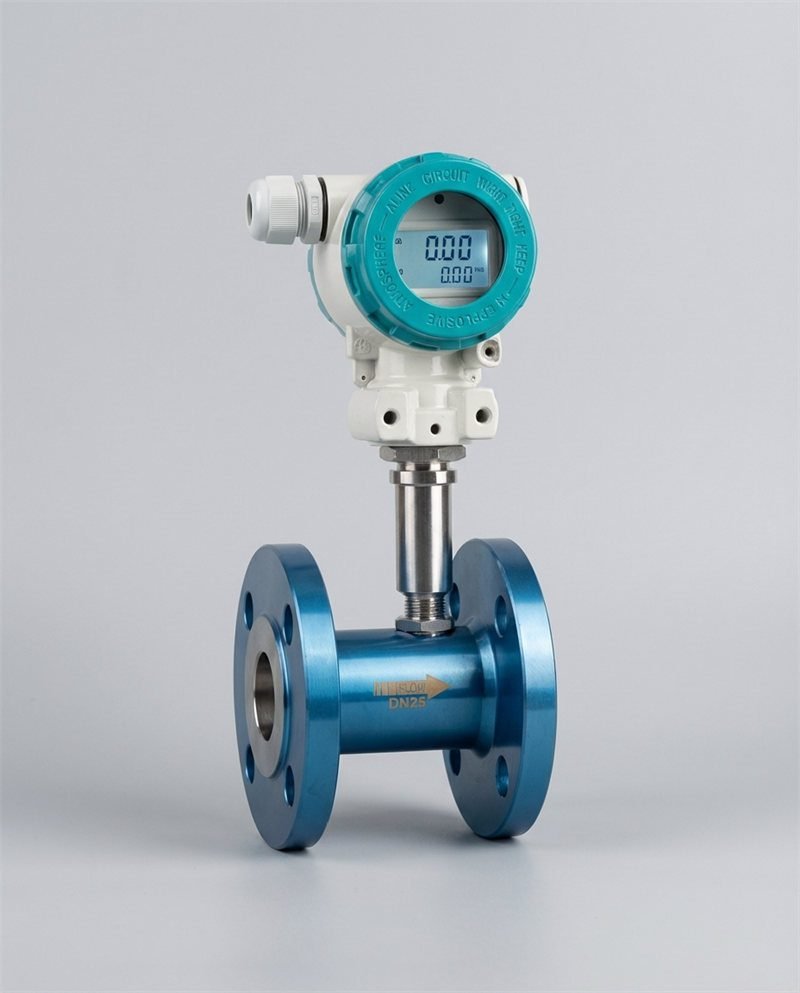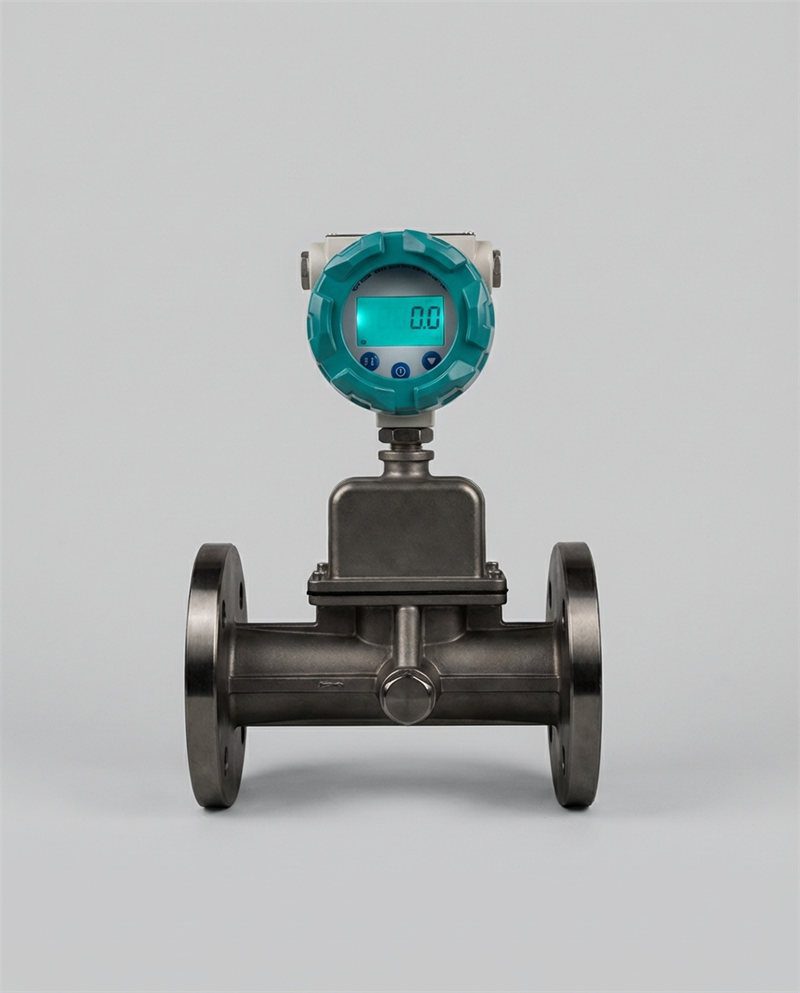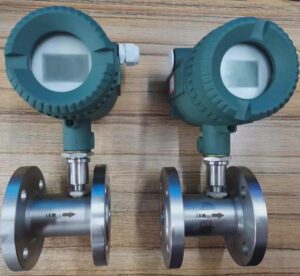
Flow instrumentation distributors face unprecedented pressure to balance legacy inventory systems with modern customer expectations. This comprehensive guide reveals how leading distributors are solving critical supply chain problems — from excess stock and logistics bottlenecks to customer proximity issues — using proven optimization strategies and digital-first engagement tactics.

The flow meter market crossed $11 billion in 2025 and continues growing. For distributors and agents operating in this space, that growth is real — but so is the compression. More manufacturers are entering the market, procurement teams are more informed than ever, and the industrial buyer who would tolerate a 5-day lead time in 2018 now has a shortlist of three alternatives they can activate in 48 hours.
The distributors who are winning aren’t winning on product selection. Every major distributor has access to electromagnetic meters, vortex meters, ultrasonic units, and Coriolis instruments. The advantage is operational: who can put the right product at the right place at the right time, with the right documentation, at the right price — consistently.
This guide was written specifically for B2B flow instrumentation distributors and agents. Not for end users. Not for manufacturers. For the people managing multi-location inventory, coordinating logistics, and serving plant engineers and procurement managers who expect more from their supply chain partners than a catalog and a quote.
Work through it systematically. Each section addresses a specific operational challenge, with concrete frameworks you can implement within 30–90 days.
The Real Cost of Traditional Distribution Challenges in Flow Instrumentation
Why Your Current Inventory Strategy Is Costing You Money
The Hidden Expenses of Overstocking Specialized Flow Instruments
Specialty flow instruments — high-temperature vortex meters, ATEX-certified (ATEX: the European directive defining equipment safe for use in potentially explosive atmospheres) electromagnetic units, large-bore Coriolis meters — don’t move the same way standard items do. But many distributors stock them as though they do, driven by the fear of a stock-out on a critical customer order.
The math on that fear is almost always wrong. Carrying costs for held inventory typically run 20–30% of the unit’s value annually — covering capital cost, storage, insurance, and obsolescence risk. A specialty vortex meter worth $4,200 sitting on a shelf for 14 months has consumed $980–$1,470 in carrying cost before it ships. Multiply that across 40 slow-moving SKUs and the annual drain reaches $40,000–$60,000 in pure carrying expense — without a single product defect or delivery failure.
Across the distributor base, Plante Moran’s 2025 inventory optimization research confirms that manufacturers and distributors consistently underestimate this exposure, often because inventory carrying cost isn’t captured as a line item that anyone owns — it exists in the gap between the balance sheet and the P&L.
How Slow-Moving SKUs Tie Up Working Capital and Reduce Profitability
Dead stock isn’t just a warehouse problem. It’s a cash flow problem. Every dollar sitting in a slow-moving ultrasonic clamp-on unit that turns once every 22 months is a dollar not available for purchasing fast-moving electromagnetic meters, funding a new technical hire, or building the safety stock on A-category items that actually protect your service level commitments.
The industry benchmark for healthy inventory management in flow instrumentation: your weighted average inventory turnover should sit between 4 and 8 times per year. If you’re below 4, you almost certainly have working capital tied up in inventory that isn’t earning its keep.
Logistics Bottlenecks That Delay Customer Deliveries
The Impact of Fragmented Warehouse Networks on Order Fulfillment
Many distributors who grew organically through regional expansion now operate warehouse networks that were never designed as networks — they evolved as individual locations. The result: a branch in the north has six units of a specific DN80 electromagnetic meter, the eastern branch has two, and neither branch can see the other’s inventory in real time. A customer order that could be fulfilled from existing stock takes five days because no one has visibility to make the connection.
Fragmented warehouse visibility is one of the most common and most correctable logistics bottlenecks in industrial distribution. When Cin7’s working capital analysis tracked distributor inventory efficiency, the pattern was consistent: companies without real-time multi-location visibility carried 25–35% more safety stock than companies with integrated inventory systems — compensating for uncertainty with excess inventory rather than resolving the visibility problem directly.
Why Regional Distribution Centers Alone No Longer Meet Customer Expectations
A regional distribution center that serves a 500-kilometer radius made commercial sense when next-day delivery expectations were an exception rather than the rule. Today, industrial buyers who receive Amazon-style delivery timelines for personal purchases are recalibrating their expectations for professional procurement.
This doesn’t mean your customers expect same-day delivery on custom-configured Coriolis meters. It means they expect transparency: accurate lead times communicated upfront, real-time order status they can access without calling you, and proactive notification when something changes. A three-day lead time with perfect visibility and a two-hour notification when the shipment leaves your dock is a better customer experience than a two-day lead time with no tracking and a two-hour scramble when the delivery misses.
Customer Proximity Problems in a Fragmented Market
How Distance from Key Accounts Affects Your Competitive Position
Physical proximity to key accounts matters for reasons that go beyond delivery logistics. Distributors who are geographically close to major accounts — within driving distance for a same-day site visit — win technical support conversations that remote distributors lose. A plant engineer dealing with an unexplained reading on a vortex meter at 2 PM doesn’t want a phone consultation scheduled for next Tuesday. They want someone who can be at the meter within the hour.
That same-day technical response capability isn’t always about having a warehouse nearby. It’s about having a field resource — a technical sales engineer, a calibration technician, an applications specialist — within reach. For distributors serving geographically dispersed industrial territories, this is the hardest competitive gap to close. But it’s also the most durable competitive advantage once established.
The Relationship Between Delivery Speed and Customer Retention Rates
The retention data on delivery performance is consistent across industrial distribution research: customers who receive 95%+ on-time delivery from a distributor show retention rates 20–35 percentage points higher than customers who receive 80–85% on-time delivery from the same distributor. The drop-off isn’t linear — it’s a threshold effect. Once a customer has had two or three late deliveries in a 12-month period, the trust framework shifts and they begin actively qualifying alternatives.
That threshold makes on-time delivery a binary competency in industrial distribution: either you’re reliably above 95% and it’s a non-issue, or you’re below it and it’s actively costing you accounts.
Understanding Your Distributor Pain Points: A Candid Assessment

Inventory Management Nightmares Specific to Flow Instrumentation
Managing Diverse Product Lines with Varying Demand Patterns
Flow instrumentation product portfolios are uniquely complex from an inventory management perspective. A single electromagnetic flow meter model may ship in 15 different pipe sizes, three liner materials, four electrode options, and six output configurations — creating a potential matrix of 1,080 distinct SKUs from one product family. Most distributors stock a subset of these; the challenge is knowing which subset.
The demand patterns across this matrix are not uniform. DN50 stainless steel electromagnetic meters with 4-20mA output move in a pattern that’s somewhat predictable from historical data. DN200 PTFE-lined meters with HART output for chemical service move in patterns dominated by project-based demand — one large order, then silence for six months.
Managing both patterns with the same inventory strategy is the operational error that most commonly produces simultaneous stockouts on fast movers and excess inventory on specialty items.
Balancing Technical Expertise with Inventory Forecasting Accuracy
Instrumentation distributors face a specific challenge that general industrial distributors don’t: the demand for a product is often driven by a technical specification, not a purchasing preference. A customer who wants a vortex meter for a steam line at 200°C and 16 bar has a specification that eliminates most of your vortex inventory — and the specific unit they need may be a specialty item you don’t stock.
This means your forecasting accuracy depends not just on historical sales data but on your technical team’s awareness of the project pipeline. A distributor whose application engineers know that three clients are in the engineering phase for chemical plant expansions can stock ahead of a specification-driven demand spike. A distributor operating purely from historical order data will be caught short every time.
The Logistics Reality: What’s Actually Holding You Back
Last-Mile Delivery Challenges in Industrial Markets
Last-mile delivery (the final leg of a shipment’s journey from a distribution hub to the customer’s facility) in industrial instrumentation is genuinely harder than in consumer logistics. Flow meters are not small packages — even compact magnetic meters weigh 8–15 kg with flanges, and large-bore units weigh considerably more. Installation dates are often fixed by maintenance windows or construction schedules, making a one-day delivery delay disproportionately costly for the customer.
Industrial customers frequently receive deliveries at facility addresses with restricted access, security check-in requirements, and specific receiving windows. A parcel carrier optimized for residential delivery will fail regularly in these environments. The resulting failed delivery attempts generate customer frustration that isn’t really about the product — but sticks to the distributor’s reputation regardless.
Distributors who partner with B2B last-mile specialists rather than routing industrial shipments through consumer carrier networks consistently report lower failed-delivery rates and significantly higher customer satisfaction scores on the delivery experience.
The Cost of Maintaining Multiple Distribution Points Without Visibility
Operating multiple distribution locations without unified inventory visibility creates a specific financial pathology: each location optimizes for its own service level, carrying safety stock independently, with no mechanism for inter-branch inventory transfer when imbalances emerge. The result is a system where the business as a whole is overstocked while individual locations still experience stock-outs.
The cost shows up in two ways. First, excess working capital tied up in duplicate safety stock across locations. Second, emergency orders and premium freight costs when a location stock-outs despite adequate total inventory existing somewhere in the network.
Customer Expectations Have Changed — Have You?
Why Technical Support Now Requires Faster Physical Proximity
The technical support conversation has changed in character over the past five years. Customers still value deep technical knowledge — they need to understand why a particular liner material is appropriate for their application, or why their vortex meter is producing noise at low flow. What has changed is the expected response time for that knowledge.
A plant engineer who encounters a measurement anomaly on a critical flow point at 9 AM wants an answer — or at minimum a credible response plan — by noon. If your technical support function works on a 24-48 hour response cycle, you’re not failing on technical quality. You’re failing on responsiveness, and in competitive markets those two things are becoming indistinguishable from the customer’s perspective.
The Competitive Disadvantage of Slow Response Times to Urgent Orders
Urgent orders — expedited deliveries needed to meet maintenance window schedules, last-minute project changes that require an additional meter, emergency replacements for failed instruments — represent a small fraction of total order volume but a disproportionate share of relationship-defining moments.
The distributor who delivers an emergency shipment of three DN100 electromagnetic meters in 36 hours for a client’s plant shutdown window earns more relationship credit from that single event than from six months of routine deliveries. The distributor who fails to deliver in that window — even once — creates a story that plant engineers retell for years.
Build your emergency fulfillment capability consciously. Know which of your A-category SKUs you can deliver same-day or next-day from existing stock. Communicate that capability proactively to key accounts, so they think of you first when the urgent need arises.
Inventory Optimization: From Guesswork to Data-Driven Decisions
Implementing Demand Forecasting That Works for Flow Instruments
Using Historical Sales Data and Market Trends to Predict Seasonal Fluctuations
Flow instrumentation demand has meaningful seasonality that most distributors don’t explicitly model in their purchasing decisions. The pattern isn’t as dramatic as seasonal consumer goods, but it’s real and consistent enough to influence stocking decisions.
Municipal water utility purchasing follows annual budget cycles, with Q4 concentration as fiscal year-end approaches. HVAC and building management orders spike in Q1 (pre-cooling season installations) and Q3 (post-summer energy audit activity). Chemical plant maintenance windows drive demand in spring and fall — creating predictable demand spikes for replacement meters and calibration services. Oil and gas projects follow capital budget cycles that tend to concentrate in H1 once annual budgets are approved.
Build these patterns into your purchasing calendar explicitly. A distributor who increases electromagnetic meter stock in Q3 to serve municipal utility Q4 purchases, and builds vortex meter inventory in February to serve spring chemical plant maintenance windows, consistently delivers better service levels than one who reacts to demand as it arrives.
How to Account for Project-Based Demand Spikes in Your Forecasting Models
Project-based demand — a single order for 20 vortex meters for a new compressor station, or 15 electromagnetic meters for a water treatment plant expansion — doesn’t show up in historical order patterns until it lands. The way to anticipate it is through pipeline intelligence: systematic conversations with your technical sales team about what their major accounts are planning.
A monthly pipeline review that captures: which clients are in engineering phase for expansions, which have announced capital projects, and which have communicated upcoming maintenance shutdowns — this is your leading indicator data. Combine it with historical patterns and it transforms your forecast from a backward-looking average to a forward-looking estimate that can actually inform purchasing decisions ahead of the demand spike.
Right-Sizing Your Stock Levels Across Multiple Locations
Calculating Optimal Inventory Levels for High-Velocity vs. Specialty Items
Optimal stock level calculation for each SKU requires three inputs: average daily demand, demand variability (standard deviation of daily demand), and your supplier lead time. The formula for safety stock (the buffer inventory held beyond average demand to protect against demand variability and supply uncertainty):
$$\text{Safety Stock} = Z \times \sigma_d \times \sqrt{L}$$
Where Z is the service level factor (1.65 for 95% service level), σ_d is the standard deviation of daily demand, and L is lead time in days. This produces a calculated safety stock level rather than a judgement-based one — and it correctly produces higher safety stock for items with variable demand, not simply for items with high average demand.
For specialty items where historical demand data is limited (fewer than 10 orders in 24 months), the formula is unreliable. For these items, use a different approach: stock a maximum of two units, with a supplier commitment to emergency delivery within an acceptable lead time window, and a clear customer communication policy for longer lead times.
The ABC Analysis Method Tailored for Instrumentation Distributors
ABC analysis (a method of classifying inventory items by their relative value contribution, enabling differentiated management strategies for each category) for flow instrumentation requires two classification axes: revenue contribution and demand regularity. The two-axis approach is more useful than single-axis revenue classification because a high-revenue specialty item ordered once per year needs fundamentally different management than a high-revenue standard item ordered weekly.
| Category | Classification Criteria | Stocking Approach | Review Frequency |
|---|---|---|---|
| A items | Top 20% of SKUs, 70–80% of revenue, predictable demand | Maximum availability, automatic reorder, high safety stock | Weekly |
| B items | Middle 30% of SKUs, ~15% of revenue, moderate demand regularity | Moderate stock, periodic replenishment | Ежемесячно |
| C items | Bottom 50% of SKUs, ~5% of revenue, irregular or project-based | Minimal stock or order-to-demand only | Quarterly |
| X items | Any item with zero sales in 12+ months | No stock, active liquidation or return | Immediate review |
Apply this matrix to your full flow meter catalog — electromagnetic by size and liner, vortex by temperature rating, ultrasonic by pipe range, turbine by application type. The result changes what you order, how much you carry, and where you allocate warehouse space.
Technology Solutions That Eliminate Manual Counting and Guessing
Real-Time Inventory Management Systems That Integrate With Your Sales Team
The gap between what your sales team tells customers you have and what you actually have is one of the most common sources of distributor credibility damage. A sales rep who quotes a two-day lead time based on a mentally-recalled stock estimate — and then discovers the unit shipped last Tuesday — creates a customer disappointment that no amount of explanation fully resolves.
Real-time inventory management systems (software platforms that update inventory records continuously as goods are received, picked, shipped, and returned) eliminate this gap by making accurate inventory data available to your sales team at the point of customer conversation. When your rep can see live stock levels during a customer call — and can also see inbound purchase orders with expected arrival dates — they can make accurate delivery commitments rather than optimistic estimates.
Acumatica’s 2025 analysis of distributor inventory visibility found that distributors with real-time inventory visibility made 40% fewer inventory-related service recovery calls than those operating on daily batch updates — directly translating to reduced support cost and improved customer satisfaction.
Automated Reorder Points That Reduce Stockouts Without Excess Inventory
Manual reorder processes — where someone checks stock levels periodically and places orders based on judgment — introduce variability and delays that automated systems eliminate. An automated reorder point (a predetermined inventory level that triggers a purchase order to the supplier automatically, calculated from average demand and lead time) fires a replenishment order at exactly the right moment, every time, without requiring a person to notice and act.
The discipline required isn’t in the technology — it’s in setting the reorder parameters correctly and reviewing them quarterly. Reorder points set on last year’s demand data become wrong as product mix shifts. Build a quarterly reorder point review into your operations calendar, and your automated system will remain calibrated to actual demand rather than historical assumptions.
Modern Logistics: Building a Supply Chain That Keeps Up
Strategic Warehouse Network Design for Flow Instrument Distribution
Evaluating Whether Your Current Distribution Footprint Serves Customer Needs
Map your current distribution locations against the geographic concentration of your customer base. Overlay your delivery time data — actual transit times by customer, not promised lead times. The exercise typically reveals one of three patterns: concentration of your warehousing far from your highest-volume customers, concentration in the right geography but insufficient stock depth to serve demand, or adequate geographic footprint but no visibility across locations.
Each pattern has a different solution. Misaligned geography requires a location decision — either a new distribution point or a logistics partnership in the underserved area. Inadequate stock depth is a purchasing and forecasting problem. Visibility gaps are a technology problem. Diagnosing which pattern you’re facing before investing in solutions prevents expensive mismatches between problem and solution.
The Case for Micro-Fulfillment Centers in High-Demand Regions
Micro-fulfillment centers (small, strategically located inventory points stocked with high-velocity items for rapid local delivery, typically serving a 50–150 km radius) are an emerging logistics model in industrial distribution that addresses the last-mile challenge without the capital commitment of a full regional distribution center.
The concept for flow instrumentation: identify your two or three highest-density customer clusters (cities or industrial zones where 30%+ of your customers are concentrated). Establish a small, managed inventory presence — a controlled-access storage unit or a consignment location at a trusted service partner — stocked exclusively with your top 10 A-category SKUs. For a distributor whose A-items include four electromagnetic meter sizes, two vortex configurations, and a portable clamp-on ultrasonic, the micro-fulfillment stock represents a manageable investment that enables same-day delivery to the cluster.
Route Optimization and Last-Mile Delivery Excellence
How to Reduce Delivery Times Without Increasing Operational Costs
Route optimization technology (software that calculates the most efficient delivery routes considering distance, traffic, delivery windows, and load constraints) typically reduces delivery costs by 15–25% while simultaneously improving delivery time predictability. For distributors making regular delivery runs to industrial facilities — rather than relying entirely on parcel carriers — route optimization produces immediate, measurable improvement.
The less obvious benefit: route optimization data tells you which customers are genuinely within efficient delivery reach and which are stretching your network to its limits. Customers consistently at the edge of your efficient delivery zone deserve a different logistics strategy — whether that’s a local carrier partnership, a consignment arrangement, or a frank conversation about minimum order quantities that make dedicated delivery economically viable.
Technology Platforms That Provide Real-Time Visibility to Your Customers
Customer visibility tools — order tracking portals, shipment status notifications, expected delivery windows updated in real time — are no longer differentiators in B2B distribution. For many industrial buyers, especially those coordinating around fixed maintenance windows, they are table stakes.
The implementation doesn’t require building a custom portal. Several distributor-focused platforms offer order visibility as a standard feature that integrates with your existing order management system. The key is making it available and actively telling your customers it exists — many distributors have these capabilities and don’t communicate them effectively, leaving customers to assume they have no visibility when the tool is already paid for.
Vendor-Managed Inventory Programs That Strengthen Customer Relationships
Setting Up Consignment Arrangements That Reduce Customer Carrying Costs
Vendor-managed inventory (VMI — an arrangement where the distributor takes responsibility for monitoring and replenishing the customer’s inventory of specific products, based on agreed parameters) programs reduce customer carrying costs by 20–30% while simultaneously making your products the default choice in that customer’s facility — because your inventory is already there.
The VMI conversation is most effective with accounts that have predictable, recurring flow meter demand: a water utility that replaces 40–60 meters annually, a chemical plant with a standing maintenance program, a food processing facility with a documented preventive replacement schedule. These customers have a clear cost case for VMI — it eliminates their inventory management burden on a product category where they have no competitive advantage in doing it themselves.
Structure the pilot carefully: agree on which SKUs are included, set minimum and maximum inventory levels, define the replenishment trigger, and establish a shared dashboard for visibility. Fishbowl’s analysis of VMI programs shows that successful VMI implementations take an average of 60–90 days to stabilize — plan accordingly and don’t abandon the program based on the first month’s friction.
Building Trust Through Transparent Inventory Sharing With Key Accounts
The trust-building element of VMI is the transparency it requires: your customer can see what you have at their site, what’s in transit, and what your restocking plan is. That transparency, executed reliably, shifts the relationship from transactional to operational — you become part of their maintenance planning process, not just a vendor they call when they need something.
Distributors who represent manufacturers with strong documentation practices — like Инструменты "Нефритовый муравей, where calibration certificates, material conformance documentation, and technical specifications are provided as standard — have a practical advantage in VMI programs because the documentation customers need for regulatory compliance arrives automatically with every replenishment.
Digital-First Customer Engagement: The New Competitive Advantage

Creating Self-Service Platforms That Don’t Sacrifice Personal Service
Online Ordering Systems Designed for Technical Buyers and Procurement Teams
A B2B online ordering platform for flow instrumentation is not an e-commerce store. Industrial buyers don’t browse and add meters to a cart — they arrive with a specification and need to confirm that what you have matches what they need. Your platform needs to accommodate this: searchable by technical specification (pipe size, connection type, liner material, output signal), configurable for custom combinations, and linked to real-time stock availability.
The highest-value feature for instrumentation procurement teams is not the checkout process — it’s the specification verification step. A platform that lets a buyer enter their application parameters and confirms which products in your catalog match, flags any potential compatibility issues, and provides the relevant technical documentation is genuinely useful. One that simply presents a product catalog with prices is a catalog with a slightly more modern presentation.
How to Balance Convenience With the Expertise Your Customers Expect
The risk in digital-first customer engagement is that self-service becomes the default for conversations that need human judgment. An online platform that allows a customer to order a turbine meter for an abrasive slurry application — because the fluid wasn’t flagged as a compatibility concern — has created a problem that wouldn’t have occurred in a phone conversation with a knowledgeable rep.
Build your platform with guardrails: application questions that surface potential compatibility issues, links to technical resources for common specification decisions, and a prominent “Talk to a specialist” option for complex or unusual applications. The Jade Ant Instruments interactive flowmeter selection tool provides an example of how structured application guidance can be embedded in a digital customer experience — reducing specification errors while preserving the distributor’s technical authority.
Real-Time Visibility: Giving Customers What They Actually Want
Tracking Systems That Show Order Status, Inventory Availability, and Delivery Windows
The information a plant procurement manager needs when they place an order is simple: when will it arrive, and where is it right now. The information they currently get from most distributors: a confirmation email with a promised lead time and a carrier tracking number that won’t update until the item leaves the warehouse in two days.
The gap between what customers need and what most distributors provide is a product specification opportunity. Distributors who provide real-time order status — from confirmation through pick, pack, ship, and delivery — with accurate delivery window estimates updated as status changes, stand out in a market where the baseline experience is static.
Proactive Communication That Prevents Surprises and Builds Confidence
The customer experience that builds the deepest loyalty is not flawless execution — it’s excellent communication when execution isn’t flawless. A distributor who proactively notifies a customer at 10 AM that their order will be one day late, explains why, and provides the revised delivery confirmation builds more trust than one who delivers on time 95% of the time but says nothing until after the missed delivery is discovered.
Set up automated triggers for exception communications: any order where the delivery date shifts by more than 4 hours from the original commitment generates an automatic customer notification with the revised date. Make this a system function, not a human decision — so it happens consistently, including on Friday afternoons and Monday mornings.
Mobile-First Solutions for Your Field Sales and Technical Teams
Equipping Your Team With Tools That Access Inventory and Customer Data in the Field
A technical sales engineer standing at a customer’s facility, discussing a potential meter upgrade, needs to answer three questions immediately: do we have the right unit in stock, what’s the lead time if we don’t, and what’s the price at this customer’s tier. If answering any of those requires a call back to the office, you’ve added a delay that a competitor with mobile access eliminates.
Mobile access to your ERP’s inventory, pricing, and order history data — available on a smartphone during a customer site visit — transforms your field team’s ability to close technical conversations in the same meeting where they occur. The technology required isn’t complex: a mobile-optimized interface to your existing ERP system, or a standalone mobile app that connects to your inventory database.
Reducing Order-to-Fulfillment Time Through Mobile Order Capture
Mobile order capture — the ability to enter a customer order directly from the field, triggering the warehouse pick process immediately — eliminates the latency between a site visit and order entry. A rep who closes a field order at 2 PM and enters it on their phone at 2:15 PM has an order in the warehouse queue by 2:20 PM. A rep who returns to the office and enters the same order the next morning has added 18 hours to the customer’s lead time without touching a single physical process.
Across a sales team of 8 reps making 3–4 field visits per week, mobile order capture typically reduces average order-to-fulfillment cycle time by 1–1.5 business days — a measurable, documentable improvement in service level that you can communicate to customers.
Integration: Connecting Your Systems So Nothing Falls Through the Cracks
ERP Systems That Actually Reflect Your Distribution Reality
Choosing Platforms Designed for Multi-Location, Multi-Customer Complexity
Distribution-specific ERP platforms (Enterprise Resource Planning systems — integrated software managing core business processes including inventory, purchasing, sales, and financials) differ from general accounting or manufacturing systems in one critical way: they are designed for the multi-location, multi-customer, variable-margin complexity that characterizes distributor operations.
A general ERP system will track what you have and what you sell. A distribution ERP tracks those things plus: inter-branch inventory visibility and transfer, customer-specific pricing tiers, lot and serial number traceability for calibration certificate management, VMI replenishment triggers by customer location, and carrier integration for real-time delivery tracking. These are not features you can easily bolt onto a general system — they require a platform architected for distribution from the ground up.
When evaluating ERP platforms, the Atwix 2026 guide to distribution ERP options provides a current comparison of platforms purpose-built for multi-location distribution — a useful reference for distributors at the evaluation stage.
Avoiding Implementation Pitfalls That Derail Other Distributors
The single most common ERP implementation failure in distribution businesses is migrating inaccurate data into a new system and then building processes on top of it. Bad data doesn’t become good data when you move it to a new platform — it becomes bad data with a more expensive interface.
Before any system migration: conduct a data quality audit. Identify duplicate customer records, inconsistent product categorization, missing cost data on historical orders, and inaccurate physical inventory counts. Clean the data in your current system, verify it against physical counts and supplier invoices, and then migrate. The audit takes time. It prevents months of “the system is wrong” conversations after go-live.
Data Synchronization Across Sales, Inventory, and Logistics
Eliminating the Disconnect Between What You Think You Have and What You Actually Have
The gap between system inventory and physical inventory — sometimes called “ghost inventory” — is one of the most insidious problems in distributor operations. It accumulates quietly through receiving errors, picking discrepancies, unreported breakage, and counting errors, until the gap is large enough to cause order failures on items the system says are in stock.
Most distributors with this problem know it exists anecdotally — their warehouse team double-checks system counts before committing to critical orders — but don’t measure it systematically. Implement a rolling cycle count program (a continuous inventory auditing process where portions of inventory are counted on a rotating schedule rather than in a single annual physical count): count your A-category items monthly, B-items quarterly, C-items semi-annually. The cycle count data reveals where the discrepancies are accumulating and allows targeted process improvement.
Real-Time Insights That Inform Better Decisions Faster
Data synchronization across sales, inventory, and logistics creates a unified view of operations that enables faster, more accurate decisions at every level. When a sales rep can see that a customer’s order has been picked and is awaiting carrier pickup, they don’t call the warehouse to check status. When a purchasing manager can see that three A-category items will hit their reorder point within five days, they don’t wait for a stock-out to trigger a purchase order.
DCKAP’s 2025 ERP integration analysis found that distributors with fully synchronized sales, inventory, and logistics data reduced order processing errors by 34% and cut average order fulfillment time by 1.2 days compared to those operating with disconnected systems. In a market where lead time is a differentiator, 1.2 days is a meaningful competitive advantage.
API Connections That Link Your Systems to Customer Platforms
Seamless Integration With Customer Procurement Systems
Large industrial accounts increasingly operate procurement through enterprise systems — SAP, Oracle, or Coupa-based platforms — that manage purchase requisitions, approvals, and vendor performance tracking centrally. Distributors who can connect their order management system to these customer platforms via API (Application Programming Interface — a technical connection that allows two software systems to exchange data automatically) eliminate the manual data entry step that adds latency and introduces errors on both sides.
The practical benefit: a customer procurement engineer generates a purchase requisition in their ERP. The API sends the order directly to your order management system. Your warehouse receives the pick ticket without a human intermediary. The customer’s system receives confirmation and order status updates automatically. The entire process that previously required emails, phone calls, and manual data entry happens in seconds.
Reducing Manual Data Entry and Order Processing Errors
Manual data entry is the most common source of order processing errors in distributor operations: wrong product codes, transposed digits in quantity fields, incorrect ship-to addresses. Each error creates a recovery process — customer contact, order cancellation, re-entry, expedited shipping — that costs far more than the original order’s margin.
Anchanto’s real-time inventory synchronization analysis documents that distributors who eliminate manual re-entry between customer orders and warehouse management systems reduce order error rates by 25–40%. The investment in API connection is typically recovered within the first six months through reduced error recovery cost alone.
Building Resilience: Preparing for Supply Chain Disruptions
Diversifying Your Supplier Base Without Sacrificing Quality
Identifying Critical Components and Establishing Backup Suppliers
Single-source dependency in flow instrumentation distribution creates a category of business risk that doesn’t surface until it matters most. If your primary electromagnetic meter supplier experiences a production hold, a quality issue, or a logistics disruption, and you have no qualified alternative, you cannot serve your customers’ needs during the gap — and competitors who can will use that window to develop relationships in your accounts.
Identify the product categories where you currently have only one qualified supplier. For each, develop a backup relationship: identify an alternative manufacturer, review their technical documentation and certifications, order a sample unit and have it independently calibrated, and confirm that they can supply on acceptable terms. You don’t need to place regular orders with the backup — you need them qualified and ready to activate in 48 hours when the primary supply is disrupted.
Jade Ant Instruments’ ISO certification and standardized documentation process — calibration certificates, material conformance records, and technical specifications provided with every shipment — makes the qualification process for new distributor relationships straightforward. Distributors using Jade Ant as a qualified backup supplier report that the documentation quality significantly reduces their qualification timeline.
Managing Relationships With Multiple Vendors to Ensure Continuity
Backup supplier relationships require active maintenance. A supplier you qualified two years ago and haven’t communicated with since may have changed their product line, their quality standards, or their supply terms. Schedule an annual review with each backup supplier: confirm that their certifications are current, review any product changes, and confirm pricing and lead times.
The goal is not to spread your purchasing across all suppliers equally — that approach fragments your volume and weakens your relationship with your primary suppliers. It’s to maintain a qualified, ready alternative for each critical category, ensuring you can activate it immediately when needed.
Safety Stock Strategies That Protect Against Unpredictable Events
Calculating Appropriate Buffer Stock for Your Highest-Impact SKUs
Safety stock calculation for disruption resilience is different from safety stock calculation for demand variability. Demand-variability safety stock protects against your customer ordering more than expected. Disruption safety stock protects against your supplier being unable to deliver at all.
For your top 10 A-category SKUs, calculate a disruption safety stock based on: your average monthly sales volume for that SKU, multiplied by the maximum realistic supplier disruption duration (typically 4–8 weeks for international supply), divided by 30 to get a daily buffer, multiplied by your target coverage days.
For a DN80 electromagnetic meter that sells 8 units per month, with a supplier that takes 6 weeks to air-freight emergency replacements, a 45-day disruption safety stock would be: (8 × 1.5 months) = 12 units held specifically as disruption buffer, in addition to your standard demand-variability safety stock.
Geographic Distribution of Critical Inventory to Mitigate Regional Disruptions
Natural disasters, port disruptions, and regional logistics failures affect specific geographies, not your entire distribution network simultaneously. Distributors who hold all their critical inventory at a single central warehouse are more vulnerable to regional disruptions than those who maintain even small distributed quantities at multiple locations.
For your top five A-category SKUs, consider splitting your safety stock across two locations in different geographic regions. The additional carrying cost of holding dual-location buffer stock is modest for items with high replacement value — and the protection it provides against regional disruption is significant.
Communication Plans That Keep Customers Informed During Crises
Establishing Transparent Protocols for Communicating Delays and Alternatives
A disruption communication plan should be written before the disruption occurs — because the first 24 hours of a supply crisis are consumed by logistics problem-solving, and there is no bandwidth to also design a customer communication strategy from scratch.
Define in advance: which customers receive direct outreach (strategic and A-tier accounts), what information is communicated (cause of disruption, estimated recovery timeline, alternatives available), who is responsible for customer communication (account managers, not operations), and what the escalation path is if a customer’s situation is urgent.
The communication standard that industrial customers most appreciate in a disruption: early notification, honest timeline assessment, and a specific alternative proposal. A distributor who calls a customer the morning they discover a supply problem — before the customer asks — and says “we have a supplier issue affecting this SKU, here’s what we can offer as an alternative, and here’s our best estimate of the resolution timeline” preserves more relationship credit than one who waits until the delivery misses to explain.
Maintaining Customer Relationships When You Can’t Meet Normal Service Levels
The customers who forgive service disruptions are the ones who feel their supplier treated them like a partner during the problem — not like a number in a queue waiting for normal service to resume. Concrete actions that signal partnership during disruptions:
Offer priority allocation of limited stock to your highest-dependence customers first. Proactively help affected customers source from alternative channels, even if that means temporarily directing them to a competitor — customers remember this level of integrity, and it earns long-term loyalty that short-term revenue protection cannot buy. Document every commitment you make during the disruption and honor every one of them, even if it’s expensive to do so.
Measuring Success: The Metrics That Matter to Your Bottom Line
Key Performance Indicators for Distribution Excellence
Order Accuracy Rates and Their Direct Impact on Customer Satisfaction
Order accuracy (the percentage of orders shipped with the correct product, quantity, configuration, and documentation) is one of the highest-leverage operational metrics for flow instrumentation distributors — because the cost of an order error in this product category is disproportionate to the product value.
An incorrect electromagnetic meter configuration shipped to a customer who needed it for a maintenance window doesn’t just create a return-and-replace hassle. It may delay a plant shutdown rescheduled around that delivery, at a cost that vastly exceeds the meter’s value. The target for order accuracy in flow instrumentation distribution: 99%+. Anything below 98% represents a process failure that is costing you more than the direct return handling cost.
Inventory Turnover Ratios That Reveal Hidden Profitability Opportunities
| Product Category | Healthy Turnover Target | Below This = Review Required |
|---|---|---|
| Standard electromagnetic meters (common sizes) | 8–12× per year | < 6× |
| Standard vortex meters | 6–10× per year | < 4× |
| Clamp-on ultrasonic meters | 5–8× per year | < 4× |
| Specialty/custom configurations | 2–4× per year | < 2× |
| Кориолисовые расходомеры | 3–6× per year | < 2× |
| Weighted average (all SKUs) | 4–8× per year | < 4× |
Benchmarks derived from industrial instrumentation distribution performance data and flow meter distributor discussions with Jade Ant Instruments partners, 2024–2025.
Review turnover by category monthly. Items consistently below their target turnover are candidates for the slow-moving SKU reduction program. Items consistently at or above target are candidates for increased safety stock.
Customer-Centric Metrics That Drive Retention
On-Time Delivery Performance and How It Influences Repeat Business
On-time delivery percentage (the proportion of orders delivered on or before the committed delivery date) is the single metric most strongly correlated with customer retention in industrial distribution. The FleetWorks analysis of industrial B2B SLAs confirms the industry benchmark: 95–98% on-time delivery is the threshold at which customers stop considering delivery reliability as a competitive differentiator and start focusing on other dimensions of the relationship.
Below 95%, every late delivery compounds existing skepticism. Above 98%, customers begin referencing your reliability proactively in conversations with their peers — the kind of organic advocacy that no marketing investment can replicate.
Order Fulfillment Speed Benchmarks for Your Industry Segment
| Customer Segment | Expected Lead Time | Best-in-Class |
|---|---|---|
| Standard stock items, major account | 2–3 business days | Same day to next day |
| Standard stock items, regular account | 3–5 business days | 2–3 business days |
| Non-stock items, standard lead time | 2–4 weeks | 7–10 business days |
| Emergency/urgent orders (stock items) | Same day | Within 4 hours |
| Custom configured items | 4–8 weeks | 2–3 weeks with vendor cooperation |
Track your actual performance against these benchmarks quarterly. The gap between your current performance and best-in-class in each row is a specific investment opportunity — and closing that gap has a quantifiable customer retention impact.
Financial Metrics That Justify Your Investment in Modern Solutions
Calculating ROI on Inventory Optimization and Logistics Improvements
The ROI framework for supply chain investment starts with a baseline cost assessment: what are your current excess inventory carrying costs, your emergency freight expenses, your order error recovery costs, and your lost sales from stock-outs? These are your current-state losses — the denominator that makes the investment case.
A distributor carrying $900,000 in flow instrumentation inventory at a 25% carrying cost rate is spending $225,000 annually on inventory holding. A 20% reduction in excess inventory through ABC analysis and demand forecasting saves $45,000 per year in carrying cost alone — before counting the improved working capital position and the additional purchasing flexibility.
Add logistics efficiency gains (typically 15–25% reduction in delivery cost through route optimization and carrier rationalization), reduced order error rates (25–40% reduction in error recovery cost), and improved customer retention (a 5% improvement in retention typically increases revenue by 25–95% over five years in B2B distribution) — and most supply chain improvement programs generate positive ROI within 12–18 months.
Understanding the Relationship Between Service Quality and Pricing Power
Distributors who deliver consistently — high on-time delivery, low order error rates, proactive communication — command measurable pricing premiums. The distribution strategy analysis by Distribution Strategy Group documents that best-in-class service distributors in industrial markets regularly command 3–8% price premiums over average-service competitors on equivalent products.
That pricing power is the financial return on your service quality investment — and it compounds over time. A customer who values your reliability won’t switch for a 2% price difference from a competitor with an uncertain service record. That loyalty is the practical expression of the margin premium, and it is earned through operational consistency, not through marketing.
Real-World Implementation: From Strategy to Execution
Phased Approach to Modernizing Your Distribution Operation
Quick Wins That Demonstrate Value and Build Internal Support
Phase 1 of any supply chain modernization should generate visible results within 60–90 days, because visible results build the internal credibility needed to sustain the longer-term work. The highest-return quick wins in flow instrumentation distribution:
Slow-moving SKU liquidation: Pull a report of every SKU with zero sales in 12 months. For each, calculate carrying cost consumed to date. Present the list to your warehouse manager and establish a monthly liquidation program — manufacturer returns where possible, distributor-network sales where not, scrap as a last resort. The working capital freed in the first 90 days is often more than enough to fund the technology investment planned for Phase 2.
Reorder point automation for A-category items: Take your top 20 SKUs by revenue, calculate correct reorder points using the demand and lead time data you already have, and enter them into your existing system. If your system supports automatic purchase order generation, enable it. If not, the manual trigger is still more reliable than the current intuition-based process.
Carrier performance audit: Pull 90 days of delivery data, calculate on-time delivery percentage by carrier and by route, and identify your worst-performing carrier-route combinations. Contact your carrier rep with the data and demand a performance improvement plan. If they can’t commit to one, pilot an alternative carrier on those routes.
Long-Term Investments That Create Sustainable Competitive Advantages
Phase 2 and 3 investments — ERP system upgrades, VMI program rollouts, mobile field tools, customer-facing visibility platforms — generate returns over a 12–36 month horizon rather than 90 days. The sequencing matters: get your data foundation right before building analytics on top of it, and get your logistics fundamentals right before building customer-facing digital tools on an unreliable operational base.
The distributors who attempt digital customer engagement without the operational foundation to back it up — offering real-time order tracking when their order accuracy is 94% — create a visibility tool that shows customers their problems faster rather than solving them.
Change Management: Getting Your Team Aligned and Engaged
Training Your Sales Team on New Systems and Customer Engagement Tools
System adoption failures are almost never technology failures — they are change management failures. Your sales team will use new tools if those tools genuinely make their daily work easier and more effective. They will work around tools that add friction without adding value.
The key question for any new tool before deployment: does this make it easier for a sales rep to serve a customer during a real interaction? If yes, adoption will be natural. If the tool is primarily designed to give management visibility into rep activity, expect resistance.
Train your team on new systems by walking through real customer scenarios — not system features. “Here’s how you check stock availability while you’re on the phone with a plant manager at a chemical facility” is more effective than “here’s how to navigate the inventory module.”
Addressing Resistance and Building Enthusiasm for Modern Processes
Resistance to process change is information, not obstruction. The team members who push back on new systems are often identifying real friction points that will become adoption barriers if not addressed. Listen to the specific objections — they frequently reveal either a genuine process design issue or a communication gap about the purpose of the change.
The most effective change communication for operational teams: explain the customer problem you’re solving, not the operational efficiency you’re pursuing. “This lets us give customers accurate delivery estimates instead of calling back to confirm” gets buy-in from customer-focused team members in a way that “this reduces our order processing time” does not.
Partnering With Technology Providers and Logistics Experts
Evaluating Vendors Who Understand Flow Instrumentation Distribution
Technology vendors who specialize in industrial distribution bring assumptions and default configurations that match your operational reality — multi-location inventory, technical product specifications, calibration documentation requirements — in ways that general distribution software does not.
During vendor evaluation, give each candidate a specific scenario from your current operations: “We have a customer who needs a custom-configured electromagnetic meter, non-stock, with a specific certification package. Walk me through how your system handles the order, tracks the status, and generates the documentation.” The quality of that walkthrough tells you more about operational fit than any feature comparison matrix.
Negotiating Contracts That Align Incentives With Your Success
Technology vendor and 3PL (Third-Party Logistics — an external company providing logistics services including warehousing, transportation, and fulfillment on behalf of another business) contracts should include performance commitments, not just feature lists. For logistics partners: on-time delivery percentage commitments with financial consequences for under-performance. For technology vendors: implementation timeline commitments, support response SLAs, and uptime guarantees.
When evaluating 3PL partners specifically, DCL Logistics’ 10-metric 3PL evaluation framework provides a structured approach to comparing providers beyond simple rate comparison — covering technology integration capabilities, industry experience, and service level commitment structure.
The Future of Distribution: Staying Ahead of the Curve
Emerging Technologies Reshaping Flow Instrument Distribution
IoT Sensors That Provide Real-Time Equipment Monitoring and Predictive Ordering
IoT (Internet of Things — networks of connected sensors and devices that collect and transmit data without direct human intervention) integration with flow meters creates a new demand-generation model for distributors: instead of waiting for a meter to fail and a customer to call, you receive performance data that predicts when a meter is approaching calibration drift or end-of-life. The replacement order can be initiated before the customer experiences a problem.
This predictive ordering model requires your customers to share meter diagnostic data with you — a trust relationship that takes time to develop and requires a clear value proposition: “We can proactively monitor your installed meters and notify you when calibration or replacement is needed, eliminating emergency replacements and unplanned downtime.” For customers with critical measurement points, this proposition is compelling.
The technology infrastructure to support it is increasingly accessible. PwC’s 2026 Digital Trends in Operations Survey reports that 66% of industrial operations managers are now applying AI-enabled tools to supply chain planning and forecasting — creating a market context where distributors who offer predictive capabilities align with the direction their customers’ organizations are already moving.
AI-Powered Demand Forecasting That Learns From Your Unique Market Patterns
Conventional demand forecasting uses historical averages and seasonal adjustments. AI-powered forecasting analyzes patterns across multiple data dimensions simultaneously — historical order data, sales pipeline CRM inputs, regional economic indicators, customer-reported maintenance schedules, manufacturer lead time trends — and produces forecasts that improve in accuracy as the model learns from your specific market context.
Datup.ai’s 2026 supply chain trends analysis reports that AI-driven demand forecasting reduced excess inventory exposure by 15–25% for distributors who implemented it in 2024–2025, while simultaneously reducing stock-out frequency on high-velocity items. For flow instrumentation distributors managing hundreds of SKUs with heterogeneous demand patterns, this dual improvement — less excess, fewer stock-outs — directly addresses the core inventory paradox.
Sustainability Expectations and Their Impact on Distribution Strategy
How Customers Increasingly Evaluate Distributors on Environmental Responsibility
Industrial procurement teams — particularly those at large manufacturing companies with published sustainability commitments — are beginning to include distributor sustainability performance in vendor evaluation criteria. This takes practical forms: preferred carriers with verified emissions data, packaging that minimizes materials use and enables recycling, consolidated delivery scheduling that reduces per-unit emissions.
This is not yet a decisive selection criterion for most industrial buyers. But it’s moving in that direction, particularly for large accounts whose own customers are scrutinizing their supply chain sustainability performance. Distributors who invest now in measurable sustainability metrics — emissions per delivery, packaging materials per shipment, fleet electrification planning — will be ahead of the requirement curve when it becomes mandatory rather than preferred.
Optimizing Logistics Networks to Reduce Carbon Footprint While Improving Service
The good news on logistics sustainability: most measures that reduce carbon footprint also reduce cost. Route optimization reduces fuel consumption while cutting delivery time. Consolidated deliveries reduce vehicle movements while reducing per-unit freight cost. Warehouse location rationalization reduces transportation distance while reducing network operating cost.
Present your logistics sustainability work to environmentally-focused customers using specific metrics: tons of CO₂ avoided through route optimization, percentage of deliveries consolidated versus single-unit, or fleet emissions intensity per shipment. Specificity in sustainability claims builds credibility; vague statements about “commitment to environmental responsibility” do not.
Building a Competitive Moat Through Superior Distribution
How Best-in-Class Distributors Use Supply Chain Excellence as a Differentiator
The enduring competitive advantage in distribution is not product — it’s reliability. Customers who can predict exactly how you will perform — what your lead time will be, what your order accuracy will be, how quickly you will respond when something goes wrong — reduce their operational risk by relying on you. That risk reduction has economic value they will pay for, even when lower-price alternatives exist.
Build that predictability consciously. Set service level commitments in writing. Track your performance against them. Report results to key accounts quarterly. The distributors who make their service level performance visible to customers — rather than hoping customers don’t notice when it slips — build the kind of operational credibility that is genuinely difficult for competitors to replicate.
Сайт Jade Ant Instruments common flowmeter mistakes guide documents a practical truth: one preventable customer complaint in flow instrumentation typically costs between 15 and 30 times the gross margin on the original order. Every process improvement that prevents a complaint generates compounding return through customer retention, referral value, and margin protection.
Creating Switching Costs Through Service Reliability and Customer Integration
Switching costs (the practical and financial barriers that make it difficult for a customer to change suppliers, even when a competitor offers a lower price) in flow instrumentation distribution are built through operational integration, not through contract lock-in. A customer who has been trained to use your VMI system to manage their meter inventory, who receives automatic calibration reminders tied to the serial numbers you track, and whose procurement system is API-connected to your order management — that customer faces significant operational disruption in changing distributors, regardless of what the price differential might be.
This level of integration takes 12–24 months to build with a key account. But once established, it is a relationship asset that your competitors genuinely cannot replicate quickly — because it’s not based on product or price, but on operational interdependence that your customer has actively built and would need to actively dismantle.
Your Path Forward
The distribution challenges facing flow instrumentation distributors today are real, but they’re not insurmountable. The most successful distributors aren’t choosing between traditional excellence and modern efficiency — they’re combining both. By systematically addressing inventory optimization, modernizing logistics, and embracing digital-first customer engagement, you transform distribution from a cost center into a genuine competitive advantage.
The distributor who masters these disciplines doesn’t just serve existing customers better — they become the supplier that key accounts specify by name in their internal procurement guidelines. That specification — “preferred supplier for flow instrumentation” — is the commercial outcome that all of the operational work described in this guide is designed to produce.
The question isn’t whether you can afford to modernize your distribution operation. Given the margin pressure, the retention impact of delivery failures, and the working capital consumed by excess inventory, the question is whether you can afford not to.
Start with the quick wins. Build the data foundation. Add digital capability to a reliable operational base. And measure every improvement against the customer retention and margin outcomes that justify the investment.
📺 Watch: Supply Chain Optimization for Industrial Distributors

This video covers practical supply chain optimization concepts directly applicable to B2B industrial distribution — including inventory management strategies, logistics network design, and digital customer engagement. Recommended viewing for your operations and sales leadership team before your next strategy session.
Ready to solve your specific distribution challenges?
Сайт Jade Ant Instruments distributor support team works directly with flow instrumentation distributors and agents on the operational, technical, and commercial dimensions of building a stronger distribution business.
Schedule a consultation with our supply chain optimization specialists to assess your current distribution challenges and identify the highest-impact improvements for your operation.
👉 Contact Jade Ant Instruments Today — and bring your toughest distribution challenge to the conversation.

Глоссарий основных терминов
| Term | Plain-Language Definition |
|---|---|
| Carrying cost | The total annual cost of holding inventory: capital cost, storage, insurance, handling, and obsolescence risk. Typically 20–30% of inventory value per year. |
| ABC analysis | A method of classifying inventory by value contribution — A items are highest value, C items are lowest — enabling differentiated management strategies. |
| Safety stock | Buffer inventory held beyond average demand to protect against demand variability and supply disruption. Calculated from demand variability and supplier lead time. |
| VMI (Vendor-Managed Inventory) | An arrangement where the distributor takes responsibility for monitoring and replenishing the customer’s inventory, based on agreed parameters. |
| Reorder point | A predetermined inventory level that automatically triggers a purchase order, calculated from average demand and supplier lead time. |
| On-time delivery percentage | The proportion of orders delivered on or before the committed delivery date. Industry benchmark for B2B industrial distribution: 95–98%. |
| Inventory turnover | Cost of goods sold divided by average inventory value — how many times your inventory “sells through” per year. |
| ERP (Enterprise Resource Planning) | Integrated software managing core business processes including inventory, purchasing, sales, and financials. |
| API (Application Programming Interface) | A technical connection allowing two software systems to exchange data automatically without human intervention. |
| 3PL (Third-Party Logistics) | An external company providing logistics services including warehousing, transportation, and fulfillment on behalf of a distributor. |
| Micro-fulfillment center | A small, strategically located inventory point stocked with high-velocity items for rapid local delivery, typically serving a 50–150 km radius. |
| Switching cost | The practical and financial barriers that make it difficult for a customer to change suppliers, built through operational integration and service reliability. |
| Cycle count | A continuous inventory auditing process where portions of inventory are counted on a rotating schedule rather than in a single annual physical count. |
| Last-mile delivery | The final leg of a shipment’s journey from a distribution hub to the customer’s facility — typically the most expensive and time-sensitive segment. |
FAQs: Distribution Challenges 2.0 for Flow Instrumentation Distributors
1. How can we reduce excess inventory without risking stockouts of critical flow instruments?
Start with demand forecasting software that analyzes your historical sales patterns, seasonal trends, and your sales team’s project pipeline intelligence. Apply ABC classification to your full SKU catalog: carry maximum safety stock on A-items with predictable demand, moderate stock on B-items, and shift C-items to order-on-demand fulfillment. Most distributors reduce excess inventory by 15–25% within six months while actually improving fill rates on fast-moving items — because freed working capital can be redeployed into deeper safety stock on the items that actually matter.
2. What’s the right inventory turnover ratio for flow instrumentation distribution?
Turnover targets vary by product category. Standard electromagnetic meters in common configurations should turn 8–12 times annually. Standard vortex and ultrasonic units should turn 6–10 times. Specialty and custom-configured instruments turning 2–4 times annually is acceptable given their lower demand regularity. If your weighted average turnover across all SKUs falls below 4 times per year, you have excess working capital tied up in inventory that isn’t earning its keep — and the ABC classification process is the right diagnostic starting point.
3. Should we consolidate our distribution centers or expand to more locations?
This is rarely a binary choice. Most successful flow instrumentation distributors use a hub-and-spoke model: one or two main distribution centers with adequate depth across A and B-category items, supplemented by micro-fulfillment inventory at or near your highest-density customer clusters. This balances inventory carrying cost with customer proximity, and it scales incrementally as your business grows in specific geographies rather than requiring a large upfront infrastructure investment.
4. How do we implement a VMI program without losing control of our inventory?
Start with one supplier relationship and one customer pilot willing to share demand data transparently. Establish clear parameters before launch: target inventory levels by SKU, reorder triggers, replenishment lead time commitments, and service level expectations. Maintain real-time visibility through a shared dashboard — the customer can see what you have at their location, and you can see their consumption rate and forecast. Schedule monthly reviews during the first six months. A well-structured VMI pilot typically reduces customer carrying costs by 20–30% while giving you deeper account integration — making it a high-value relationship tool, not just a logistics arrangement.
5. What’s the best way to transition customers to digital ordering without losing the personal service element?
Implement your digital platform as an enhancement to personal service, not a replacement for it. Have your account managers personally walk each major customer through the platform setup, demonstrating specifically how it saves them time on routine reorders. Reserve your team’s customer contact time for technical consultations, new application discussions, and strategic account planning — activities where human expertise genuinely creates value. The online platform handles routine order placement; your technical team handles everything that requires professional judgment.
6. How can we improve on-time delivery performance without significantly increasing logistics costs?
The biggest gains in on-time delivery usually come from process improvements rather than logistics cost increases. Focus first on reducing order processing time and improving inventory accuracy — these are often the real causes of delivery delays, not carrier performance. Then audit your carrier performance data by route and identify your worst-performing carrier-route combinations. Route optimization technology typically reduces delivery cost by 15–25% while improving time predictability. Proactive customer communication when delays occur preserves relationship value even when on-time performance is temporarily below target.
7. What’s the ROI timeline for investing in supply chain optimization technology?
Most flow instrumentation distributors achieve positive ROI within 12–18 months on supply chain technology investments. Quick-win improvements — automated reorder points, carrier route optimization, cycle count programs — typically deliver measurable value within 3–6 months. Larger investments like ERP upgrades or VMI program infrastructure take longer to generate return but create more durable competitive advantages. Calculate your baseline before investing: excess inventory carrying cost + emergency freight expense + order error recovery cost + estimated lost sales from stock-outs. That total is your current annual pain — your new system’s cost should be a fraction of it.
8. How do we handle stocking both commodity and highly specialized flow instrumentation items?
The segmentation is fundamental: commodity items (standard sizes, common configurations, high demand frequency) should be stocked aggressively with high turnover and automated reorder. Specialty items (unusual sizes, rare materials, specific certifications, low demand frequency) should be managed with minimal physical stock supplemented by drop-ship arrangements with your manufacturer and accurate lead time communication to customers who need them. The key is never confusing customers about lead times: be explicit that specialty configurations require 2–4 weeks, not implied that they’re available from stock. Managing expectations accurately is better than managing disappointed customers reactively.
9. What metrics should we track to prove that our distribution improvements are working?
Track these nine core metrics, connecting operational performance to financial outcomes: inventory turnover ratio (by category), days inventory outstanding (DIO), on-time delivery percentage, order accuracy percentage, customer retention rate, gross margin percentage, working capital requirements, revenue per active account, and customer lifetime value for your strategic tier. Review the operational metrics monthly; review the financial outcomes quarterly. The connection between improved on-time delivery and reduced customer churn, between reduced excess inventory and improved working capital — making that connection visible is how you justify continued investment in supply chain improvement.
10. How can we use data to predict which flow instruments will be in high demand?
Combine three data streams: historical sales data analyzed by season, customer segment, and product category (your backward-looking signal); your sales team’s CRM pipeline data capturing which customers are in planning or engineering phases for expansion projects (your forward-looking signal); and industry trend data covering new regulatory requirements, infrastructure investment announcements, and market reports (your macro signal). Modern AI-powered forecasting software can weight and combine these inputs automatically. Until you have that technology in place, a monthly cross-functional meeting between your sales leadership and purchasing team — specifically to share pipeline intelligence and translate it into purchasing adjustments — achieves most of the same benefit with existing tools.
11. What’s the biggest mistake distributors make when modernizing their supply chain?
Attempting to transform everything simultaneously. Successful distributors prioritize: first, fix inventory accuracy and forecasting (this is the foundation everything else rests on); second, optimize logistics and delivery performance; third, implement digital customer engagement tools on top of a reliable operational base. Attempting all three simultaneously overwhelms your team’s change management capacity, dilutes your investment impact, and creates a period of operational uncertainty that your customers will notice. Sequence the transformation so each phase stabilizes before the next begins.
12. How do we evaluate whether a 3PL partner can actually improve our distribution?
Don’t evaluate on rates alone — that approach optimizes the wrong variable. Evaluate on four dimensions: technology (does their WMS integrate with your ERP? do they provide real-time shipment visibility?), industry experience (have they served other industrial instrumentation distributors? can they provide references?), performance data (what are their documented on-time delivery and order accuracy rates?), and contractual commitment (will they accept performance SLAs with financial consequences for underperformance?). Run a pilot program with a specific region or customer segment before committing to a full network transition. A good 3PL partner should improve on-time delivery and reduce total logistics cost simultaneously — not force you to trade one for the other.
13. What’s the relationship between distribution excellence and pricing power?
Significant and measurable. Distributors who consistently deliver above 97% on-time, maintain 99%+ order accuracy, and provide proactive communication regularly command 3–8% price premiums over average-service competitors on equivalent products. Industrial buyers will pay for reliability because the cost of delivery failure — production delays, maintenance window misses, compliance gaps — consistently exceeds the cost of a modest supplier price premium. As your distribution metrics improve, document them and communicate them to key accounts. “Our on-time delivery rate with your facility over the past 12 months was 98.3%” is a pricing conversation tool, not just a quality metric.