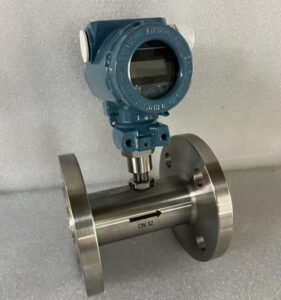

The ultrasonic flow meter market is experiencing unprecedented expansion, with a projected 5% compound annual growth rate (CAGR) driving the sector toward a multi-billion-dollar valuation over the coming years. This article breaks down what distributors and agents — not retail buyers, but the B2B professionals sourcing and reselling this equipment — need to know to strategically position themselves and capture emerging opportunities in this rapidly evolving market landscape.

Understanding the Market Opportunity
Why the Ultrasonic Flow Meter Market Is Experiencing Explosive Growth
If you have been quoting flow instrumentation projects for more than a few years, you have probably already noticed the shift: more end users are asking for non-invasive, clamp-on measurement instead of mechanical meters with moving parts. That shift is not anecdotal — it shows up clearly in the analyst data. According to Fortune Business Insights, the global ultrasonic flow meter market stood at roughly $2.18 billion in 2026 and is projected to climb toward $3.56 billion, a trajectory that other research houses largely corroborate: Fact.MR projects the market reaching $3.4 billion by 2036 at a 5.1% CAGR, while Coherent Market Insights puts the figure at $3.27 billion by 2033. The direction is unanimous even where the exact year varies: this is a market compounding steadily, not spiking briefly.
For readers who are less familiar with the term, CAGR (Compound Annual Growth Rate) is the steady annual growth rate that, if applied consistently every year, would take a market from its starting value to its ending value over a defined period. A 5% CAGR does not mean flat 5% growth every single year — some years will run hotter, some cooler — but it is a useful planning average for budgeting inventory, headcount, and marketing spend.
The 5% CAGR Trajectory: What the Numbers Tell Us
Using a moderate 5% CAGR as a planning baseline (consistent with the midpoint of published analyst ranges, which span from roughly 5.1% to 6.9%), a distributor can reasonably expect the addressable market in their territory to grow by a predictable, compounding margin every single year through the rest of the decade. That is a meaningfully different planning environment than a flat or declining product category. The compounding math matters here: a market growing at 5% annually roughly doubles every 14 years, but more importantly for near-term planning, it grows by more than 20% cumulatively over any four-year stretch — which is exactly the kind of tailwind that makes it easier to justify inventory expansion, new hires, or a second warehouse.
Key Drivers Behind Market Expansion and Their Impact on Your Distribution Strategy
Three forces are doing most of the work behind this curve. First, regulatory pressure on water loss and emissions monitoring is pushing municipal utilities and industrial plants toward metering they previously avoided. Second, the retrofit economics of clamp-on ultrasonic technology — no pipe cutting, no process shutdown — make it dramatically cheaper to add metering to existing infrastructure than mechanical alternatives ever were. Third, the broader shift toward Industry 4.0 (the integration of real-time data, automation, and connected sensors into industrial operations) means flow data is no longer a nice-to-have; it feeds directly into plant efficiency dashboards and predictive maintenance systems. For a distributor, each of these drivers points toward the same conclusion: customers are not just replacing old meters, they are adding metering points that did not exist before, which expands your total addressable market rather than just reshuffling existing demand.
How a $3.56B Market Opportunity Translates to Real Revenue for B2B Distributors
A multi-billion-dollar global figure is only useful once you translate it down to your own book of business. That translation is where most distributors either get excited by a headline number or dismiss it as irrelevant marketing noise — the truth lives in between.
Identifying Your Market Share Potential
Start with your current annual ultrasonic flow meter revenue and divide it by your best estimate of the addressable market in your specific territory and verticals (not the global figure — your realistic geographic and industry slice of it). That percentage is your current market share. If you are currently capturing 2% of a $40 million regional market, a market growing at 5% annually turns that $40 million into roughly $48.6 million within four years — meaning that even holding your share flat nets you real revenue growth, and any share gains compound on top of that.
Understanding the Competitive Landscape in 2028
By 2028, expect the competitive field to have consolidated somewhat at the manufacturer level (more on this in Section 5) while simultaneously fragmenting at the distributor level as new regional players enter to chase the growth. That combination — fewer but larger suppliers, more numerous but smaller distributors — rewards distributors who build direct customer relationships, technical credibility, and localized support rather than those who compete purely on catalog breadth or price.
Market Size, Growth Projections, and Financial Implications
Current Market Valuation and the Path to $3.56B
Breaking Down the $1.5B+ Market Expansion
Just a handful of years ago, the global ultrasonic flow meter category sat closer to the $1.5–1.8 billion range before accelerating past the $2 billion mark. That expansion was driven less by price inflation and more by unit volume — more meters being specified into more applications as the technology proved itself in demanding environments like custody transfer and wastewater monitoring. For distributors, the practical implication is that growth is coming primarily from new installations, not price increases on existing product lines, which means your growth strategy should prioritize expanding your customer base and application coverage over squeezing more margin from existing accounts.
Year-by-Year Growth Projections Through 2028
The table below reconstructs the published trajectory from Fortune Business Insights’ 2026 base figure, applying their reported 6.3% CAGR, so you can see how the market actually compounds year over year rather than jumping straight from one headline number to another.
| Year | Projected Global Market Value | YoY Growth |
|---|---|---|
| 2026 | $2.18B | — |
| 2027 | $2.32B | +6.3% |
| 2028 | $2.46B | +6.3% |
| 2029 | $2.62B | +6.3% |
| 2030 | $2.78B | +6.3% |
| 2031 | $2.96B | +6.3% |
| 2032 | $3.15B | +6.3% |
| 2033 | $3.34B | +6.3% |
| 2034 | $3.56B | +6.3% |
Source: modeled from Fortune Business Insights published base-year data and CAGR.
Note for planning purposes: at 2028, the market sits closer to $2.46 billion on this real analyst trajectory, with the full $3.56 billion milestone reached by the mid-2030s. If you build your budget around a more conservative 5% moderate-growth model instead of the higher 6.3% figure, your 2028 planning number should land somewhere in the $2.4–2.5 billion range globally — still a meaningfully larger pie than today.
Revenue Forecasting for Distributors: How to Calculate Your Opportunity
Determining Your Addressable Market
Your addressable market is not the global figure — it is the subset defined by your geography, your active verticals, and the product categories you are authorized or equipped to sell. A distributor covering municipal water and HVAC in a single mid-sized country should size their market using regional infrastructure spending data and utility budgets, not the global $2+ billion headline.
Modeling Conservative, Moderate, and Aggressive Growth Scenarios
A useful planning exercise is to run three scenarios side by side: conservative (3% annual growth, assuming flat market share and no new verticals), moderate (5% annual growth, assuming your regional market tracks the global average and you defend your current share), and aggressive (7–8% annual growth, assuming you actively add one or two new verticals or geographies). Running all three against your current revenue base gives leadership a realistic range to plan hiring, inventory, and capital allocation around, rather than anchoring to a single optimistic number.
Competitive Positioning: Why Timing Matters Now
Early Adopters vs. Late Entrants: The Financial Difference
Distributors who build technical credibility and stocked inventory in a growing category during its expansion phase tend to become the default call when a customer has an urgent need — and urgent needs command better margins than competitively bid, planned projects. Waiting until the market is more mature means competing for the same accounts against distributors who already have a two- or three-year head start on relationships and reference installations.
Strategic Advantages of Capturing Market Share Early
Early movers also get first access to manufacturer support resources — training slots, marketing co-op funds, and priority allocation during supply constraints — because manufacturers like Instrumentos Jade Ant actively invest more support into distributors who demonstrate committed growth in a rising category.
Regional Opportunities and Geographic Expansion Strategies

High-Growth Regions Driving the 5% CAGR
Asia-Pacific: The Fastest-Growing Market Segment
Rapid industrialization, large-scale water infrastructure buildouts, and expanding energy production make Asia-Pacific the single fastest-growing region for ultrasonic flow meters, according to multiple analyst reports including Mordor Intelligence. For distributors already operating there, this is a green light to expand product lines rather than diversify away from flow instrumentation.
North America and Europe: Mature Markets with Steady Demand
North America and Europe grow more slowly in percentage terms but remain high-value markets because of stringent regulatory compliance requirements (emissions monitoring, water loss reduction mandates) and a strong preference for retrofit-friendly, non-invasive solutions in aging infrastructure — a segment where clamp-on ultrasonic meters have a structural advantage over mechanical alternatives.
Emerging Markets: Untapped Opportunities for Aggressive Distributors
Latin America, the Middle East, and Africa represent the least saturated territories. Distributors willing to invest in local technical support and navigate less standardized regulatory environments can often secure exclusive or near-exclusive positioning with manufacturers looking to establish a first foothold in these regions.
Regional Demand Drivers and Industry-Specific Applications
Water and Wastewater Management Systems
Municipal utilities remain the single largest and most consistent demand driver globally, with district metering areas and non-revenue-water reduction programs requiring dense networks of flow meters — a topic covered in more depth in our guide to ultrasonic flow meter industrial applications.
Oil and Gas Production and Monitoring
Upstream and midstream operators use ultrasonic meters for custody transfer and pipeline monitoring, where accuracy, hazardous-area certification, and long-term stability without recalibration downtime are non-negotiable requirements.

Chemical Processing and Pharmaceutical Manufacturing
These verticals demand corrosion-resistant construction and precise batching accuracy, often paired with sanitary or hygienic design requirements for pharmaceutical-grade processes.
HVAC and District Heating Applications
Energy metering in district heating and cooling networks is one of the fastest-growing niches, since accurate BTU (British Thermal Unit — the standard unit for measuring thermal energy) billing depends directly on flow measurement accuracy.
Localization Strategies for Maximum Market Penetration
Understanding Regional Regulatory Requirements
Certification requirements vary widely — ATEX/IECEx for hazardous areas in Europe and the Middle East, different metrology traceability standards across Asia — and distributors who understand these requirements upfront close deals faster than those who discover certification gaps mid-negotiation.
Building Distribution Networks in High-Potential Markets
Successful geographic expansion typically starts with a single anchor customer or reference project in a new territory, then builds outward through referrals and local trade show presence rather than attempting broad simultaneous coverage.
Adapting Product Offerings to Regional Preferences
Some markets favor imperial pipe sizing and 4–20 mA analog signals; others expect metric sizing with Modbus or HART communication built in standard. Matching your stocked inventory to regional preference reduces custom order lead times and wins price-sensitive bids.
Technology Trends Shaping Market Demand
Why Ultrasonic Flow Meters Are Outpacing Competing Technologies
Non-Invasive Measurement Advantages
Clamp-on ultrasonic meters mount on the outside of an existing pipe with no cutting and no process shutdown, a capability mechanical meters (turbine, positive displacement) simply cannot match. This single advantage explains a large share of the category’s growth, since retrofit projects on live, pressurized pipelines are far more common than new-build projects. Our detailed comparison of clamp-on versus inline ultrasonic flow meters breaks down exactly where each design wins.
Digital Integration and IoT Connectivity Driving Adoption
IoT (Internet of Things) refers to physical devices — in this case, flow meters — that connect to the internet or a local network to transmit data automatically, without requiring someone to manually read a gauge. Customers increasingly expect flow meters to output data directly into SCADA or building management systems via Modbus, HART, or wireless protocols, and distributors who stock IoT-ready models close deals that pure analog-only inventory cannot touch.

Cost-Effectiveness vs. Traditional Flow Measurement Methods
Because ultrasonic meters have no moving parts, industry data consistently shows lower lifecycle maintenance costs — commonly cited at roughly 25% lower than mechanical meters over a comparable service life — which is a compelling total-cost-of-ownership argument distributors can bring into competitive bids against legacy mechanical suppliers.
Emerging Technologies That Will Define the 2028 Market
AI-Powered Diagnostics and Predictive Maintenance
Newer meter platforms increasingly embed diagnostic algorithms that flag signal degradation, coupling issues, or abnormal flow patterns before they cause a failed reading — shifting flow measurement from a passive record to an active maintenance signal.
Cloud-Based Data Analytics and Remote Monitoring
Multi-site operators now expect a single dashboard showing every meter across a distributed network, with automated alerts for no-flow, reverse-flow, or out-of-range conditions — a capability that turns a one-time equipment sale into an ongoing service relationship.
Integration with Industry 4.0 and Smart Manufacturing Systems
As manufacturing plants digitize broadly, flow data increasingly feeds directly into enterprise-level operational dashboards via OPC-UA (a standardized industrial communication protocol), meaning flow meters need to speak the same digital language as the rest of the plant floor.
This short video from RealPars provides a clear visual explanation of how ultrasonic transit-time and Doppler technologies actually work, which is a useful reference to share with customers who are new to the technology:
How to Position Your Product Portfolio Around Innovation Trends
Identifying Which Technologies Resonate with Your Customer Base
A municipal water customer cares most about IP68 submersible ratings and SCADA compatibility; an HVAC contractor cares about BACnet integration and compact form factor. Segmenting your product positioning by customer type, rather than pushing one generic pitch, shortens sales cycles measurably.
Upgrading Your Product Mix to Meet Future Demand
Distributors carrying only analog-output legacy models will increasingly lose bids to competitors stocking Modbus- and IoT-ready alternatives, even when the base measurement accuracy is comparable.
Communicating Technical Advantages to End-Users
Translating specification sheets into plain-language value (“no pipe cutting means zero production downtime during installation”) consistently outperforms leading with raw accuracy percentages when talking to procurement and operations stakeholders who are not flow measurement specialists.
Customer Segments and Vertical Market Opportunities

Primary Industries Driving Ultrasonic Flow Meter Adoption
Water Utilities and Municipal Infrastructure
This remains the anchor vertical for most distributors, characterized by long procurement cycles, strict compliance documentation, and multi-year framework contracts rather than one-off purchases.
Energy Sector (Oil, Gas, and Renewable Energy)
Custody transfer applications in oil and gas demand the highest accuracy tiers and full certification packages, while emerging renewable energy applications (geothermal, biomass) are creating smaller but growing niche demand.
Produção Química e Farmacêutica
Premium pricing is achievable here because specification requirements (corrosion resistance, hygienic design) narrow the competitive field to suppliers who can genuinely meet the material and certification bar.
Food and Beverage Processing
Sanitary, tri-clamp-compatible designs with CIP (Clean-in-Place) compatibility are the entry requirement for this vertical, which otherwise offers steady, recurring replacement demand tied to plant expansion cycles.
Pulp and Paper Industry
Harsh, particulate-heavy process streams in this vertical often favor Doppler-type ultrasonic technology over transit-time designs, making technology selection knowledge a genuine differentiator for distributors serving this space.
Secondary Growth Segments with High Potential
HVAC and Building Management Systems
Energy metering mandates in commercial buildings are pushing BTU meter demand upward, particularly in markets adopting stricter building energy codes.
Data Center Cooling Solutions
The explosive growth of data center construction has created a fast-growing niche for precise, low-maintenance flow measurement in chilled water loops, where unplanned downtime carries an extremely high cost.
Medical Device Manufacturing
Small-diameter, high-precision flow measurement demand is growing alongside medical device production volumes, typically requiring specialized, compact meter designs.
Food Service and Commercial Kitchen Operations
A smaller but steady niche exists in commercial kitchen and food service equipment monitoring, generally served by compact, lower-cost meter variants.
Vertical-Specific Sales Strategies for Distributors
Understanding Each Vertical’s Unique Pain Points
A water utility’s core pain point is non-revenue water loss; a chemical plant’s is corrosion-driven downtime. Leading a sales conversation with the specific pain point rather than a generic product pitch consistently improves conversion rates.
Developing Targeted Value Propositions
Documented case studies with real numbers — for example, a specific reduction in maintenance call-outs after switching from mechanical to ultrasonic metering — outperform generic quality claims in procurement conversations every time.
Building Industry-Specific Distribution Channels
Rather than one generalized sales team, higher-performing distributors typically develop small pods of application specialists aligned to two or three verticals, allowing deeper technical credibility per segment.
Competitive Landscape and Market Consolidation Trends
Major Players Shaping the Market and Their Strategies
Global Leaders and Their Market Share
The upper tier of the market remains dominated by a small number of established multinational instrumentation brands, but the mid-market — where most distributor relationships live — has room for manufacturers offering strong engineering support and competitive lead times, a positioning our team at Jade Ant Instruments has built specifically around.
Emerging Competitors and Disruptive Technologies
Newer entrants are competing increasingly on connectivity and total cost of ownership rather than headline accuracy specifications alone, since baseline accuracy across reputable manufacturers has largely converged for standard applications.
Strategic Partnerships and Acquisition Activity
Consolidation activity among manufacturers has been a recurring theme across the broader flow measurement industry, as documented in our comparison of leading flow meter manufacturers.
How Consolidation Affects Distributors and Agents
Opportunities Created by Market Consolidation
When a manufacturer is acquired or restructures its channel strategy, existing distributors of competing brands often get a window of opportunity to win over displaced accounts looking for stability.
Risks of Relying on Single-Supplier Relationships
Distributors who depend entirely on one manufacturer are exposed to that manufacturer’s pricing changes, allocation decisions, and channel strategy shifts — a risk worth actively managing rather than ignoring, as outlined in our article on common flow meter distributor mistakes.
Strategies for Maintaining Distributor Independence
Carrying complementary product lines from more than one manufacturer, while maintaining a primary partnership for volume pricing, gives distributors negotiating leverage and continuity if any single supplier relationship changes.
Differentiation Strategies in a Consolidating Market
Building Specialized Expertise and Certifications
Technical training and application-specific expertise (sizing calculations, installation troubleshooting) become more valuable, not less, as manufacturer-level consolidation reduces the number of brands competing on price alone.
Developing Strong Customer Relationships and Support Services
Consolidation tends to reduce the personal, responsive support smaller manufacturers historically provided — an opening for distributors who can offer faster local response times than a newly merged, larger organization.
Creating Value Beyond Product Supply
Offering commissioning support, calibration verification, and spare parts stocking creates switching costs that protect distributor relationships even when a competitor offers a marginally lower unit price.
Pricing Strategies and Margin Optimization
Understanding Price Dynamics in a Growing Market
How Market Expansion Affects Pricing Power
Growing demand generally supports firmer pricing than a flat or declining market, since customers face less risk of a supplier desperately discounting to move stagnant inventory.
Competitive Pricing Benchmarks Across Regions
Clamp-on ultrasonic meters for standard water applications typically range from roughly $1,000 for basic portable units to $6,000–$12,000 for high-accuracy fixed installations, while inline transit-time meters for higher-precision or custody-transfer applications commonly range from $3,000 to $15,000 or more depending on size and certification requirements — figures consistent with the ranges detailed in our ultrasonic water flow meter selection guide.
Premium vs. Value-Based Pricing Strategies
Premium pricing is defensible where certification, accuracy class, or hazardous-area approval genuinely narrows the field of qualified suppliers; commodity pricing pressure is strongest in standard, uncertified, low-accuracy applications where many suppliers can compete equally.
Margin Optimization for Distributors in the 2028 Market
Analyzing Your Current Margin Structure
Breaking down margin by product line, vertical, and account size typically reveals that a small number of accounts or SKUs generate a disproportionate share of gross profit — information that should directly shape where sales effort and inventory investment go next.
Strategies for Protecting Margins During Market Growth
Bundling installation guidance, calibration certificates, and after-sales support into the quoted price, rather than offering them free on request, protects margin without appearing to raise unit prices.
Value-Added Services That Command Premium Pricing
Site surveys, custom configuration, and remote commissioning support are all services customers will pay for when positioned correctly, particularly on larger or technically complex projects.
Managing Price Pressure from Consolidation and Competition
Negotiating Better Terms with Manufacturers
Volume commitments, longer-term purchase agreements, and demonstrated growth history are the strongest levers distributors have when negotiating better wholesale pricing or extended payment terms with manufacturers.
Passing Value to Customers Without Sacrificing Margins
Offering tiered service packages — basic supply-only versus supply-plus-commissioning — lets price-sensitive customers self-select into a lower tier while preserving full margin on customers who want full support.
Diversification Strategies to Reduce Pricing Pressure
Expanding into adjacent product categories (electromagnetic or vortex meters, covered in our vortex flow meter guide) reduces dependence on any single product line’s pricing dynamics.
Distribution Channel Strategy and Go-to-Market Approaches
Traditional Distribution Models and Their Evolution
Direct Sales to End-Users
Larger distributors increasingly maintain a direct sales function for strategic accounts alongside their broader channel business, capturing higher margins on accounts that justify dedicated attention.
Multi-Tier Distribution Networks
Sub-distribution arrangements allow a primary distributor to extend geographic reach through smaller regional partners without directly managing every local relationship.
Hybrid Models Combining Direct and Indirect Channels
Most successful mid-market distributors now run a hybrid model: direct relationships for named key accounts, and channel partners or resellers for long-tail geographic or vertical coverage.
Digital Transformation of Distribution Channels
E-Commerce Platforms for Flow Meter Sales
Standard, catalog-configuration products increasingly move through online ordering portals, freeing sales teams to focus on complex, consultative projects rather than routine reorders.
Digital Marketing and Lead Generation for B2B Distributors
Technical content — sizing guides, comparison articles, application case studies — consistently outperforms generic advertising for generating qualified B2B leads in this category, since buyers research extensively before contacting a supplier.
Virtual Technical Support and Remote Commissioning
Video-based commissioning support has become a practical way to serve customers in distant territories without the cost of an on-site visit for every installation.
Building Strategic Partnerships to Expand Market Reach
Manufacturer-Distributor Partnerships
The strongest distributor relationships involve two-way communication — distributors feeding field application data back to manufacturers, and manufacturers providing training and marketing support in return.
System Integrator and Consultant Relationships
Consulting engineers who specify equipment for large infrastructure projects are an underused lead source for many distributors; getting products listed in approved-manufacturer lists during the design phase pays off long before the bid stage.
Cross-Industry Partnerships and Channel Expansion
Partnering with complementary equipment suppliers (pump manufacturers, control valve suppliers) to offer bundled solutions expands reach into accounts that might not have sought out a flow meter supplier independently.
Geographic Expansion Strategies for Distributors
Identifying High-Potential Markets for Expansion
Combine regional infrastructure investment data with local industrial growth statistics to prioritize which new territories are worth the investment of entry.
Building Local Distribution Networks
A local technical presence — even a single application engineer — dramatically improves win rates in a new territory compared to serving it remotely from a distant office.
Managing Multi-Regional Operations Efficiently
Centralized inventory planning with regional fulfillment hubs balances the cost efficiency of centralized purchasing against the responsiveness customers expect locally.
Operational Excellence and Supply Chain Management
Inventory Management in a Growing, Dynamic Market
Demand Forecasting Based on 5% CAGR Projections
Applying your regional growth assumption directly to historical order volume by SKU gives a more defensible inventory plan than simply increasing stock levels uniformly across your catalog.
Optimal Inventory Levels by Product Category
Fast-moving standard sizes justify higher safety stock; large-diameter or highly customized configurations are usually better handled through defined lead times rather than speculative stocking.
Managing Obsolescence Risk in a Rapidly Evolving Market
As IoT-enabled models increasingly displace analog-only variants, distributors should periodically review slow-moving legacy inventory before it becomes difficult to sell at full margin.
Supply Chain Resilience and Risk Mitigation
Diversifying Supplier Relationships
Maintaining a secondary qualified supplier for critical product lines protects against allocation constraints or lead-time disruptions from any single manufacturer.
Managing Supply Chain Disruptions
Building buffer stock for long-lead-time custom configurations, rather than only standard catalog items, reduces the risk of losing time-sensitive projects.
Building Flexibility into Your Operations
Cross-training staff across product lines and maintaining flexible warehousing arrangements allows faster response when demand shifts unexpectedly between verticals or regions.
Technology Infrastructure for Distributor Operations
ERP Systems for Inventory and Order Management
Um ERP (Enterprise Resource Planning) system — software that integrates inventory, purchasing, and financials into one platform — becomes increasingly necessary once a distributor manages multiple product lines and warehouse locations.
CRM Solutions for Customer Relationship Management
A CRM (Customer Relationship Management) system tracks every customer interaction and quote history, which is essential for managing long B2B sales cycles that can stretch six months or longer for infrastructure projects.
Data Analytics Platforms for Business Intelligence
Reviewing win/loss data, quote-to-order conversion rates, and margin trends by product category on a regular cadence turns operational data into an active input for strategic decisions rather than a historical record.
Cost Structure Optimization
Reducing Operational Costs Without Sacrificing Quality
Consolidating shipments and negotiating freight rates based on annual volume commitments typically yields meaningful savings without touching product quality or customer service levels.
Automation Opportunities in Order Fulfillment
Automating routine reorder processing for standard catalog items frees staff time for the higher-value technical consultations that actually differentiate a distributor from an online-only competitor.
Logistics and Shipping Optimization
Matching shipping method (air freight, sea freight, or express courier) to project urgency, rather than defaulting to the fastest option, materially affects overall project profitability on larger orders.
Sales, Marketing, and Customer Acquisition Strategies
Developing a Comprehensive Go-to-Market Strategy
Identifying Your Ideal Customer Profile (ICP)
Um ICP (Ideal Customer Profile) defines the specific characteristics — industry, company size, purchasing authority, technical sophistication — of the accounts most likely to become profitable, long-term customers, and it should directly shape where marketing and sales effort is spent.
Creating Targeted Marketing Campaigns by Vertical
Generic “we sell flow meters” messaging consistently underperforms campaigns built around a specific vertical’s pain points, such as reducing non-revenue water loss for municipal utilities.
Measuring Marketing ROI in B2B Flow Meter Distribution
Tracking cost per qualified lead by channel and vertical, rather than only tracking total leads generated, reveals which marketing investments are actually producing sales-ready opportunities.
Building Brand Authority in the Ultrasonic Flow Meter Space
Thought Leadership Through Content Marketing
Publishing genuinely useful technical content — selection guides, comparison articles, application case studies — builds the kind of search visibility and credibility that a purely promotional website cannot achieve.
Industry Events, Conferences, and Trade Shows
Face-to-face presence at regional water, energy, and process industry trade shows remains one of the highest-converting channels for building the kind of trust that large infrastructure projects require.
Technical Certifications and Training Programs
Formal training certifications for sales and technical staff, sometimes provided directly by manufacturer partners, give customers concrete evidence of a distributor’s technical competence beyond marketing claims.
Sales Enablement and Team Development
Training Your Sales Team on Product Technical Details
Sales representatives who can confidently explain the difference between transit-time and Doppler technology — covered in depth in our clamp-on ultrasonic flow meter guide — close more technically complex deals than those relying purely on price and delivery time.
Developing Sales Collateral and Tools
Comparison charts, ROI calculators, and application-specific spec sheets shorten sales cycles by answering technical questions before they are even asked.
Compensation Structures That Drive Growth
Compensation plans weighted toward both revenue growth and margin quality (rather than revenue alone) discourage the kind of margin-eroding discounting that can undermine long-term profitability even during a growing market.
Customer Retention and Lifetime Value Optimization
Building Long-Term Relationships with Key Accounts
Regular technical check-ins with key accounts — reviewing meter performance, upcoming projects, and new product options — keep a distributor top of mind before a competitor gets the chance to.
Upselling and Cross-Selling Strategies
Customers who purchase ultrasonic flow meters for one application frequently have adjacent needs — electromagnetic meters for other process lines, or vortex meters for steam applications — that a well-timed conversation can surface.
Customer Success Programs and Support Excellence
Proactive outreach after installation, rather than only responding when something breaks, measurably improves both customer satisfaction scores and repeat purchase rates.
Strategic Planning and Roadmap Development for 2028
Assessing Your Current Position in the Market
Competitive Analysis and Benchmarking
Mapping your pricing, product range, and service offering against your top three regional competitors highlights specific gaps worth closing before committing to broader growth investments.
SWOT Analysis Specific to Your Distribution Business
A honest SWOT (Strengths, Weaknesses, Opportunities, Threats) analysis, revisited annually rather than once and forgotten, keeps strategic planning grounded in current market reality rather than outdated assumptions.
Financial Health and Growth Capacity Assessment
Growth investments — new hires, expanded inventory, new territory entry — should be sized against actual available working capital and financing capacity, not against the size of the market opportunity alone.
Setting Growth Targets Aligned with Market Projections
Realistic Revenue Growth Targets Based on 5% CAGR
Setting an annual revenue growth target modestly above the underlying market CAGR (for example, 7–8% when the market grows at 5%) reflects a realistic, share-gaining ambition rather than an arbitrary number disconnected from market reality.
Market Share Goals by Region and Vertical
Breaking a single overall growth target into specific share goals by region and vertical makes the target actionable for individual sales team members rather than an abstract company-wide number.
Profitability and Margin Targets
Revenue growth targets should always be paired with explicit gross margin targets, since revenue growth achieved through margin erosion is not the same as healthy business growth.
Building Your Strategic Roadmap Through 2028
Short-Term Actions (Next 12 Months)
Immediate priorities typically include auditing current inventory against IoT-connectivity demand, formalizing a vertical-specific sales approach, and reviewing manufacturer partnership terms.
Medium-Term Initiatives (1-2 Years)
Over one to two years, most growing distributors invest in a second geographic territory or a formal technical certification program for their sales team.
Long-Term Positioning (2-3+ Years)
Longer-term positioning often involves deepening vertical specialization to the point of being the recognized go-to distributor in one or two industries, rather than remaining a generalist across all verticals indefinitely.
Risk Management and Contingency Planning
Identifying Key Business Risks
Supplier concentration, key customer concentration, and currency exposure on international purchases are the three risks that most commonly derail otherwise well-run distribution businesses.
Developing Mitigation Strategies
Formal contingency plans — a backup supplier list, a currency hedging policy, a customer concentration ceiling — turn abstract risk awareness into concrete, actionable protection.
Building Organizational Resilience
Cross-training staff and documenting key processes reduces dependency on any single individual, protecting operational continuity through staff turnover or unexpected absences.
Measuring Success: KPIs and Performance Metrics
Revenue and Profitability Metrics
Track revenue growth rate against your CAGR-based target, plus gross and net margin by product line, on at least a quarterly basis.
Market Share and Growth Metrics
Estimate and re-estimate market share annually as regional market size data updates, rather than treating an initial estimate as permanently fixed.
Customer Satisfaction and Retention Metrics
Customer retention rate and net account growth (new customers minus churned customers) reveal whether growth is coming from a genuinely expanding customer base or simply larger orders from a shrinking one.
Operational Efficiency Metrics
KPI (Key Performance Indicator) metrics like inventory turns, order fulfillment time, and days sales outstanding (DSO) indicate whether operational capacity can actually support the growth targets set above.
The table below summarizes the core KPI categories worth tracking on a recurring basis:
| KPI Category | Example Metric | Recommended Review Frequency |
|---|---|---|
| Revenue Growth | YoY revenue growth vs. CAGR target | Quarterly |
| Margin Health | Gross margin by product line | Monthly |
| Market Position | Estimated regional market share | Annually |
| Customer Health | Retention rate, net account growth | Quarterly |
| Inventory Efficiency | Inventory turns by SKU category | Monthly |
| Cash Flow | Days Sales Outstanding (DSO) | Monthly |
| Sales Pipeline | Quote-to-order conversion rate | Monthly |
Taking Action in a $3.56B Opportunity
The Bottom Line: Why Acting Now Matters
Limited Window for Early-Mover Advantages
The distributors who build technical credibility, stocked inventory, and customer relationships during this expansion phase will be the default suppliers when the market matures — a position that becomes progressively harder to win once competitors have established themselves.
Long-Term Competitive Positioning
Positioning decisions made in the next 12–24 months — which verticals to specialize in, which manufacturer partnerships to deepen, which territories to enter — will materially shape competitive standing through 2028 and beyond.
Maximizing ROI on Strategic Investments
Every dollar invested in inventory, training, or new territory entry compounds more effectively in a growing market than in a flat one, simply because the underlying demand curve is working in the same direction as the investment.
Your Next Steps: Creating a 90-Day Action Plan
Immediate Priorities for Market Capture
Start with an honest audit: current product mix against connectivity trends, current vertical coverage against regional demand data, and current supplier relationships against the diversification guidance in Section 5.
Resource Allocation and Investment Decisions
Prioritize the one or two highest-confidence growth levers identified in that audit rather than attempting to act on every opportunity simultaneously — focused execution consistently outperforms diluted effort across too many initiatives.
Building Your Implementation Team
Assign clear ownership for each priority, with defined check-in points at 30, 60, and 90 days, so the plan survives beyond the initial planning meeting.
Partner With Us to Capitalize on Market Growth
Ready to position your distribution business for success in the growing ultrasonic flow meter market? The team at Instrumentos Jade Ant works directly with distributors and agents worldwide to develop winning strategies, competitive OEM/ODM arrangements, and application-specific product recommendations that help capture market share in this high-growth sector. Reach out today to discuss how we can help you build toward your 2028 growth targets.
Frequently Asked Questions (FAQs)
1. What is driving the growth in the ultrasonic flow meter market?
Growth is driven primarily by rising demand for non-invasive, accurate flow measurement across water utilities, energy production, and industrial manufacturing, combined with regulatory pressure for environmental and water-loss monitoring, the shift toward digital and IoT-enabled solutions, and the lower lifecycle cost of ultrasonic technology compared to mechanical alternatives. Growing infrastructure investment in developing regions and the broader move toward Industry 4.0 are additional accelerators.
2. Which regions offer the highest growth potential for distributors?
Asia-Pacific is consistently identified as the fastest-growing region, driven by rapid industrialization and water infrastructure development. North America and Europe maintain steady demand through infrastructure upgrades and regulatory compliance. Latin America, the Middle East, and Africa present less saturated opportunities for distributors willing to build local presence and navigate region-specific regulatory requirements.
3. How can I calculate my realistic addressable market and revenue potential?
Start with your current geographic footprint and active verticals, calculate your existing market share as a percentage of your regional market size, then apply a growth rate (a moderate 5% CAGR is a reasonable planning baseline) adjusted for your specific verticals. Modeling conservative (3%), moderate (5%), and aggressive (7–8%) scenarios gives your team a realistic planning range rather than a single number.
4. What are the most profitable verticals within the ultrasonic flow meter market?
Water utilities and municipal infrastructure offer stable, predictable, long-cycle demand. Oil and gas provides higher-value transactions with cyclical demand patterns. Chemical and pharmaceutical manufacturing supports premium pricing due to certification and material requirements. HVAC and district heating are emerging high-growth segments with comparatively less established competition.
5. How should I position my distribution business against larger, consolidated competitors?
Differentiate through specialized vertical expertise, responsive local support, and services beyond product supply — installation guidance, calibration verification, and predictive maintenance support. Building direct end-customer relationships and strategic partnerships with system integrators helps expand reach without competing purely on price against larger, consolidated suppliers.
6. What technology trends should I prioritize in my product portfolio?
Prioritize IoT-enabled meters with remote monitoring capability, models supporting Modbus, HART, or BACnet integration depending on your customer base, and products with documented diagnostic or predictive maintenance features. These capabilities increasingly determine which products win competitive bids, even when base accuracy specifications are similar across suppliers.
7. How can I effectively enter a new geographic market?
Research regional demand drivers, regulatory and certification requirements, and the existing competitive landscape before committing resources. A single anchor project or reference customer, combined with even a small local technical presence, dramatically improves early win rates compared to serving a new territory purely remotely.
8. What pricing strategy protects margins while remaining competitive?
Align pricing to total cost of ownership rather than unit price alone, differentiate pricing by application complexity and certification requirements, and bundle value-added services (installation support, training, calibration) into quoted pricing rather than offering them free. Regularly reviewing margin trends by product line prevents slow, unnoticed margin erosion.
9. How should I structure inventory to support a growing market?
Build demand forecasts using your regional growth assumption applied to historical order data by SKU, maintain higher safety stock on fast-moving standard configurations, and rely on defined lead times rather than speculative stocking for large-diameter or highly customized units. Reviewing slow-moving legacy inventory periodically prevents obsolescence losses as IoT-enabled models gain share.
10. What KPIs should I track to measure progress against market growth projections?
Track revenue growth against your CAGR-based target, gross and net margin by product line, estimated regional market share, customer retention and net account growth, inventory turns, and days sales outstanding. Reviewing these on a consistent monthly or quarterly cadence keeps strategic planning grounded in actual operating performance rather than assumptions.