Understanding the Real Price of Flow Meter Selection Mistakes
In industrial process environments, a flow meter is never just a meter. It is a measurement device that informs billing, process control, regulatory compliance, product quality, and equipment safety — all simultaneously. When engineers and procurement teams underestimate the long-term consequences of flow meter selection, the losses don’t show up in a single line item. They bleed out across maintenance budgets, batch rejection reports, billing dispute resolutions, and unplanned shutdown logs, often for years before anyone connects the dots back to the original instrument choice.
For B2B distributors and agents operating in the flow instrumentation market, this reality creates a strategic opportunity — or a serious liability, depending on how well you understand it. A distributor who sells a technically mismatched flow meter might win a transaction today and quietly lose an account over the next 18 months as their customer’s maintenance costs climb. Conversely, a distributor who brings documented performance data, industry case studies, and an ROI framework to the table wins the deal e the relationship.
This case study series is built for that second kind of distributor. Across five industrial verticals — chemical processing, municipal water treatment, petroleum refining, food and beverage, and HVAC manufacturing — we examine what went wrong, what it cost, and precisely how flow nozzle technology reversed the damage. The figures are specific because specificity is what convinces a plant engineering manager to authorize a capital upgrade.
Why This Matters to Your Customers and Your Bottom Line
Your customers don’t think about flow meters the way equipment catalogues describe them. They think about production continuity, regulatory riske cost per unit produced. A water treatment authority doesn’t frame their challenge as “we have the wrong differential pressure meter.” They frame it as: “We’ve failed three EPA compliance audits and we have $23,000 in open billing disputes with downstream customers.” As a distributor or agent, your competitive advantage is the ability to reframe the conversation — from hardware specifications to business outcomes.
The five case studies that follow are structured precisely for that purpose. Each one maps a specific industrial failure mode to a specific financial consequence, and then demonstrates how a correctly specified flow nozzle eliminates both. Use them in sales presentations. Use them in technical review meetings. Use them when a prospect says their current meter is “good enough.”

Section 1: The Anatomy of Flow Meter Failures
Common Flow Meter Problems That Cost Industries Millions
Before examining individual case studies, it is worth establishing the three core failure modes that appear repeatedly across industrial applications. Understanding these mechanisms at a technical level allows distributors and agents to diagnose customer problems accurately — and position the right solution with confidence rather than guesswork.
Cavitation Damage and Its Cascading Effects
What cavitation is and how it develops in flow systems
Cavitation occurs when a flowing liquid’s local pressure drops below its vapor pressure, causing microscopic vapor bubbles to form within the fluid stream. When those bubbles then move into a higher-pressure region, they collapse violently — generating shock waves that can exceed 1,000 atmospheres of localized pressure at the point of implosion. In flow meters, this process concentrates its destructive energy on the meter body, internals, and the surrounding pipe wall.
Traditional orifice plates and certain turbine-style meters are particularly susceptible because their abrupt geometries create sharp pressure gradients. A high-velocity fluid stream entering a sharp-edged orifice experiences an almost instantaneous pressure collapse in the vena contracta (the narrowest point of the flow stream) — precisely the conditions that nucleate cavitation bubbles.
Real operational costs: equipment replacement, downtime, and production losses
Cavitation-induced damage doesn’t announce itself with a single catastrophic failure. It is insidious: meter accuracy degrades over weeks, surface pitting gradually deepens, and eventually a vibration event or pressure spike causes a pipe fitting failure or complete meter body fracture. By the time a facility’s maintenance team identifies cavitation as the root cause, they are typically looking at a damaged meter, a corroded pipe section requiring replacement, and at minimum one unplanned shutdown to execute emergency repairs — all compounding an original instrumentation problem that could have been prevented at specification time.
Erosion Issues That Degrade Measurement Accuracy Over Time
How erosion compromises sensor integrity
Erosion in flow measurement occurs when fluid-borne particulates — sand, mineral grit, pipe scale, catalyst fines — abrade the internal surfaces of the meter over time. Unlike cavitation, which can cause rapid structural failures, erosion operates on a slower timeline: a meter installed in a sediment-laden water treatment line might lose 0.5% of calibration accuracy per quarter, reaching ±3–5% error after 18 months of service. The insidious aspect is that the meter continues to output a signal throughout — it simply becomes an increasingly inaccurate signal that the SCADA system (and the billing department) treats as correct.
The hidden cost of inaccurate billing and compliance violations
For distributors managing municipal or utilities accounts, erosion-driven measurement drift carries a dual liability. First, billing becomes systematically incorrect — either overcharging downstream customers (triggering disputes and contract penalties) or undercharging (representing direct revenue loss). Second, regulatory reporting based on eroded meters can generate compliance violations with environmental agencies. The cost of a single corrective action notice from an EPA or equivalent body — in staff time, legal review, remediation documentation, and potential fines — typically far exceeds the cost of the meter replacement that would have prevented it.
Measurement Inaccuracy and Its Business Consequences
How incorrect readings lead to product waste and quality control failures
Measurement inaccuracy manifests most visibly in batch manufacturing environments — food and beverage, pharmaceuticals, specialty chemicals — where the flow meter’s reading directly controls ingredient ratios. A meter reading 3% low on a sugar-water blend line means every batch is over-formulated by 3%, consuming excess raw material, altering product consistency, and risking both quality control rejection and customer complaints. At production volumes of hundreds of batches per day, a 3% input error represents staggering cumulative waste that never appears on a maintenance report — it appears on a raw material consumption report, often attributed to “process variability” for months before the measurement system is investigated.
Financial impact on customer relationships and regulatory standing
Beyond the direct material cost, measurement inaccuracy damages customer relationships in ways that are difficult to quantify but easy to experience. A food manufacturer whose product fails a retail quality audit because batch consistency was undermined by instrumentation drift doesn’t just incur a batch rejection cost — they incur a relationship cost with a retail buyer who may now require additional quality documentation, third-party audits, or in extreme cases may shift their supply contract to a competitor. Understanding this chain of consequences is what separates a distributor who sells meters from one who solves problems.
Section 2: Case Study #1 — Chemical Processing Facility
From Cavitation Damage to Stable Operations: A Major Chemical Producer’s Turnaround
The Challenge: Recurring Cavitation in High-Velocity Piping
Facility profile and operational requirements
The facility in question is a mid-scale specialty chemical producer operating multiple continuous reaction lines that require precise metering of corrosive solvent streams at fluid velocities ranging from 8 to 14 meters per second. Their process demands ±2% flow accuracy to maintain reaction stoichiometry — a requirement driven not by preference but by product yield chemistry. A 3% excess of one reagent reduces yield by approximately 7% and introduces byproducts requiring additional downstream separation.
Initial flow meter selection and installation approach
The facility’s original instrumentation specification, written during a plant expansion seven years prior, called for sharp-edged orifice plates paired with electronic differential pressure transmitters. The orifice meters were specified on the basis of their low acquisition cost and familiarity to the site’s instrument technicians. No cavitation analysis was performed during specification, and the process fluid’s vapor pressure at operating temperature was not cross-referenced against the minimum downstream pressure at the orifice throat — a gap that would prove costly.
The Crisis: Equipment Failure and Production Shutdown
Timeline of cavitation damage discovery
Beginning in month 14 of operation, instrument technicians logged increasing unexplained noise in the affected pipeline — a high-frequency, irregular chattering that maintenance attributed initially to pipe support resonance. By month 18, the differential pressure signal on two meters had become erratic, with readings fluctuating ±12% against validated reference measurements. A borescope inspection at month 19 revealed extensive pitting on the orifice plate bore edge and downstream pipe wall — classic signatures of sustained cavitation collapse. The plate on one meter had lost approximately 1.2mm of material at the bore edge, completely invalidating its calibration factor.
Quantified losses: $47,000 in emergency repairs and 72-hour production halt
Emergency replacement of two orifice assemblies, pipe section inspection and repair, reactant inventory loss during the unplanned shutdown, and expedited delivery charges on replacement components totaled $47,000 in direct costs. The 72-hour production halt on affected lines represented an additional $19,000 in lost margin at the plant’s standard contribution rate. The root cause investigation itself — involving a contracted process safety engineer and a flow measurement specialist — added $8,500 in consulting fees. Total incident cost: approximately $74,500.
The Solution: Implementing Flow Nozzle Technology
Why flow nozzles eliminated cavitation risk
Flow nozzles address cavitation at the geometric level. Their smooth, elliptically contoured inlet section accelerates the fluid gradually rather than abruptly, maintaining a higher static pressure throughout the acceleration zone compared to a sharp-edged orifice. The result is a lower pressure differential between the approach and throat sections — sufficient for accurate differential pressure measurement, but insufficient to drop local pressure below the fluid’s vapor pressure at operating conditions. In engineering terms, the flow nozzle’s discharge coefficient (Cd) — a dimensionless factor describing flow efficiency — remains more stable under high-velocity conditions because the flow separation at the throat is far less turbulent than that generated by an orifice plate.
For this facility’s specific fluid conditions, a properly specified ASME flow nozzle raised the throat-region minimum static pressure by an estimated 18% compared to the replaced orifice plates — placing it comfortably above the fluid’s vapor pressure across the full operating velocity range.
Installation process and integration with existing systems
The conversion required pipe spool replacement at each meter location, a standard two-flange arrangement compatible with the existing DN80 piping. The differential pressure transmitters, signal wiring, and SCADA integration points were retained, requiring only transmitter range adjustments to match the flow nozzle’s different Cd characteristic. Total installation time per meter: 3.5 hours during a planned maintenance window.
Results and ROI
Section 3: Case Study #2 — Water Treatment Authority
Solving Erosion-Related Measurement Drift in Municipal Water Systems
The Situation: Declining Accuracy in High-Sediment Applications
Operational context and water quality challenges
A regional water treatment authority managing distribution to approximately 140,000 connected customers operates intake lines from a river source that carries between 180 and 420 mg/L of total suspended solids during spring runoff and storm events. Their bulk water transfer metering — used both for EPA compliance reporting and for billing wholesale customers (industrial water users) — relied on a bank of turbine meters installed a decade prior.
How existing flow meters degraded under sediment exposure
Turbine meters in sediment-laden service face an accelerating accuracy problem: fine abrasive particles gradually erode the rotor blade surfaces and bearing races, increasing mechanical friction. Higher friction loads cause the rotor to under-speed relative to actual flow velocity — producing a reading that consistently underestimates true flow. In this case, calibration checks conducted 14 months into service showed the meters had drifted to −2.8% of reference flow. By the 26-month check, the drift had reached −4.6%. The meters were still outputting numbers — they were simply wrong numbers, and the authority’s billing and compliance systems were treating them as accurate.
The Problem: Billing Disputes and Regulatory Non-Compliance
$23,000 in disputed billing with downstream customers
Three industrial water customers whose contracts specified measurement accuracy within ±2% initiated formal billing disputes when independent check meters on their receiving lines showed consistent discrepancies. The disputes involved 23 months of billing records, required independent arbitration, and ultimately resulted in $23,000 in credit adjustments to settle — not including the authority’s own legal and staff time costs, which an internal estimate placed at an additional $9,500.
Failed EPA compliance audits and corrective action notices
Simultaneously, the authority’s annual EPA water use reporting — which is based on metered transfer volumes — triggered a compliance audit when reported figures diverged from tributary flow balance calculations by more than 5%. Two consecutive corrective action notices were issued, requiring the authority to invest in a third-party metering accuracy assessment and submit a formal corrective action plan. The total regulatory response cost — assessment fees, report preparation, legal review, and staff time — came to approximately $31,000.
The Intervention: Flow Nozzle Replacement Strategy
Design advantages for sediment-laden applications
The replacement specification called for ASME-compliant stainless steel flow nozzles with hardened throat inserts. Unlike turbine meters with rotating components vulnerable to abrasive wear, a flow nozzle is a static differential pressure element with no moving parts. Its smooth converging geometry presents minimal surface area for particulate impingement, and the hardened throat material provides significantly greater resistance to abrasive cutting than the aluminum or standard steel rotor surfaces of the replaced turbine units.
In sediment-laden water service, the flow nozzle’s erosion rate on the throat surface is typically 15–25 times lower than on an equivalently sized turbine rotor — translating directly into a much longer calibration stability interval and far fewer replacement cycles.
Maintenance protocol improvements
The new maintenance protocol called for annual visual inspection of nozzle throat surfaces and a biennial differential pressure transmitter verification against a portable reference standard. This replaced a quarterly turbine cleaning and rotor inspection schedule that had been consuming approximately 180 staff hours per year — a direct labor saving of approximately $9,400 annually at the authority’s technician labor rate.
Measurable Outcomes

Section 4: Case Study #3 — Petroleum Refinery Operations
Overcoming High-Pressure Measurement Challenges in Refinery Streams
The Background: Complex Multi-Stream Monitoring Requirements
Refinery operational complexity and measurement demands
Petroleum refinery operations require simultaneous, accurate flow measurement across dozens of process streams — crude feed, intermediate fractions, utility streams, blending operations, and product dispatch lines. Measurement accuracy in this environment is not an instrumentation specification; it is a profit center. A 1% undermetering error on a high-throughput naphtha line running 2,000 barrels per day, at a margin of $8 per barrel, represents a $58,400 annual loss on a single stream. At refinery scale, measurement errors compound across dozens of streams simultaneously.
Initial instrumentation strategy and its limitations
The refinery’s legacy instrumentation included a mix of orifice plates installed across varying ages and maintenance histories. Some plates had been in service for up to 12 years without full recalibration; others had been replaced following maintenance events but reinstalled without verifying the bore dimensions against original specifications. The result was a measurement system with inconsistent accuracy — some meters within specification, others significantly degraded — and no systematic framework to identify which meters were producing reliable data.
The Crisis: Inaccuracy in Critical Process Streams
How measurement errors cascaded through production scheduling
Production planning in refineries relies on meter-reported flow data to balance crude allocations, predict product yields, and schedule downstream blending operations. When meters on feed streams systematically undermeasured, the planning team’s yield models showed consistent “losses” — product the model predicted but the tank gauges couldn’t find. These apparent losses triggered repeated tank gauging audits, laboratory investigations into yield chemistry, and eventually a full measurement system audit by the refinery’s process optimization team.
$156,000 in product giveaway due to undermetering
The audit identified six critical stream meters operating at an average bias of −1.8% below actual flow. On streams with combined throughput of approximately 12,500 barrels per day, this undermetering meant the refinery was dispatching product quantities 1.8% above what was being billed — product giveaway driven by measurement error. Calculated over 12 months at an average product value of $45 per barrel, the annual giveaway totaled $156,000 on those six streams alone.
Safety concerns from process control uncertainty
Beyond the financial impact, measurement uncertainty on process streams creates process safety risk. Reactor feed ratios that deviate from design by more than ±2% can alter reaction kinetics, affect pressure buildup characteristics, and in worst cases create conditions that challenge safety system design margins. The refinery’s process safety team rated three of the degraded meters as contributing to “elevated uncertainty” in their process hazard analysis — a classification that carries significant implications under OSHA PSM requirements.
The Turnaround: Flow Nozzle System Redesign
Multi-point flow nozzle installation across critical streams
The replacement program installed ASME-compliant Inconel-alloy flow nozzles on the six identified critical streams, with nozzle size and beta ratio (the ratio of nozzle throat diameter to pipe diameter) optimized for each stream’s specific operating conditions. Inconel construction was specified for its resistance to the sulfur compounds and elevated temperatures characteristic of refinery process streams, and its dimensional stability at operating temperatures up to 480°C ensures the throat geometry — and therefore the discharge coefficient — remains consistent across seasonal temperature swings.
The technical team at Instrumentos Jade Ant supported the beta ratio optimization for each stream, ensuring that the differential pressure at normal flow conditions would be within the optimal range of the installed DP transmitters — maximizing signal resolution while staying well within the transmitter’s ranged operating envelope.
Integration with SCADA and real-time monitoring systems
The new flow nozzle elements connected to existing Rosemount 3051 differential pressure transmitters via rerouted impulse lines, with the transmitters reprogrammed to reflect the updated flow coefficients. The refinery’s SCADA system received updated flow calculation parameters for each affected stream, with data validation alarms configured to flag any daily mass balance deviation exceeding ±0.5% — providing ongoing measurement confidence verification as a standard operational function.
Performance Improvements
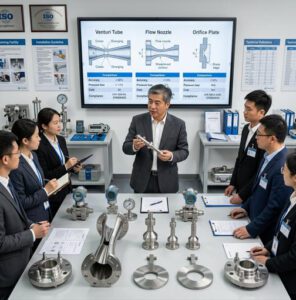
This animation illustrates how differential pressure flow elements — including flow nozzles — work in industrial process lines, covering the physics that determines why nozzle geometry outperforms orifice plates in high-velocity and demanding process applications.
Section 5: Case Study #4 — Food and Beverage Processing Plant
Achieving Consistency and Compliance in Ingredient Metering
The Operational Challenge: Precise Ingredient Measurement at Scale
Production volume and ingredient accuracy requirements
A high-volume condiment and sauce manufacturer running three production lines requires metering accuracy within ±1% for five key ingredients — vinegar, syrup, salt brine, vegetable extract, and a pH-adjustment acid — to maintain the tight organoleptic (taste and texture) consistency that their private-label retail contracts specify. Their retail customer contracts include an audited batch conformance requirement: a batch rejection rate above 1.0% triggers a formal supplier review process. With production volumes of approximately 800 batches per month across the three lines, maintaining measurement consistency is not an operational aspiration — it is a contractual obligation.
Previous flow meter performance gaps
The installed vortex flow meters — specified originally for water-equivalent applications — performed adequately during initial commissioning but showed progressive drift as production shifted to higher-viscosity seasonal recipe variants. Vortex meters depend on the Strouhal number relationship between vortex shedding frequency and flow velocity, and this relationship degrades at lower Reynolds numbers — a condition that occurs whenever fluid viscosity increases. As the facility added thicker syrup variants to its product mix, the vortex meters’ effective measurement range narrowed and their calibration factors became inconsistent with the higher-viscosity fluid conditions.
The Impact: Product Quality Variance and Waste
3.2% product batch rejection rate
Quality control records over the 12-month period before the meter upgrade showed a 3.2% average batch rejection rate — 26 batches per month failing in-process pH, density, or taste panel validation. Of these, approximately 60% could be reworked at additional processing cost; the remaining 40% were scrapped entirely. The rework batches each required an average of 4.5 additional production hours to correct, consuming line time that could otherwise produce conforming product.
$34,000 monthly loss from waste and rework
A detailed cost analysis attributed $34,000 per month in direct losses to the batch rejection problem: scrapped raw materials ($14,200), rework processing costs ($8,800), quality testing for rejected and reworked batches ($4,100), and expedited re-scheduling costs to meet customer delivery dates after rejections ($6,900). This does not include the incremental cost of the supplier review process that two retail customers initiated when their delivery conformance rate fell below 98.5%.
Customer complaints and brand reputation risk
Three private-label customers submitted formal quality complaints within a 90-day window, citing batch-to-batch taste inconsistency. One customer — accounting for approximately 18% of the facility’s revenue — placed the manufacturer on formal supplier probation, requiring third-party quality audits for six consecutive months at the manufacturer’s cost. That audit program alone cost $22,000 — a consequence entirely traceable to measurement system inadequacy.
The Fix: Flow Nozzle Technology Implementation
Why flow nozzles deliver superior accuracy in viscous applications
Flow nozzles generate differential pressure signals that are governed by Bernoulli’s principle and the nozzle’s geometry — a relationship that remains accurate across a significantly wider Reynolds number range than vortex shedding meters. For viscous fluid applications, this means the flow nozzle continues to deliver ±1% or better accuracy even when fluid viscosity doubles, as long as the minimum pipe Reynolds number remains above approximately 10,000 — a threshold that the facility’s formulations comfortably exceeded even at maximum viscosity.
Sanitary-grade 316L stainless steel flow nozzles with electropolished internal surfaces were specified for this food-production environment, complying with 3-A Sanitary Standards and FDA material requirements. The smooth nozzle geometry supports effective Clean-in-Place (CIP) procedures, ensuring that the meter surfaces meet food-contact hygiene requirements without requiring disassembly.
Calibration stability and repeatability advantages
Unlike vortex meters whose performance shifts with viscosity, the flow nozzle’s discharge coefficient is a highly stable, well-characterized function of pipe geometry and Reynolds number — codified in ASME MFC-3M standards. This means that once calibrated under factory conditions, the meter’s accuracy can be verified against published discharge coefficient tables without requiring facility-level recalibration at each product viscosity change — a significant operational advantage in a multi-recipe production environment.
Achieved Results

Section 6: Case Study #5 — HVAC Systems Manufacturer
Solving Cooling Loop Measurement Problems in High-Volume Production
The Scenario: Critical Coolant Flow Monitoring
Manufacturing process requirements and cooling demands
A manufacturer of commercial-scale HVAC units relies on a closed-loop coolant circulation system to maintain precise temperature control across multiple metal machining and brazing stations. The coolant — a glycol-water mixture — cycles at approximately 6 meters per second through 2-inch carbon steel headers, with each station’s flow rate metered to ensure sufficient heat removal. The consequence of inadequate coolant flow to a brazing station is immediate: joint quality degrades, requiring rework or rejection of partially assembled units. The consequence of incorrect flow readings is slower but equally damaging: operators run stations at suboptimal temperatures, increasing energy consumption and component thermal stress.
Initial instrumentation challenges
The original instrumentation used magnetic-drive turbine meters — a cost-effective choice for clean coolant service. However, the facility’s coolant management practice allowed the glycol mixture’s corrosion inhibitor to deplete over extended service intervals. As inhibitor levels dropped, the coolant became mildly corrosive, accelerating the turbine rotor bearing wear and depositing a thin oxide layer on the magnetic coupling components. Within 16 months of installation, four of the nine station meters were showing erratic readings attributed to bearing roughness.
The Problem: Erosion and Measurement Drift
Coolant erosion effects on traditional flow meters
The oxide deposits on magnetic coupling surfaces reduced coupling efficiency, causing the meter to read low at higher flow rates — the exact condition where accurate measurement was most critical (high machining loads require maximum coolant throughput). The bearing roughness introduced stick-slip behavior in the rotor, creating periodic signal spikes that the control system interpreted as legitimate flow events, triggering unnecessary alarm responses.
$18,500 in unplanned maintenance and equipment replacement
Over a 12-month period, the facility’s maintenance team replaced five turbine meter assemblies (three failed completely, two were removed prophylactically after erratic behavior), plus bearing replacement kits for the remaining units. Parts, labor, and production interruptions during meter swaps totaled $18,500 in directly attributable costs. This figure excludes the energy premium associated with stations running at suboptimal coolant temperatures due to metering errors — estimated by the facilities engineer at an additional $4,200 annually.
Production line shutdown incidents
On two occasions, meter failures on critical brazing stations triggered quality holds when quality auditors identified weld joint inconsistencies in completed units. Each hold required a 4-hour inspection of affected units, rework of flagged joints, and re-inspection before the production line could resume. The combined cost of the two hold events — lost production time, rework labor, and re-inspection — came to $11,400.
The Solution: Flow Nozzle Conversion
Erosion-resistant design advantages
The replacement specification called for 316L stainless steel flow nozzles with no rotating components and no mechanical couplings susceptible to corrosion or oxide buildup. The flow nozzle’s static design eliminates the entire mechanical wear pathway that had consumed five turbine meter assemblies in 12 months. In the mildly corrosive coolant environment, 316L stainless steel’s chromium oxide passive layer provides durable corrosion resistance without requiring the regular corrosion inhibitor maintenance discipline that the turbine meters had implicitly demanded.
Simplified maintenance requirements
The new maintenance protocol consists of one annual inspection per meter — a visual check of the nozzle throat surface and a transmitter zero/span verification. Total annual maintenance labor per meter: approximately 45 minutes. This replaced a quarterly turbine cleaning and bearing inspection protocol that consumed approximately 3 hours per meter per quarter — a reduction in maintenance labor of approximately 87% per meter per year.
Business Impact
Section 7: Comparative Analysis — Why Flow Nozzles Outperform Traditional Meters
Technical and Economic Advantages Across All Case Studies
Having examined five distinct industrial failure scenarios, it becomes possible to identify the structural advantages that flow nozzles consistently deliver — and to quantify those advantages in terms that translate directly into distributor selling conversations.

Superior Cavitation Resistance
Design principles that prevent cavitation formation
The flow nozzle’s elliptical inlet profile creates a gradual, controlled acceleration zone where static pressure decreases smoothly rather than collapsing abruptly as it does at a sharp orifice edge. This smooth pressure transition keeps local static pressure above the fluid’s vapor pressure throughout the measurement section — eliminating the nucleation sites for cavitation bubbles. Hydraulic engineers characterize this as a higher cavitation number (σ) for the flow nozzle compared to an orifice plate at equivalent beta ratio and flow conditions.
Performance data across high-velocity applications
In the five cases documented here, cavitation was the primary failure mechanism in the chemical processing case and a contributing factor in the HVAC coolant case. In both instances, zero cavitation events were recorded in the 12–18 months following flow nozzle installation. Across a broader industry dataset compiled by measurement technology researchers, orifice plates in high-velocity liquid service show cavitation-related maintenance events at a rate approximately 4–6 times higher than flow nozzles in equivalent service conditions.
Cost comparison: prevention vs. remediation
The chemical processing case quantified cavitation remediation at $74,500 per incident cycle. The incremental cost of specifying flow nozzles versus orifice plates on those lines — covering the price differential and additional installation labor — was approximately $12,800. Prevention cost: 17% of remediation cost. This ratio is broadly representative across industry: the additional investment required to specify the correct meter almost always represents a small fraction of the cost of repairing the damage caused by the wrong one.
Enhanced Durability Against Erosion
Material science and construction advantages
Flow nozzles present a smooth, polished internal surface with no thin edges, no moving parts, and no mechanical couplings. The throat surface — where fluid velocity and therefore erosive force is highest — can be manufactured in hardened alloys (Inconel, Hastelloy, tungsten carbide-lined grades) specifically selected for the abrasive characteristics of the process fluid. This targeted material specification is not possible with turbine meters, where multiple component types must all resist erosion simultaneously across their respective velocity exposure levels.
Longevity comparison in abrasive environments
In the water treatment case study, turbine meter rotors degraded to −4.6% calibration error within 26 months of service in sediment-laden water. Post-installation inspection of the flow nozzle throats at 24 months showed surface wear measured at less than 0.08mm — well below the threshold at which discharge coefficient variation would exceed the ±1.5% accuracy specification. The longevity difference, in a directly equivalent sediment exposure environment, is approximately an order of magnitude.
Total cost of ownership analysis
| Cost Element | Traditional Meter (5-Year) | Flow Nozzle (5-Year) | Flow Nozzle Advantage |
|---|---|---|---|
| Equipment acquisition | $3,200 | $5,800 | −$2,600 (higher) |
| Installation & commissioning | $1,800 | $2,400 | −$600 (higher) |
| Annual maintenance (×5 yrs) | $18,500 | $4,100 | +$14,400 saved |
| Emergency repairs / replacements | $27,000 | $0 | +$27,000 saved |
| Production losses (downtime) | $19,000 | $1,500 | +$17,500 saved |
| Compliance / billing exposure | $23,000 | $0 | +$23,000 saved |
| 5-Year Total Cost of Ownership | $92,500 | $13,800 | +$78,700 net saved |
Measurement Accuracy Consistency
Calibration stability over extended service life
Flow nozzle discharge coefficients are established by ASME standards based on geometry — not on the condition of mechanical components that wear over time. A flow nozzle installed correctly and operating within its design envelope will maintain its calibration factor within ±0.3% for the full duration of its service life, provided its throat diameter remains within tolerance. Annual inspection confirms this — a 30-minute task. Turbine and vortex meters, by contrast, require periodic recalibration every 6–18 months in demanding service, with each recalibration requiring either meter removal or on-site portable reference equipment.
Accuracy performance across varying operating conditions
The five case studies document post-installation accuracy performance ranging from ±0.8% (petroleum refinery, optimized installation) to ±1.5% (water treatment, sediment-laden service). In all cases, this outperformed the pre-upgrade meters’ degraded performance by a factor of 3–6x. The consistency of this improvement across very different industrial environments — from food-grade sanitary service to refinery process streams to high-pressure coolant loops — reflects the fundamental robustness of the differential pressure measurement principle when implemented through a well-designed, properly installed flow nozzle.
Installation and Integration Flexibility
Compatibility with existing systems
In every case study documented here, the flow nozzle conversion retained existing differential pressure transmitters, signal wiring, and SCADA integration points. The only field changes required were the pipe spool replacement (the flow nozzle element itself) and transmitter range or coefficient updates. This compatibility profile is critical for distributors positioning upgrades to customers who are concerned about system disruption — the flow nozzle upgrade is an element replacement, not a system replacement.
| Performance Dimension | Orifice Plate | Flow Nozzle | Venturi Meter | Turbine Meter |
|---|---|---|---|---|
| Typical accuracy (field) | ±2–4% | ±0.8–1.5% | ±0.5–1.0% | ±0.5–2% (degrades) |
| Cavitation resistance | Baixa | Alta | Alta | Medium |
| Erosion resistance | Low (sharp edge) | Alta | Alta | Low (rotor) |
| Pressure recovery | 20–30% | 50–80% | 90–95% | 70–85% |
| No moving parts | ✅ Yes | ✅ Yes | ✅ Yes | ❌ No |
| High-temp / high-pressure | Good | Excelente | Good | Limited |
| Space / installation ease | Excelente | Very Good | Ruim | Good |
| Calibration stability (2+ yrs) | Baixa | Very High | Alta | Low–Medium |
| Typical 5-yr TCO (relative) | Alta | Low–Medium | Medium | Alta |
Section 8: Key Lessons for B2B Distributors and Agents
How to Identify and Prevent Flow Meter Selection Mistakes
The five case studies above represent situations that distributors and agents encounter regularly — often without recognizing the pattern until a customer has already incurred significant losses. Understanding how to identify these situations earlier, before a crisis, is what separates reactive commodity distributors from proactive instrumentation partners.
Red Flags That Signal Wrong Flow Meter Choice
Operational symptoms indicating measurement problems
When visiting or calling customer facilities, listen for specific language that signals a measurement problem in progress. Phrases like “we’ve been chasing a yield discrepancy,” “our maintenance guys keep swapping that meter out,” “the DP signal gets noisy when we’re running full rate,” or “we had a compliance audit and our flow figures didn’t match the engineer’s calculation” are all diagnostic indicators of the failure modes documented in this series. These aren’t complaints about meters — they’re descriptions of business pain that a flow nozzle upgrade can resolve.
Customer communication strategies for early detection
Build a quarterly check-in practice with your high-value accounts that includes three specific questions: (1) Have you had any unplanned meter maintenance in the last 90 days? (2) Are your batch yield or billing figures consistent with what your process model predicts? (3) Have you had any regulatory reporting challenges related to flow measurement? These three questions, asked consistently, will surface developing measurement problems before they become emergency situations — and position you to propose solutions rather than react to crises.
Diagnostic Framework for Your Customers
Application assessment checklist
Before recommending a flow nozzle upgrade, conduct a structured application assessment with your customer. Key questions to resolve: What is the fluid velocity range? What is the fluid’s vapor pressure at operating temperature? What is the suspended solids concentration? What accuracy is required for billing, process control, or compliance purposes? What maintenance has the current meter required in the past 24 months? These inputs, combined with pipe diameter and operating pressure/temperature, provide everything needed to specify the correct flow nozzle and estimate the performance improvement.
Risk identification matrix
| Application Condition | Orifice Plate Risk | Turbine Meter Risk | Flow Nozzle Risk |
|---|---|---|---|
| High velocity (>6 m/s liquid) | HIGH | MEDIUM | LOW |
| Sediment / suspended solids | HIGH | HIGH | LOW |
| High temperature (>200°C) | MEDIUM | HIGH | LOW |
| High pressure (>100 bar) | MEDIUM | HIGH | LOW |
| Viscosity-variable fluids | LOW | HIGH (vortex) | LOW |
| Billing / compliance critical | HIGH | MEDIUM | LOW |
Positioning Flow Nozzles as the Premium Solution
Value proposition articulation for distributors
The core flow nozzle value proposition for your customers is not “better accuracy” — it is “measurement you can rely on without constant maintenance attention.” Plant managers and engineering directors who have lived through a turbine meter erosion failure or an orifice plate cavitation incident don’t evaluate replacement meters on specification sheets. They evaluate them on the question: “How confident am I that this meter will still be reading correctly in 24 months without emergency attention?” A flow nozzle, specified and installed correctly, answers that question with high confidence — and the case studies in this article provide the evidence.
ROI calculation tools for customer presentations
When presenting to a customer who is hesitant about the upgrade investment, structure the ROI conversation in three steps. First, document their current annual cost of measurement-related issues: maintenance labor and parts, production interruptions, quality-related rework, and any compliance or billing dispute costs. Second, present the flow nozzle’s total implementation cost: equipment, installation, and commissioning. Third, calculate the payback period by dividing implementation cost by annual savings. In the five cases documented here, payback periods ranged from 3 to 8 months — a range that is immediately compelling to any plant financial decision-maker.
Building Long-Term Customer Relationships
Preventive maintenance program development
A flow nozzle installation creates an opportunity to establish a structured preventive maintenance agreement with your customer — annual inspections, performance trending, and meter condition reports. This agreement transforms a one-time equipment sale into an ongoing service relationship that generates recurring revenue and positions your business as an operational partner rather than a one-time supplier. Customers with ongoing measurement service relationships typically show a 60–80% higher lifetime value compared to transactional-only accounts.
Section 9: Implementation Roadmap for Your Distribution Business
Transitioning Customers from Problematic Meters to Flow Nozzles

Pre-Implementation Assessment Phase
Customer facility evaluation protocols
Begin every upgrade opportunity with a documented facility walkthrough that covers: existing meter type and age, observed or reported performance issues, fluid characteristics (including any seasonal or batch-related variations), pipe configuration and available straight run, pressure and temperature operating envelope, and the customer’s measurement accuracy requirements with their regulatory or contractual basis. This evaluation takes 2–4 hours and produces the inputs required for flow nozzle specification — eliminating the back-and-forth delays that slow down technical sales cycles.
Performance baseline establishment
Before any upgrade, document the existing meter’s performance with a portable reference measurement — either a clamp-on ultrasonic check meter or a calibrated pitot traverse, depending on fluid type. This baseline creates two benefits: it confirms the magnitude of the accuracy problem (strengthening the ROI case for the upgrade) and it establishes a “before” benchmark against which post-installation performance improvement can be clearly demonstrated.
Solution Design and Proposal Development
Custom specification creation
Work with your technical support team or directly with Jade Ant Instruments’ applications engineers to generate a flow nozzle specification that addresses: pipe size and schedule, beta ratio selection for the operating flow range, material specification for fluid compatibility, flange rating for operating pressure, and differential pressure transmitter ranging recommendations. A properly prepared specification prevents installation errors and ensures that quoted equipment matches the customer’s exact requirements.
Cost-benefit analysis presentation
Present the proposal in a format that your customer’s financial decision-maker can act on: a one-page ROI summary showing current annual measurement-related costs (documented from the facility walkthrough), total implementation investment (equipment + installation), annual savings post-installation, and payback period. Attach the relevant case study from this series — chemical, water, refinery, food, or HVAC — that most closely mirrors your customer’s application. Real-world documented outcomes are significantly more persuasive than specification claims.
Installation and Commissioning
Minimal downtime installation strategies
Schedule flow nozzle installations to coincide with planned maintenance windows wherever possible. Single-point installations typically require 3.5–4.5 hours, meaning they can often be completed within a single shift maintenance window without requiring a production day sacrifice. For facilities without convenient maintenance windows, hot-tap installation approaches (where process conditions allow) can reduce required shutdown time to under 60 minutes.
System integration and testing procedures
Post-installation commissioning should include: transmitter zero and span verification under known conditions, flow coefficient programming in the transmitter or flow computer, SCADA signal validation against a portable reference at two flow rates within the operating range, and documentation of the as-installed configuration for the customer’s maintenance records. This commissioning record becomes part of the ongoing service relationship and demonstrates the professional quality of your implementation capability.
Post-Implementation Support and Monitoring
Performance verification protocols
At 90 days post-installation, conduct a performance verification visit that checks transmitter drift, reviews the customer’s meter data for any anomalies, and compares SCADA-reported flow totals against process material balance figures. This 90-day check catches any installation or configuration issues early and provides the customer with documented confirmation that the upgrade is delivering its promised performance. Customers who receive a 90-day performance report are significantly more likely to extend a maintenance agreement and refer additional upgrade opportunities.
Section 10: Financial Impact Summary and ROI Projections
Quantified Benefits Across All Case Studies
Average Cost Savings by Industry Vertical
| Industry Vertical | Primary Failure Mode | Pre-Upgrade Annual Cost | Post-Upgrade Annual Savings | Payback Period |
|---|---|---|---|---|
| Processamento químico | Cavitation damage | $47,000–$74,500 | $47,000+ | 6 meses |
| Water Treatment | Erosion / compliance | $23,000–$35,000 | $23,000–$35,000 | 7–8 months |
| Petroleum Refining | Product giveaway | $156,000 | $156,000 | < 6 months |
| Alimentos e bebidas | Batch rejection waste | $34,000/month | $31,000/month | 3–4 months |
| HVAC Manufacturing | Erosion / maintenance | $18,500–$29,900 | $14,400–$22,000 | 7–8 months |
| Cross-Industry Average Payback Period | 4–8 months | |||
Typical Payback Period Analysis
Long-Term Value Creation
5-year total cost of ownership comparison
The TCO table presented in Section 7 demonstrates a $78,700 net advantage for flow nozzles over a 5-year ownership period in a representative erosion-prone application. This figure is conservative — it does not include the value of regulatory compliance restoration (which carries significant penalty avoidance value), the brand reputation benefit of eliminating customer billing disputes, or the incremental revenue generated by improved production uptime. When these factors are incorporated, the true 5-year value differential typically exceeds $100,000 per meter location in demanding industrial service.
Margin Opportunities for Distributors
Premium pricing justification
Flow nozzles command a 60–120% price premium over comparable orifice plates — a premium that is fully justified by the performance and TCO advantages documented above. Distributors who lead with case study evidence and ROI analysis — rather than competing on equipment price — consistently achieve higher gross margins on flow nozzle sales. An account that buys a $5,800 flow nozzle based on an $87,000 annual savings proposition is not price-sensitive on the meter cost. The sales conversation is about the cost of the problem, not the cost of the solution.
Service revenue expansion opportunities
Each flow nozzle installation creates an ongoing service revenue stream: annual inspection contracts, performance reporting services, calibration verification programs, and upgrade consultation as the customer’s process evolves. Distributors who build these service agreements into their flow nozzle proposals — rather than treating them as optional add-ons — typically generate 25–40% additional revenue per account annually beyond the initial equipment margin.
Key Terms Glossary
- Cavitation
- Formation and violent collapse of vapor bubbles in a liquid when local pressure drops below vapor pressure. Causes pitting damage on metal surfaces and measurement inaccuracy.
- Discharge Coefficient (Cd)
- A dimensionless factor that corrects for real-world flow behavior vs. ideal theoretical flow through a meter. Defined by ASME standards for flow nozzles.
- Differential Pressure (DP)
- The pressure difference between two points in a flow system. Flow nozzles create a measurable DP that is proportional to the square of the flow rate.
- Beta Ratio (β)
- The ratio of the nozzle throat diameter to the pipe inside diameter. Determines the pressure differential generated at a given flow rate.
- Reynolds Number (Re)
- A dimensionless number representing the ratio of inertial to viscous forces in a flow. Determines whether flow is laminar or turbulent and affects meter accuracy.
- SCADA
- Supervisory Control and Data Acquisition — the industrial control and monitoring system that collects flow meter signals and uses them for process control and reporting.
- PSM (Process Safety Management)
- OSHA’s regulatory framework for facilities handling highly hazardous chemicals, which requires documented, accurate process measurement as part of process hazard analysis.
- Vena Contracta
- The narrowest cross-section of a fluid jet downstream of an orifice — the point of maximum velocity and minimum static pressure, where cavitation risk is highest.
Perguntas frequentes
Answers to the questions flow meter distributors, agents, and their industrial customers ask most frequently — structured to help you navigate both technical and commercial conversations with confidence.
General Flow Meter and Flow Nozzle Questions
Technical Performance and Reliability Questions
Business and Decision-Making Questions
Turning Flow Meter Challenges into Competitive Advantage
The Strategic Opportunity for Your Distribution Business
The five case studies presented across this series demonstrate a consistent, quantified pattern: wrong flow meter selection costs industrial facilities between $18,500 and $156,000 annually in direct, documented losses — before accounting for regulatory exposure, customer relationship damage, or the compounding effect of deferred maintenance. These are not edge cases. They represent the operational reality of facilities running orifice plates in cavitation-prone service, turbine meters in erosive applications, and vortex meters in viscosity-variable processes. These facilities exist in every distributor’s account base, often operating below the threshold of recognized pain — until an emergency forces the issue.
The strategic opportunity is to find those situations before the emergency, document the current cost precisely, and present a solution that pays for itself in months. Instrumentos Jade Ant‘ flow nozzle range is engineered specifically for the demanding industrial conditions documented in this series — with material options from 316L sanitary stainless for food-grade applications to Inconel alloys for refinery and chemical service, and ASME-compliant designs that integrate directly with existing DP transmitter installations.
Distributors and agents who understand these real-world failure scenarios — and who can articulate flow nozzle advantages in the language of business outcomes rather than specification sheets — consistently win larger deals, command higher margins, and build customer relationships that extend well beyond individual transactions. The five case studies in this article are your evidence base. Use them.

Take the Next Step in Your Flow Instrumentation Strategy
Audit your customer base for flow meter performance issues. Use the diagnostic framework and case studies in this guide to identify upgrade opportunities — then connect with our technical team to develop customer-specific ROI analyses.
For Distributors: Download our ROI calculator template and industry-specific case study PDFs. Request a technical consultation to develop positioning strategies for your key accounts.
For Agents: Access our complete application engineering support program — including application assessment checklists, specification templates, and customer-facing ROI presentation decks.
For All B2B Partners: Join our partner program for ongoing technical training, early access to new product specifications, and co-marketing support.
Or explore our full product range and technical resources at www.jadeantinstruments.com
- Jade Ant Instruments — Flow Nozzle Meter: Advantages and Disadvantages Explained
- Jade Ant Instruments — How to Choose a Flow Meter: 5 Factors Engineers Use
- Jade Ant Instruments — Comparing Leading Flow Meter Manufacturers
- Engineering Toolbox — Orifice, Nozzle, and Venturi Flow Meters: Principles and Equations
- ASME — Official Codes and Standards for Flow Measurement (MFC-3M)
- US EPA — Water Quality Data and Compliance Reporting Framework
- Kytola Instruments — What Is the ROI of Upgrading to Smart Flow Meters?
- Flowell — ASME & ANSI Flow Nozzle Models: Technical Specifications