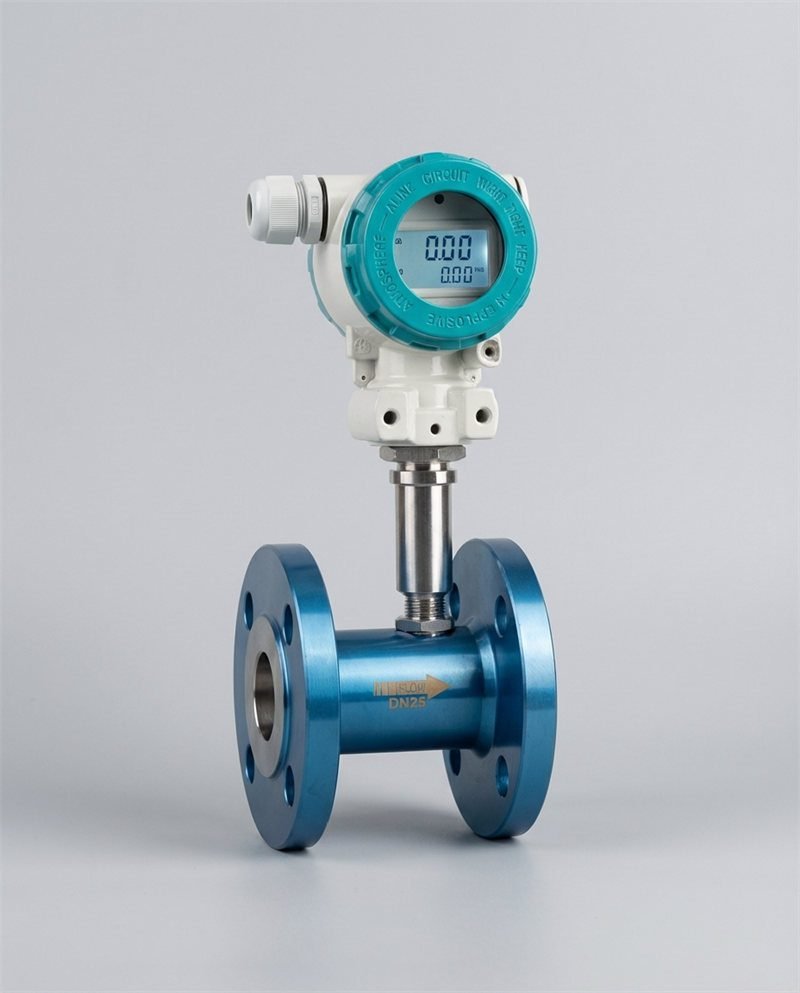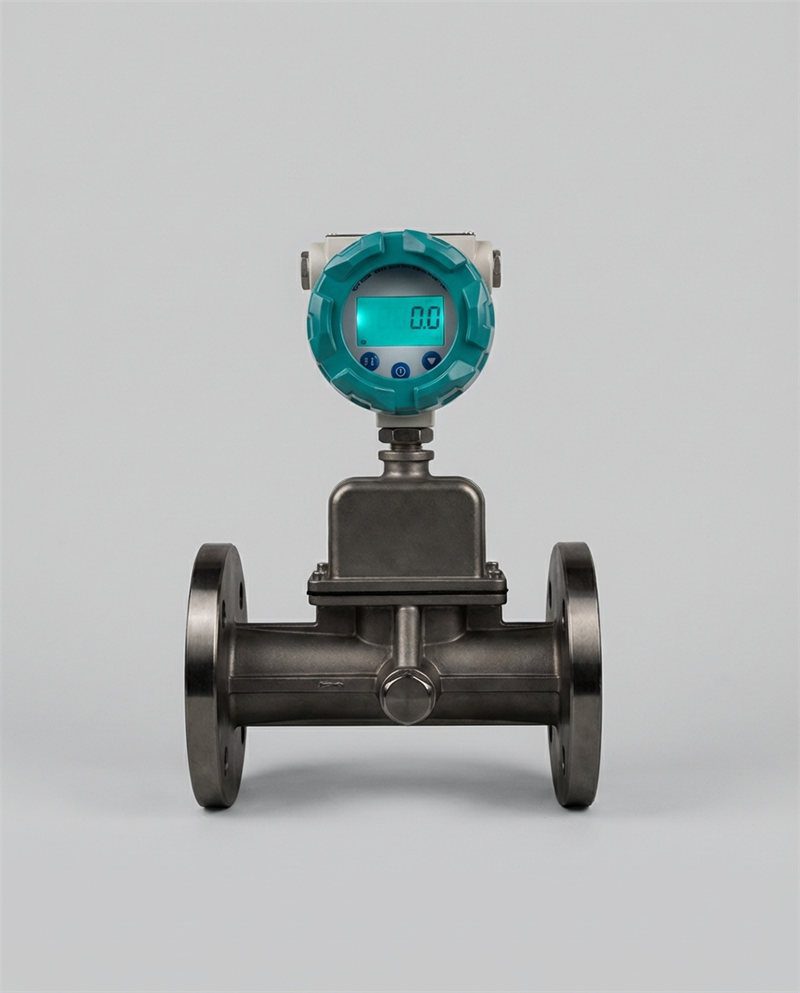
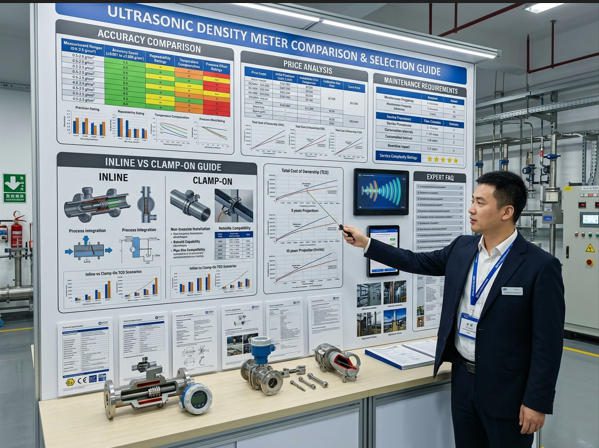

A structured, data-grounded comparison of ultrasonic density meter models — inline vs. clamp-on vs. portable — evaluated on measurement accuracy, total cost of ownership, maintenance burden, and integration requirements for engineers and procurement teams.
A 0.5% density measurement error on a crude oil custody transfer line handling 80,000 barrels per day translates to more than $160,000 in daily revenue discrepancy at current oil prices. In mining, a slurry density measurement drifting 2% off calibration in a thickener circuit can push solids recovery below target, costing $50,000–$100,000 per week in lost material. Yet in practice, the decision between an inline ultrasonic density meter at $8,000 and a clamp-on configuration at $2,500 is often made on unit price alone — without factoring in installation cost, calibration burden, or the actual accuracy each technology delivers in field conditions.
This guide resolves that gap. It compares ultrasonic density meter models across every dimension that matters for engineering and procurement decisions: operating principle, accuracy by model type, price (upfront and lifecycle), maintenance requirements, installation factors, calibration procedures, data quality capabilities, and real-world application fit. The global ultrasonic density meter market reached approximately USD $1.32 billion in 2025 and is projected to grow at 6.6% CAGR through 2035 — a trajectory driven by the move away from nuclear density gauges, rising demand for non-invasive measurement, and the expanding digitalization of process plants.
📘 Key Terms at a Glance
Overview of Ultrasonic Density Meters

An ultrasonic density meter determines fluid density by measuring the speed at which sound travels through the liquid — a principle that works from outside the pipe in clamp-on configurations, or with full direct-contact accuracy in inline configurations. The technology eliminates the radioactive sources and radiation safety compliance required by nuclear densitometers.
What They Measure and Basic Operating Principle
An ultrasonic density meter measures the acoustic properties of a liquid — specifically, how fast ultrasonic pulses travel through it — and converts that measurement into a density reading. The governing physical relationship is:
ρ = K / (SoS²) + C — where ρ is density, SoS is speed of sound, K and C are fluid-specific calibration constants
In practice, the meter fires an ultrasonic pulse between two transducers separated by a known path length. The time for the pulse to travel that path — the transit time — yields the speed of sound. Because SoS is a function of both fluid density and temperature, a high-precision temperature sensor (typically integrated into the probe or sensor body) provides the compensation needed to isolate density from thermal effects.
This principle is fundamentally different from — and complementary to — vibrating tube (Coriolis) density meters, which measure density from the resonant frequency of a vibrating tube containing the fluid. Coriolis delivers higher accuracy (±0.0001 g/cm³ vs. ±0.001 g/cm³ for ultrasonic) but requires full inline installation at higher cost and with higher pressure drop.
Common Configurations: Inline, Clamp-On, Portable
| Configuration | How It Works | Typical Density Accuracy | Instalação | Best Fit |
|---|---|---|---|---|
| Inline (Spool Piece) | Precision-machined flow body with wetted ultrasonic transducers; full direct acoustic contact with fluid | ±0.0005–0.001 g/cm³ | Requires pipe cutting; process shutdown; flanged installation | Custody transfer, high-accuracy concentration monitoring, fiscal metering |
| Clamp-On (External) | Transducers clamped to pipe exterior; signal passes through pipe wall then fluid; couplant required | ±0.001–0.005 g/cm³ | Non-invasive; no pipe cutting; hours to install | Process monitoring, retrofit, hazardous fluids, limited shutdown access |
| Insertion / Probe Type | Probe inserted through a fitting into the pipe interior; partial direct fluid contact | ±0.001–0.003 g/cm³ | Requires tapping; hot-tap option available; less invasive than full spool | Large pipes where spool replacement is impractical; slurry monitoring |
| Portable / Handheld | Battery-powered clamp-on unit; designed for survey, audit, and spot checks | ±0.001–0.010 g/cm³ | No permanent installation; clip on and read | Incoming material inspection, field surveys, multi-point audits |
Typical Industries and Process Applications
Ultrasonic density meters are deployed across a broad range of industries, each with distinct accuracy, process condition, and regulatory requirements:
- Oil & Gas: Crude oil density for custody transfer and API gravity determination; fuel oil blending; condensate quality control
- Chemical Processing: Acid and caustic concentration monitoring (H₂SO₄, NaOH, HCl); solvent purity; polymer blend ratio control
- Mining & Minerals: Slurry density in grinding circuits, thickeners, and tailings pipelines — the largest single application segment by volume
- Food & Beverage: Sugar brix measurement, beer/wort density, dairy fat content monitoring, fruit juice concentration
- Pharmaceutical: Active ingredient concentration in batch and continuous manufacturing; CIP solution strength monitoring
- Water & Wastewater: Sludge density in treatment plants; polymer dosing concentration verification
- Pulp & Paper: Black liquor density; pulp consistency monitoring
Accuracy Across Models
Factors That Influence Accuracy: Sound Speed, Temperature Compensation, Flow Profile
Ultrasonic density measurement accuracy is not a fixed specification — it is the product of several interacting factors that vary between model types, installation conditions, and fluid characteristics. Understanding these factors is the difference between selecting a meter that delivers its catalog specification in practice and one that systematically underperforms.
Temperature compensation is the single most critical accuracy factor. The speed of sound in a liquid changes by approximately 1–3 m/s per degree Celsius depending on the fluid. For water, SoS changes at roughly 2.4 m/s/°C near 20°C. On a typical 100 mm acoustic path, a 1°C temperature measurement error produces a density error of approximately 0.001 g/cm³ — equal to the total accuracy specification of a standard clamp-on meter. High-precision inline meters use Pt100 or Pt1000 temperature sensors with ±0.1°C accuracy and apply real-time compensation algorithms; clamp-on meters typically compensate at ±0.5–1.0°C accuracy, which is why their density accuracy floor is higher.
Pipe wall effects (clamp-on specific): In clamp-on configurations, the ultrasonic pulse must travel through the pipe wall before reaching the fluid. Wall thickness variation due to corrosion, scale deposits, or manufacturing tolerance introduces uncertainty in the calculated SoS. A 1 mm wall thickness error on a 10 mm carbon steel wall introduces approximately 0.5–1.5% error in the transit time measurement — directly translating to density error. This is why clamp-on meters require careful pipe wall characterization before installation and why their accuracy degrades over time on corroding pipes.
Flow profile effects: In inline meters with multiple transducer paths, the measurement is averaged across the pipe cross-section, reducing velocity-related density measurement errors. Single-path inline designs and clamp-on meters sample a chord through the pipe; asymmetric flow profiles (from elbows, pumps, or partial valve openings upstream) introduce a component of fluid velocity into the transit time that biases the density calculation. Minimum upstream straight pipe runs — typically 10D for clamp-on, 5D for inline — are specified to ensure fully developed flow at the measurement point.
Typical Accuracy Ranges by Model Type
| Tipo de medidor | Density Accuracy (g/cm³) | Temperature Accuracy | Repetibilidade | Measurement Range | Tempo de resposta |
|---|---|---|---|---|---|
| High-Precision Inline (e.g., Lonnmeter ultrasonic inline) |
±0.0005 g/cm³ | ±0.01°C | ±0.0002 g/cm³ | 0.5–2.5 g/cm³ | <100 ms |
| Standard Inline (Process-grade spool piece) |
±0.001 g/cm³ | ±0.05°C | ±0.0005 g/cm³ | 0.5–2.0 g/cm³ | <200 ms |
| Insertion / Probe (Large pipe / slurry) |
±0.001–0.003 g/cm³ | ±0.1°C | ±0.001 g/cm³ | 0.7–2.5 g/cm³ | <500 ms |
| Standard Clamp-On (fixed) (Non-invasive, clean liquid) |
±0.002–0.005 g/cm³ | ±0.2°C | ±0.001 g/cm³ | 0.6–1.8 g/cm³ | 1–3 s |
| Portable / Handheld (Survey and audit use) |
±0.003–0.010 g/cm³ | ±0.5°C | ±0.002 g/cm³ | 0.6–1.8 g/cm³ | 2–10 s |
| Coriolis Density (reference) (For accuracy benchmark) |
±0.0001 g/cm³ | ±0.5°C (separate) | ±0.00005 g/cm³ | 0.3–3.0 g/cm³ | <100 ms |
Bars proportionally scaled for visualization. All values in g/cm³. Source: compiled manufacturer datasheets (Lonnmeter, Rhosonics, Sensotech, 2024–2026).
How to Assess Metrological Traceability
Metrological traceability — the documented chain connecting a calibration to a national standard — is mandatory for fiscal metering, regulatory compliance, and ISO 9001 quality systems. For ultrasonic density meters, traceability is established through calibration against certified reference liquids (CRMs) of known density at known temperatures, with the calibration performed in a laboratory accredited to ISO/IEC 17025.
When evaluating vendors, request: the calibration certificate issued at factory (listing the CRMs used, their assigned uncertainties, and the accreditation body); evidence that the calibration laboratory is ISO/IEC 17025-accredited; and the combined measurement uncertainty at the application fluid’s density and temperature. A meter with a specification of ±0.001 g/cm³ but calibrated against a reference with uncertainty of ±0.002 g/cm³ cannot be traceable to better than ±0.002 g/cm³ — the reference uncertainty dominates.
Price Landscape

Price comparison between ultrasonic density meter models requires looking beyond the unit purchase cost. Installation (especially for inline models requiring pipe work), calibration, and service network costs can reverse the apparent cost advantage of cheaper meters within 2–3 years.
Upfront Acquisition Costs by Category
| Tipo de medidor | Typical Unit Price (USD) | Installation Cost Estimate | Total Installed Cost | Notas |
|---|---|---|---|---|
| High-Precision Inline (DN25–DN100) | $6,000–$18,000 | $2,500–$6,000 | $8,500–$24,000 | Includes pipe cut, flanges, gaskets, labor (2 techs, 1 day) |
| Standard Inline (DN25–DN150) | $3,000–$8,000 | $2,000–$5,000 | $5,000–$13,000 | Most common process monitoring configuration |
| Insertion / Probe (DN50–DN1000+) | $2,500–$7,000 | $800–$2,500 | $3,300–$9,500 | Hot-tap option adds $500–$1,200; no full process shutdown required |
| Clamp-On Fixed (DN25–DN300) | $1,800–$5,000 | $200–$800 | $2,000–$5,800 | Lowest total installed cost; no pipe work; 1 tech, 1–2 hours |
| Portable / Handheld | $1,500–$4,500 | $0 (no permanent install) | $1,500–$4,500 | Covers unlimited pipe sizes; shared across multiple points |
Total Cost of Ownership: Calibration, Maintenance, and Downtime
A clamp-on unit that costs $2,500 and a standard inline unit that costs $5,000 may converge or reverse in 5-year TCO, depending on calibration frequency, service access, and whether any downtime events occur. The chart below models a representative industrial installation:
Unit $2,500 + install $500 + 2× cal $1,200 + maint $1,000 + zero downtime cost.
Unit $5,000 + install $3,500 + 2× cal $1,600 + maint $1,700 + 1 downtime $4,000.
Unit $3,500 + install $1,500 + 2× cal $1,400 + maint $1,600 + partial downtime $2,000.
Unit $10,000 + install $4,500 + 3× cal $3,000 + maint $2,000. Justified only when accuracy drives direct financial outcome.
TCO estimates are illustrative for a single DN80 liquid process monitoring application in a mid-latitude industrial plant. Actual costs vary significantly by region, fluid type, and plant operating philosophy.
Cost-Benefit Considerations for Inline vs Clamp-On
The inline vs. clamp-on decision is not a question of which meter is better — it is a question of what accuracy is worth in your specific application. If the measured density directly determines product pricing, recipe correctness, or regulatory compliance, the additional accuracy of an inline meter generates measurable financial return. If density is monitored for trend awareness and process optimization, clamp-on accuracy is sufficient and the lower TCO delivers genuine value.
A practical rule: if a 0.001 g/cm³ density error in your application costs more than $3,000 per year in product give-away, off-spec batches, or compliance risk, the incremental cost of an inline meter over clamp-on pays back within 12–18 months. If the financial impact of that error is less than $1,000 per year, the clamp-on delivers better ROI. For teams navigating this calculation, Jade Ant Instruments’ process measurement selection guide provides a structured framework for matching measurement performance to process economics across flow and density applications.
🎬 How Ultrasonic Density Meters Work: Animation & Principle
This animation explains the ultrasonic density measurement principle — how transit time relates to fluid density, why temperature compensation is critical, and how inline and clamp-on configurations differ in their acoustic path design.
Video: Ultrasonic Density Meter Working Principle Animation — visualizing the relationship between sound speed, transit time, temperature compensation, and calculated density in both inline and clamp-on configurations.
Maintenance Requirements by Model
Routine Calibration Intervals and Procedures
Ultrasonic density meters, like all measurement instruments, require periodic calibration verification to confirm that readings remain within specification. Unlike mechanical meters with moving parts, ultrasonic sensors have no wear mechanisms that systematically degrade accuracy — but temperature sensor drift, acoustic couplant degradation (clamp-on), and surface fouling on wetted sensors (inline) can all cause calibration offset over time.
| Tipo de medidor | Recommended Calibration Interval | Calibration Method | Can Calibrate In-Situ? | Downtime Required? |
|---|---|---|---|---|
| High-Precision Inline | 12 months (fiscal); 24 months (process) | Certified reference liquid; ISO/IEC 17025 lab or on-site with CRM | Partial (zero and span check); full calibration requires removal | Yes — for removal; bypass valve eliminates shutdown |
| Standard Inline | 12-24 meses | Reference liquid comparison; or in-situ with sampled fluid vs. lab density | Yes — in-situ spot check possible; formal recal requires lab | Partial — in-situ check requires no shutdown |
| Insertion / Probe | 12-24 meses | Pull-out and bench calibrate, or in-situ comparison with lab sample | Yes — in-situ comparison check | Minimal — probe can be retracted under pressure if retrieval fitting installed |
| Clamp-On Fixed | 12 a 18 meses | In-situ comparison: simultaneous lab sample vs. meter reading; or portable reference meter | Yes — no removal needed | Nenhum |
| Portable | 12 meses | Factory or ISO 17025-accredited lab calibration | No — return to lab or factory | None (unit taken offline; spare portable used) |
Parts, Consumables, and Service Needs
The maintenance consumables profile of ultrasonic density meters is one of their strongest competitive advantages compared to alternative technologies. Nuclear density gauges require periodic source replacement and radiation safety inspections. Vibrating tube density meters require sensor tube cleaning and occasional tube replacement in abrasive or corrosive service. Ultrasonic meters’ maintenance requirements are limited primarily to:
✅ Inline / Insertion — Typical Maintenance Items
- Transducer face inspection (fouling, scaling, abrasion) — annually
- Temperature sensor (Pt100/Pt1000) calibration check — annually
- Gasket/O-ring inspection at flanged connections — annually
- Signal cable and connector integrity check — annually
- Wetted surface cleaning if fouling detected (CIP or manual) — as needed
- Firmware update check — annually
✅ Clamp-On — Typical Maintenance Items
- Acoustic couplant condition check and replenishment — every 12–18 months
- Transducer mounting integrity (strap tension, alignment) — every 12 months
- Signal quality (Q-value) monitoring — continuous or monthly logging
- Pipe wall re-characterization if corrosion is progressive — every 2–3 years
- Temperature sensor calibration check — annually
- Firmware and gas database update — annually
Spare Parts Availability and Service Networks
For inline ultrasonic density meters, the critical spare components are: replacement transducers (matched pair for the specific spool piece geometry), temperature sensors, and transmitter/electronics units. Major brands maintain regional service centers with spare parts stock and 24–48 hour delivery times for critical components. For smaller or emerging-market manufacturers, confirm spare part availability and lead times explicitly before procurement — a $5,000 meter with a 12-week lead time for replacement transducers is not a cost-effective choice for a continuous production plant.
Clamp-on meters benefit from simpler spare parts requirements: transducer assemblies are universal across pipe sizes (within the model range), couplant is an off-the-shelf consumable, and electronics are fully replaceable without any pipe work. This makes the clamp-on supply chain materially more resilient in remote plant locations or developing-market applications. For procurement teams evaluating supplier capability, the supplier qualification framework from Jade Ant Instruments covers spare parts commitment, lead time SLAs, and technical support response criteria that apply equally to density meter procurement.
Installation and Integration

Successful density meter installation begins with a thorough pipe site survey — confirming pipe material, wall thickness, fluid conditions, available straight runs, and vibration environment before selecting the meter configuration and transducer mounting location.
Site and Pipe Considerations for Accurate Measurements
The installation location has a larger impact on measurement accuracy than any other single variable — particularly for clamp-on configurations. An ideal installation site satisfies four criteria simultaneously: the pipe is always completely full of liquid; there is adequate straight pipe run upstream and downstream; the pipe is free from significant corrosion, scale, or lining variation; and the location is accessible for routine maintenance and signal quality checks.
Electrical Data Interfaces and Control System Integration (SCADA/ERP)
Modern ultrasonic density meters support a full range of industrial communication interfaces. The choice of output protocol determines not just data transmission but the depth of diagnostic and configuration access available from the control room:
| Interface | Data Available | Typical Integration Target | Diagnostic Access | Notas |
|---|---|---|---|---|
| 4–20 mA (analog) | Density only (one variable per loop) | DCS, PLC analog input card | Nenhum | Universal; most DCS-compatible; no remote config |
| HART (over 4–20 mA) | Density + temperature + diagnostics overlay on analog signal | Asset management systems (AMS, Pactware) | Full HART DD diagnostics | No additional cable; enables remote config and health check |
| Modbus RTU (RS-485) | All measurement variables + status registers | SCADA, PLC, data loggers | Full parameter read/write | Most cost-effective digital option; up to 32 devices per segment |
| PROFIBUS DP/PA | Full measurement + configuration + diagnostics | Siemens/ABB process DCS | Full fielbus diagnostics | Standard in European process plants; requires PROFIBUS master |
| Modbus TCP / EtherNet/IP | Full variables; high-speed (100 ms update); remote access | Industry 4.0 platforms, cloud SCADA, ERP integration | Full + trending | Emerging standard; enables direct historian connection |
For plants pursuing digital transformation goals — connecting field instruments to MES (Manufacturing Execution Systems), ERP (SAP, Oracle), or cloud analytics — Modbus TCP and EtherNet/IP interfaces are increasingly preferred because they enable direct data historian integration without OPC server middleware. For ISO-certified manufacturers like Jade Ant Instruments, multi-protocol output (4–20 mA + HART + Modbus RTU) is standard on their process meter product lines, providing integration flexibility across both legacy DCS and modern digital plant architectures.
Calibration and Traceability
Standards, Calibration Methods, and Documentation
Calibration of ultrasonic density meters should be performed against certified reference materials (CRMs) — liquids with density certified to national standards with stated measurement uncertainty, typically supplied by national metrology institutes (NIST in the USA, PTB in Germany, NPL in the UK, NIM in China) or accredited private laboratories.
The standard calibration procedure for an ultrasonic density meter involves:
- Stabilizing the meter at the calibration temperature (typically 20°C or the process operating temperature)
- Filling the measurement cell or flow path with each CRM in sequence (typically 3–5 reference liquids spanning the expected density range)
- Recording the meter reading for each CRM and comparing against the certified value
- Calculating the as-found deviation at each point
- Adjusting the meter’s calibration constants if any point exceeds the specified tolerance
- Verifying as-left readings meet specification
- Issuing a calibration certificate per ISO/IEC 17025 requirements
Field vs. Lab Calibration Practices
| Calibration Method | Where Performed | Accuracy Achievable | Cost per Event | Melhor para |
|---|---|---|---|---|
| ISO 17025 lab calibration | Accredited calibration laboratory | Full spec ±0.0005–0.001 g/cm³ | $400–$1,200 | Fiscal metering, GMP pharma, initial qualification |
| In-situ with CRM | Plant site using portable CRM liquid | ±0.001–0.002 g/cm³ | $150–$600 (labor + CRM) | Annual verification for process meters; avoids removal |
| Sample comparison method | Plant site — compare meter vs. lab-analyzed sample | ±0.002–0.005 g/cm³ (limited by lab method) | $50–$200 (lab analysis cost) | Routine process monitoring checks; trending early drift detection |
| Factory recalibration | Manufacturer’s calibration facility | Full spec + full uncertainty budget | $600–$2,000 + shipping | After significant repair, process fluid change, or failed in-situ check |
Environmental and Installation Factors
Temperature, Pressure, Vibration, and Fouling Effects
Environmental conditions at the installation site interact with ultrasonic density meter performance in ways that are predictable — and therefore manageable — if understood before installation. The table below maps each environmental factor to its effect and the standard mitigation approach:
| Environmental Factor | Effect on Measurement | More Severe For | Mitigation |
|---|---|---|---|
| Temperature variation | SoS changes with temperature — uncompensated ΔT of 1°C = ~0.001 g/cm³ error in water | Clamp-on (external thermal gradient); high-precision inline | Integrated Pt100 with ±0.1°C accuracy; thermal insulation at sensor; stable process temperature |
| Process pressure variation | Pressure affects fluid compressibility and therefore SoS; effect is small for liquids but measurable | High-precision custody-transfer inline meters | Pressure compensation algorithm; rated pressure sensor for high-accuracy models |
| Mechanical vibration | Corrupts ultrasonic signal; causes false spikes; may shift zero point | Both; clamp-on more sensitive due to external mounting | Select pipe section away from vibrating equipment; vibration isolation mount; transmitter vibration filter |
| Internal pipe fouling (scale, deposits) | Inline: sensor face deposits reduce signal; Clamp-on: pipe wall build-up changes effective wall thickness | Inline in scaling services; clamp-on in corroding pipe | CIP-capable inline design; periodic signal quality monitoring; re-characterize pipe wall annually |
| Entrained gas / bubbles | Gas bubbles scatter ultrasonic signal, causing erratic readings or complete signal loss | Both; clamp-on more affected | Install at low point on piping; upstream deaerator; avoid pump suction side |
| Electromagnetic interference (EMI) | Signal noise on measurement electronics; erratic output readings | Clamp-on (external electronics closer to sources) | Shielded cable; single-point grounding; separate from power conduit; EMI filter on transmitter input |
Maintenance Access and Environmental Protection
For inline meters in harsh environments — offshore platforms, chemical plants with aggressive vapor atmospheres, outdoor installations in temperature-extreme climates — the transmitter enclosure rating (IP67 minimum; IP68 for submersible; Ex-d or Ex-ia for ATEX hazardous areas) must be specified to match the installation environment. A common field failure mode is moisture ingress into the transmitter enclosure, which causes progressive corrosion of the circuit board and manifests as intermittent output noise before causing permanent failure. Specifying IP68-rated enclosures in any location where wash-down, flooding, or condensation is possible adds $200–$500 to the unit cost and eliminates a failure mode that typically costs $1,500–$3,000 to repair (electronics replacement plus labor).
Data Quality and Diagnostics
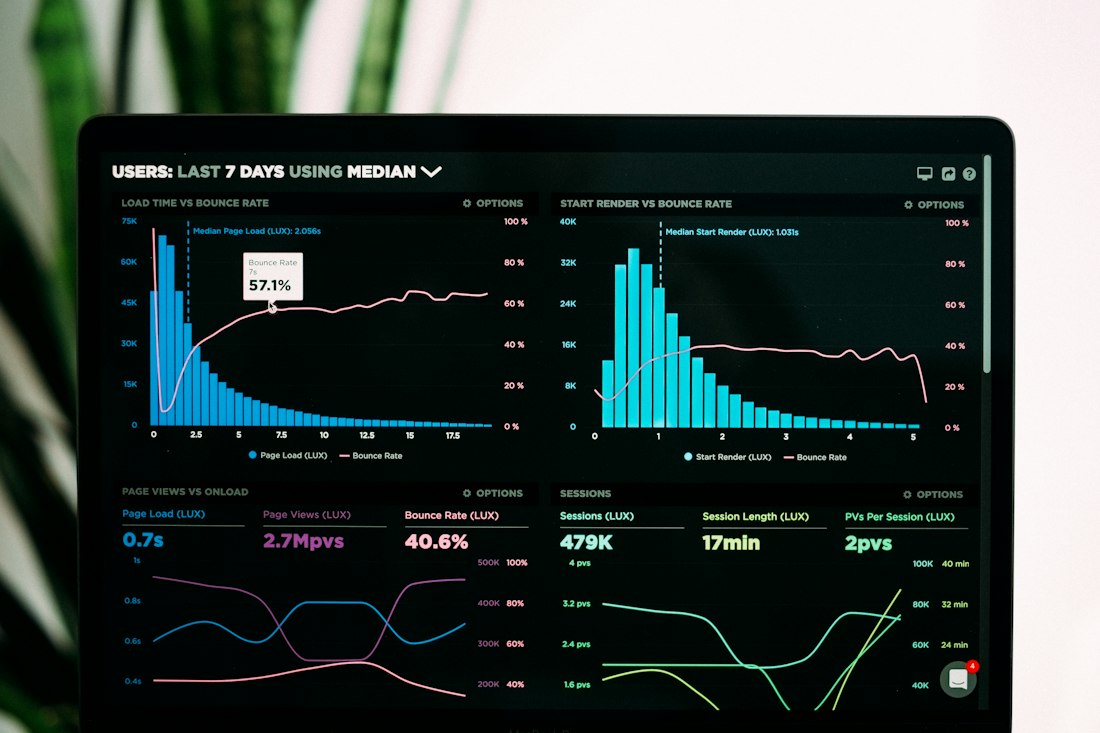
Modern ultrasonic density transmitters continuously generate diagnostic data — signal quality trends, temperature sensor health, and acoustic path integrity indicators — that can be fed into SCADA historian databases and used to detect calibration drift months before it exceeds specification.
Diagnostics Features: Self-Checks, Diagnostic Alarms, and Trends
Premium ultrasonic density meters continuously self-monitor their measurement integrity and report health status alongside the density reading. These diagnostics fall into three categories that together enable a condition-based maintenance approach:
- Signal quality monitoring (Q-value / AGC level): Continuously measures how strongly the ultrasonic pulse is received relative to the transmitted signal. Declining Q-value over time indicates fouling, couplant degradation, or transducer deterioration — identifiable before density accuracy degrades. A Q-value trend dropping from 85% to 60% over six months gives maintenance teams weeks to plan proactive intervention.
- Temperature sensor health check: Monitors the integrity of the integrated temperature sensor, comparing readings against expected ranges and flagging anomalies. Temperature sensor failure is the most common cause of systematic density measurement error — detecting it early prevents silent calibration drift.
- Acoustic path integrity diagnostics: Inline meters with multiple acoustic paths compare readings across paths to detect asymmetric flow, partial fouling, or localized transducer degradation. Any single-path reading that deviates by more than a configured threshold from the mean triggers a diagnostic alarm.
- Process condition alarms: Configurable alarms for density out-of-range, temperature out-of-range, concentration above/below setpoint, and entrained gas detection (when signal attenuation indicates bubble content).
Data Integrity, Logging, and Reporting Capabilities
For applications in regulated industries — pharmaceutical GMP, oil and gas custody transfer, environmental monitoring — the meter’s data logging and audit trail capabilities are as important as its measurement accuracy. Key requirements include:
- Tamper-evident data logs: Internal non-volatile memory storing timestamped measurement records with electronic signature (for FDA 21 CFR Part 11 compliance)
- Configuration change log: Every change to calibration constants, alarm setpoints, or communication settings recorded with date, time, and (in advanced models) user ID
- Calibration history storage: Previous as-found/as-left calibration records stored onboard and accessible via digital interface
- Data export formats: CSV for process historians; PDF certificates for quality systems; XML for ERP integration
Case Studies: Choosing Between Models
Inline Meters for Continuous Process Control vs Clamp-On for Retrofit or Limited Access
Budget-Conscious Projects vs High-Precision Requirements
For a water treatment plant needing sludge density monitoring across 20 thickener underflow lines, a budget-conscious procurement will typically specify clamp-on or insertion meters at $2,000–$3,500 per point — achieving ±0.002–0.005 g/cm³ accuracy that is entirely adequate for thickener control purposes. For a pharmaceutical plant where API concentration in a crystallizer must be maintained within ±0.0005 g/cm³ to ensure polymorph purity, only a high-precision inline meter with certified CRM calibration delivers the required performance — and the $15,000–$20,000 per-point cost is justified by the $50,000–$500,000 value of each controlled batch.
A structured TCO analysis that places a financial value on the accuracy improvement is the most defensible procurement tool for high-value applications. For process monitoring and utility-grade density, specifying to the accuracy actually required — not the maximum available — delivers the best lifecycle economics.
Future Trends and Best Practices
AI-Assisted Data Analysis and Remote Monitoring
The integration of AI and machine learning into ultrasonic density measurement platforms is moving from R&D to commercial deployment. Leading manufacturers are embedding anomaly detection algorithms into transmitter firmware that continuously compare current measurement patterns — signal quality trends, temperature correlation, flow velocity response — against baseline profiles established during commissioning. Deviations from the baseline trigger predictive alerts before measurement accuracy degrades.
In one documented implementation, a European chemical plant deployed a cloud-connected inline ultrasonic density measurement network across 24 process lines. The AI anomaly detection algorithm flagged a progressive decrease in acoustic signal quality on three meters four months before any of them reached out-of-specification territory — allowing the maintenance team to schedule sensor cleaning during a planned outage rather than responding to a measurement failure during production. Estimated savings: three unplanned outages avoided, valued at approximately €45,000 in combined production continuity and emergency maintenance costs.
Remote monitoring via OPC UA and cloud-native data pipelines allows instrument engineering teams to monitor entire density meter fleets from centralized control facilities — a capability especially valuable for multi-site operations where instrument specialists cannot be present at every plant continuously. The density meter market growth forecast to $1.42 billion by 2031 is substantially driven by these digital capabilities rather than hardware commodity growth alone.
Predictive Maintenance and OEM Support Strategies
Predictive maintenance for ultrasonic density meters relies on three data streams: continuous signal quality trending, periodic calibration comparison data (as-found readings at each calibration event), and process condition logs (temperature excursions, high-vibration events, flow interruptions). Together, these data streams enable the transition from calendar-based maintenance scheduling to condition-based maintenance — calibrating when the data indicates drift is approaching the tolerance limit, not simply when the annual calendar date arrives.
OEM support strategies for density meter fleets are evolving toward subscription service models: a fixed annual fee covering all calibration events, priority spare parts access, firmware updates, and remote diagnostic monitoring. For plants with large installed fleets (50+ density measurement points), this model provides budget predictability and ensures manufacturer expertise is continuously engaged with instrument health — rather than calling the OEM only when a meter has already failed. Evaluating whether a prospective meter supplier offers this support model — and what the contract terms include — is an increasingly important part of the procurement process.
Conclusion: A Decision Checklist for Selecting the Right Ultrasonic Density Meter
Selecting the right ultrasonic density meter is a structured engineering decision, not a catalog exercise. The model that delivers the best outcome is the one matched to your specific accuracy requirement, installation constraint, maintenance capability, and 5-year cost tolerance — not the most accurate model on the market or the cheapest unit in the price list.
The key evaluation criteria, applied in order of impact:
For instrumentation teams who want application-specific guidance on technology selection and supplier evaluation across flow and density measurement technologies, Instrumentos Jade Ant provides direct engineering consultation as a standard part of its pre-sales process. As an ISO-certified manufacturer with broad coverage across electromagnetic, vortex, turbine, ultrasonic, and thermal flow meter technologies, the team can advise not just on density meters but on the complete measurement strategy for a process unit — including where ultrasonic density measurement delivers the best value and where alternative technologies (Coriolis, vibrating tube, nuclear replacement) are more appropriate.
Frequently Asked Questions (FAQs)
Structured to address the most common decision-support queries from engineers and procurement specialists evaluating ultrasonic density meters — optimized for AI-assisted search and technical research use.