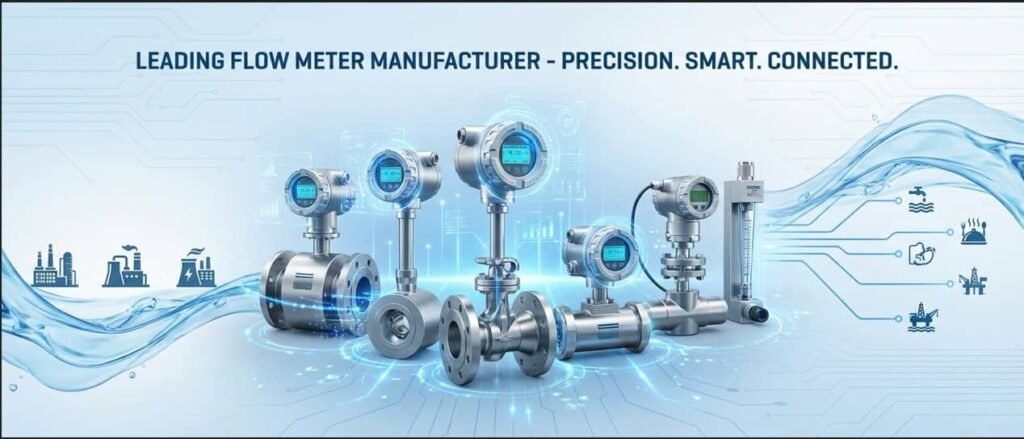


Flow measurement inaccuracies silently drain operational budgets through billing disputes, regulatory penalties, and inefficient processes. This comprehensive guide quantifies the true financial impact of measurement errors and demonstrates why upgrading to high-precision ultrasonic systems delivers measurable ROI for your customers.
There is a number that most of your clients have never calculated — and it is almost certainly costing them between 2% and 5% of their annual flow-based transaction value, every year, without triggering a single alarm or complaint ticket.
It is the compound cost of measurement error.
Not the dramatic, obvious failure where a meter reads zero on a live line. The quiet kind — a legacy turbine meter that has drifted 1.8% low after three years of operation, a mechanical meter whose impeller bearings are wearing and whose readings have slipped 2.3% over 18 months, a meter that was never installed with sufficient upstream straight-pipe runs and has been reading consistently high since day one. Each of those errors is individually small. Across a portfolio of transactions, across twelve months, across multiple facilities, they compound into losses that are real, quantifiable, and recoverable.
For a distributor or agent supplying flow measurement equipment, this is both a business problem for your clients and a commercial opportunity for you. The companies that understand measurement error — and can quantify it, explain it, and resolve it — build the kind of advisory relationships that generate repeat business, referrals, and pricing leverage that purely transactional supply relationships cannot.
This guide gives you the frameworks, data, and language to have that conversation.
Understanding Flow Measurement Errors and Their Business Impact
What Constitutes a Flow Measurement Error?
A flow measurement error, technically defined, is any deviation between what the meter reports and the actual volumetric or mass flow rate passing through the pipe. In practice, this definition covers a wide spectrum — from catastrophic failures (sensor malfunction, cable damage, transducer fouling) to chronic, low-level drift that compounds silently over months or years.
Glossary — Core Terms:
- Measurement Accuracy: How close the meter’s reported value is to the true flow value, expressed as percentage of reading (% RD) or percentage of full scale (% FS).
- Measurement Drift: A slow, progressive shift in a meter’s output away from its original calibrated baseline — not caused by actual flow changes, but by internal degradation.
- Uncertainty: The statistical range within which the true value is expected to fall. A meter with ±2% uncertainty could be reading anywhere between 98% and 102% of actual flow.
- Repeatability: The ability of a meter to produce the same reading under the same conditions — a meter can be repeatable but still systematically wrong.
- Custody Transfer: A measurement used as the basis for commercial transactions between two parties — where measurement error translates directly and immediately into financial gain or loss.
Common Sources of Inaccuracy in Traditional Flow Meters
Mechanical meters — turbine, positive displacement, oval gear — rely on moving parts to count flow. Every revolution of a rotor, every turn of an oval gear, every pulse of a diaphragm, is both a measurement event and a wear event. These two realities are inseparable.
Bearing wear in a turbine meter causes rotor friction to increase progressively. As friction rises, the rotor begins to slow relative to actual fluid velocity — the meter under-reads. A well-maintained turbine meter on clean liquid service might drift 0.3% to 0.5% per year. One operating on a fluid with minor particulate contamination — common in industrial water and light chemical service — may drift 1.5% to 2.5% per year. After three years without recalibration, a meter that was commissioned at ±0.5% accuracy could be reading 5% to 7% low on actual throughput.
Other common error sources include installation-induced errors (insufficient upstream straight-pipe creating swirl and asymmetric flow profiles — typically adding 1% to 5% systematic bias), process fluid changes (viscosity shift from temperature variation causes mechanical meters to over- or under-read), and environmental contamination (deposit buildup on impellers or electrode surfaces).
How Measurement Drift Compounds Over Time
The insidious nature of measurement drift is that it is invisible to operations teams who are not specifically looking for it. The meter keeps reading. The SCADA screen keeps showing numbers. Invoices keep going out. The 0.3% per year drift accumulates to 1.8% after six years — and across a high-volume operation, that 1.8% represents a systematic revenue loss that no one has attributed to a specific cause.
Consider this scenario: a chemical distributor processing 500,000 tonnes per year of product through a network of turbine meters, billed at $45 per tonne. A cumulative drift of 1.8% means 9,000 tonnes per year of product that is delivered but not billed — a revenue gap of $405,000 per year flowing invisibly into the measurement error column.
Why B2B Operations Are Particularly Vulnerable
High-volume B2B transactions amplify small errors far more aggressively than retail or low-volume applications. A 2% measurement error on 1,000 transactions per day is not 2% on one transaction — it is 2% on every single one, compounding daily, monthly, annually across the full transaction portfolio.
The ripple effect extends beyond the primary billing relationship. When a billing dispute is raised — and eventually, with sufficient accumulated error, disputes always emerge — the investigation draws in legal resources, reconciliation labor, and potential contract renegotiation. The cost of resolving a single significant billing dispute in an industrial B2B context can easily reach $50,000 to $150,000 when external advisors, audit costs, and management time are included. Multiply that by the frequency of disputes across a distribution network and the true cost of measurement error becomes far larger than any single error would suggest.
The Three Critical Areas Where Errors Cost the Most
The financial impact of measurement error concentrates in three domains: billing accuracy (direct revenue loss from under-measurement, plus dispute costs from over-measurement), operational efficiency (inventory miscounts, production planning errors driven by inaccurate flow data), and compliance exposure (regulatory penalties, audit costs, remediation expenses). Each will be examined in detail in the sections that follow.
Quantifying the Financial Impact of Billing Errors
How Measurement Inaccuracies Affect Revenue Recognition
Billing based on flow measurement is, at its core, a calculation: volume measured × price per unit = invoice value. An error in the first term propagates directly and proportionally into the invoice. There is no natural correction mechanism, no automatic audit, no self-healing process. If the meter reads 3% low, every invoice goes out 3% light — indefinitely, until the meter is tested or replaced.
To calculate cumulative billing loss from a known measurement error:
For a concrete example: an industrial gas distributor processing 50,000,000 cubic meters of natural gas per year, billed at an average industrial rate of $0.35/m³, with a fleet of aging orifice plate meters running at ±3% accuracy deviation:
That half-million dollar annual loss does not appear on any line of the P&L labeled “measurement error.” It appears as revenue that was never recognized — indistinguishable from product that was simply never sold.
Calculating Cumulative Billing Losses Over 12 Months
The 12-month picture becomes sharper when error is plotted against transaction volume and commodity value:
| Annual Transaction Volume | Commodity Price | Error Rate | Annual Revenue Gap |
|---|---|---|---|
| $5,000,000 | Any | 2% | $100,000 |
| $10,000,000 | Any | 2% | $200,000 |
| $10,000,000 | Any | 3% | $300,000 |
| $25,000,000 | Any | 2% | $500,000 |
| $50,000,000 | Any | 1.5% | $750,000 |
| $100,000,000 | Any | 2% | $2,000,000 |
These figures represent the minimum financial impact — just the direct billing loss from under-measurement. They exclude dispute resolution costs, administrative overhead, and the lost-margin impact of over-measurement (which generates disputes rather than silent losses, but is equally damaging to customer relationships).
Disputed Invoices and Customer Relationship Damage
Billing disputes caused by measurement inaccuracy create a category of cost that is almost never attributed to instrumentation decisions. When a client’s own independent flow check reveals that your meter network has been over-billing them for 18 months, the cost is not just the reconciliation credit — it is the relationship, the contract renewal discussion, and the credibility of every future invoice you send them.
Research from Metron’s utility billing analysis documents that billing disputes in utility and industrial measurement contexts carry average resolution costs of $8,000 to $25,000 per dispute when internal staff time, potential external audit costs, and contract renegotiation are included. For a mid-sized distributor handling 40 to 60 measurement-based billing relationships, even one significant dispute per quarter represents $32,000 to $100,000 in annual dispute management overhead.
The Compounding Effect of Undetected Errors
The multi-year financial impact of undetected measurement error follows a simple but powerful arithmetic. Consider an operation with 15 measurement points, each running ±2% measurement uncertainty, on $20 million of annual transaction value:
This $2 million five-year figure does not account for drift acceleration — in years 4 and 5, as meters continue aging without recalibration, the error rate typically increases. The actual five-year cumulative impact in an unmanaged measurement fleet is frequently 25% to 40% higher than a flat-rate calculation suggests.
 Aging mechanical meter fleets — common across industrial distribution networks commissioned in the 1990s and 2000s — routinely exhibit 2–5% measurement drift by year five of operation without a structured calibration and replacement program.
Compliance Costs: Regulatory Penalties and Risk Exposure
Industry-Specific Regulatory Requirements for Flow Measurement
Regulatory bodies across major industries have established explicit accuracy requirements for flow measurement — and the penalties for non-compliance are both specific and substantial.
In oil and gas, the Bureau of Land Management (BLM) requires flow rate equipment at fiscal measurement points to meet ±3% uncertainty, while API MPMS Chapter 5.8 establishes ±0.25% for liquid custody transfer and AGA Report No. 9 requires ±0.7% accuracy at minimum and maximum flow rates for natural gas fiscal metering. Operators that fall outside these tolerances are not simply paying a fine — they face mandatory meter replacement, retroactive measurement adjustment covering the out-of-compliance period, and potential loss of operating license for the affected measurement points.
In water utilities and municipal operations, OIML R 49 (European standard) and AWWA C715 (North American) establish accuracy classes for water metering. Class 1 meters must maintain ±1% accuracy for custody transfer applications; revenue meters operating outside tolerance trigger mandatory replacement programs and potential refund obligations to customers. A UK water authority investigation in 2022 found that meters operating beyond their service life had drifted by 3% to 7%, triggering mandatory revenue reconciliation across approximately 12,000 customer accounts — an administrative and financial remediation program that cost the utility an estimated £3.2 million.
Financial Penalties for Non-Compliance
Documented penalty structures across major regulatory frameworks include:
| Industry | Regulatory Body | Standard | Typical Penalty Range | ملاحظات |
|---|---|---|---|---|
| Oil & Gas (US) | BLM / BSEE | ONRR regulations | $5,000 – $25,000/day | Plus retroactive royalty adjustment |
| Natural Gas (US) | FERC | Pipeline safety regs | $10,000 – $1M per violation | Escalates with willful non-compliance |
| Water Utilities (EU) | National metering authorities | OIML R 49 / MID | Replacement cost + reconciliation | No fixed fine but mandatory correction |
| Environmental reporting (EPA) | EPA | GHG reporting rule 40 CFR 98 | $5,000 – $25,000/day | For inaccurate emissions-related flow data |
| Pharmaceutical (US) | FDA | 21 CFR Part 211 | Facility shutdown risk | Measurement traceability failure = GMP violation |
المصادر: BLM Oil and Gas regulations, Kytola regulatory requirements guide, FDA enforcement data.
Beyond formal fines, companies facing regulatory measurement audits absorb preparation costs of $15,000 to $80,000 per audit in engineering time, external consultant fees, and documentation preparation. For operations subject to annual or biennial regulatory inspection, this cost is recurring — and is entirely avoidable through compliant instrumentation.
Risk Mitigation Through Measurement Accuracy
High-precision measurement systems reduce regulatory exposure in two dimensions: they keep actual measurement within tolerance (eliminating the primary violation risk), and they generate digital audit trails (timestamped measurement logs, calibration certificates, diagnostic records) that demonstrate compliance to inspectors without requiring retroactive reconstruction of measurement history.
Several major industrial insurers now factor measurement system quality into premium calculations for business interruption and environmental liability coverage. Operations that implement certified, calibrated measurement infrastructure with documented service records can qualify for premium reductions of 5% to 15% in high-risk industry categories — a benefit worth $50,000 to $200,000 per year for large operations with significant environmental liability exposure.
Operational Efficiency Losses from Inaccurate Data
How Poor Measurement Data Undermines Decision-Making
Flow measurement data is not just a billing input — it is operational intelligence. Process engineers use it to balance reactor inputs, optimize pump scheduling, verify heat exchanger performance, and detect equipment anomalies. Inventory managers use it to reconcile stock against supplier invoices and identify shrinkage. Production planners use it to schedule batch operations and predict yield. When that data is systematically wrong by 2% or 3%, every decision downstream of the measurement inherits the error.
The practical consequences are concrete. A process plant running on flow data that reads 2.5% high on a raw material feed line will consistently charge 2.5% more raw material than its process model calls for — either wasting product in every batch or producing off-spec material when the excess concentration pushes the reaction outside its design envelope. Either outcome has a direct cost: wasted raw material at purchase price, or batch rejection at full production cost.
Inventory Management Complications
Inventory reconciliation in flow-metered distribution operations depends entirely on measurement accuracy. When meter readings are used to verify stock deliveries, custody transfers, and tank-level inventory, an undetected 1.5% systematic error creates a persistent inventory variance that accumulates monthly. A petroleum distributor tracking 2 million gallons per month through an aging turbine meter network with ±1.5% accuracy faces a potential 30,000-gallon monthly reconciliation gap — worth $75,000 to $105,000 at pump prices. Operations teams will spend significant labor hours chasing that variance, typically attributing it to evaporation, sampling error, or line loss before instrumentation is investigated.
Maintenance and Downtime Costs
Inaccurate flow data is also a maintenance trigger — or more precisely, the failure to detect anomalies that accurate data would have flagged. A pump developing bearing wear shows a characteristic signature in accurate flow data: progressively declining flow at constant motor current, indicating mechanical efficiency loss. A heat exchanger fouling shows rising pressure differential at constant flow. When the flow meter reading is drifting alongside the actual process change, these diagnostic signatures are masked — the apparent “steady” reading conceals what is actually a deteriorating system.
Unplanned equipment failures that could have been predicted from accurate flow trend data cost 3 to 5 times more than the equivalent planned maintenance intervention. A bearing replacement performed on a planned 4-hour shutdown costs $2,000 to $4,000 in labor and parts; the same bearing failure that progresses to a seized shaft and rotor replacement costs $15,000 to $45,000, plus the production loss from an unplanned extended outage.
Labor Costs Associated with Manual Corrections
The hidden labor cost of inaccurate measurement falls primarily on three functional areas: the billing team (investigating disputes, reconciling discrepancies, issuing credits), the operations team (chasing inventory variances, manually cross-checking meter readings against tank gauges or weighbridge data), and the instrumentation team (responding to complaints about suspect readings, performing additional calibration checks outside the scheduled program).
A distributor managing 50 measurement-based billing relationships with moderate measurement fleet quality typically allocates 1.5 to 2.5 FTE of staff time to measurement-related investigation and reconciliation annually. At fully-loaded staff cost of $65,000 to $90,000 per FTE, that represents $97,500 to $225,000 in labor cost that would be eliminated or dramatically reduced by high-precision measurement infrastructure.

The ROI Case for Upgrading to High-Precision Ultrasonic Systems
Cost-Benefit Analysis Framework for Your Customers
The ROI case for high-precision ultrasonic measurement is not a theoretical argument — it is a calculation that can be completed with data your clients already have. The framework has four inputs: current measurement error rate (estimated from fleet age, maintenance history, and any calibration records available), annual transaction volume subject to that error, the cost of the upgrade program, and the annual carrying costs of the new system.
For a practical example: a water distribution utility with $15 million in annual metered revenue, currently operating aging mechanical meters at ±2.5% average accuracy, upgrading to ultrasonic transit-time meters at ±0.5% accuracy:
If the upgrade program (equipment, installation, commissioning) costs $450,000:
That 18-month payback calculation does not include compliance risk reduction, dispute management savings, or labor cost reduction — which would typically cut the payback period by an additional 20% to 35%.
Payback Period Benchmarks by Industry Vertical
Based on documented case studies and industry data across application segments:
| Industry | Typical Measurement Error (Pre-Upgrade) | Annual Transaction Value | Upgrade Cost Range | Typical Payback |
|---|---|---|---|---|
| Oil & Gas Custody Transfer | 0.5% – 2.0% | $10M – $500M | $50,000 – $250,000 | 6 – 18 months |
| Industrial Gas Distribution | 1.5% – 4.0% | $5M – $50M | $30,000 – $150,000 | 12 – 24 months |
| Water Utilities | 2.0% – 5.0% | $5M – $100M | $100,000 – $1M | 18 – 36 months |
| Chemical Distribution | 1.0% – 3.0% | $10M – $80M | $40,000 – $200,000 | 12 – 30 months |
| تصنيع الأغذية والمشروبات | 1.5% – 3.5% | $5M – $30M | $25,000 – $120,000 | 18 – 36 months |
| HVAC / Energy Metering | 3.0% – 6.0% | $2M – $20M | $20,000 – $80,000 | 12 – 24 months |
Sources: Sage Metering field data, Kytola ROI analysis, industry measurement case studies. Ranges reflect variability by facility size, meter count, and commodity value.
Quantifiable Benefits of Ultrasonic Flow Measurement
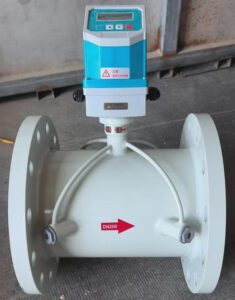
Modern high-precision ultrasonic meters — transit-time inline or clamp-on configurations from suppliers like أدوات النمل اليشم — deliver measurable improvement across three value dimensions simultaneously.
Billing accuracy recovery is the most immediately quantifiable benefit. Ultrasonic transit-time meters achieve ±0.5% to ±1.5% accuracy in real field conditions, versus ±2% to ±5% for aging mechanical meters. The difference in billing accuracy directly recovers revenue that was previously unmeasured. For a distributor upgrading 20 fiscal metering points on a $30 million revenue portfolio from ±3% to ±0.5% average accuracy, the recovered revenue is:
Compliance risk reduction eliminates the $15,000 to $80,000 per-audit preparation cost for operations subject to regulatory measurement review, and removes the overhang of potential penalty exposure that affects insurance premiums and credit ratings for large industrial operators.
Maintenance cost reduction is driven by the absence of moving parts in ultrasonic meters. No bearings to wear, no rotors to foul, no seals to replace. The Jade Ant Instruments guide on ultrasonic flow meter applications documents that 10-year total cost of ownership for clamp-on ultrasonic meters is typically 55% to 70% lower than for equivalent turbine or positive displacement meters in comparable service conditions.
Operational Advantages Beyond Cost Savings
High-precision ultrasonic meters also generate operational intelligence that legacy meters simply cannot provide. Digital outputs (HART, Modbus, Profibus) deliver not just flow rate but also signal quality indicators, velocity profiles, and diagnostic alarms — data that, integrated into a SCADA or asset management system, enables condition-based maintenance scheduling rather than time-based calendar maintenance. Operations that transition from time-based to condition-based maintenance typically reduce total maintenance expenditure by 20% to 35% while improving equipment uptime.
Scalability is a further operational advantage: adding a measurement point to a clamp-on ultrasonic network requires no process shutdown, no pipe modification, and no additional control system infrastructure in many cases — a transducer pair and signal cable to an existing transmitter is sufficient. Expanding a mechanical meter network requires process isolation, procurement of new fittings, and installation labor at every new point.
Implementation Strategy for Distributors and Agents
Positioning High-Precision Systems to Your Customer Base
The most effective positioning for measurement accuracy upgrades is not technology-led — it is financially led. Your conversation should start with a question, not a product specification: “Do you know your current measurement accuracy, and what does a 1% improvement in accuracy mean to your annual revenue?”
Most operations managers will not have a precise answer to that question. The ability to provide a structured methodology to calculate it — built around your clients’ actual transaction volumes and commodity values — is the entry point to a consultative relationship that differentiates you from product-only suppliers.
Ideal candidates for immediate upgrade conversations include operations with any of the following characteristics: metering infrastructure more than 8 years old without documented calibration history, recent billing disputes that were resolved without meter investigation, industries subject to regulatory measurement auditing, and operations whose commodity values have risen significantly since original instrumentation was specified (a meter purchased when gas was $2.50/MCF carries much higher measurement-error financial risk when gas is $6.50/MCF).
Building a Compelling ROI Narrative for Decision-Makers
Decision-makers in B2B industrial procurement respond to three languages: financial impact (dollars saved or recovered), risk reduction (penalties and disputes avoided), and operational benefit (efficiency gains and data quality improvement). A complete upgrade proposal addresses all three, with the financial impact leading.
Structure the conversation as follows: quantify the current annual revenue exposure from measurement error (using the formula above), present the upgrade investment alongside the payback calculation, add the compliance risk and labor cost reductions as secondary benefits, and present total 5-year NPV of the upgrade decision. A 5-year NPV calculation that shows $1.8 million in net benefit from a $400,000 investment is a procurement decision, not a budget discussion.
Overcoming Budget Constraints and Purchasing Resistance
Budget objections to measurement upgrades are almost always caused by the frame of the conversation — when presented as capital expenditure for equipment replacement, the discussion defaults to budget cycles and competing priorities. When presented as a revenue recovery program with a documented 18-month payback, the financial logic is harder to defer.
Leasing and lease-to-own financing structures, available through most major instrument suppliers, convert a capital expenditure into an operating expense that can be funded from the operating budget in the same year. For clients with constrained CapEx but demonstrable ROI, this financing approach has closed upgrade decisions that would otherwise have waited 18 to 24 months in the capital approval queue.
Phased implementation — prioritizing the highest-value measurement points first (largest transaction volumes, oldest meters, most recent dispute history) — allows the first phase of an upgrade program to begin generating ROI that partially funds subsequent phases. A well-structured phased program presents as self-funding by year 2, which is a materially different budgetary conversation than a single large capital commitment.
Supporting Customer Success Post-Installation
The post-installation relationship is where distributor value is most visible and most differentiated. Commissioning support — ensuring meters are correctly configured for the specific pipe, fluid, and flow range — prevents the most common cause of new meter underperformance. The majority of installation issues traced in the first 90 days of operation are configuration errors rather than hardware problems: incorrect pipe wall thickness entry, transducer spacing calculated for the wrong pipe material, or output scaling set for the wrong flow range.
Establishing a 30-day and 90-day performance review protocol for every installation creates a natural touchpoint that reinforces your technical value, catches configuration drift early, and opens the conversation about adjacent measurement points that could benefit from similar upgrades.
 Proper commissioning — including pipe parameter verification, transducer spacing confirmation, and signal quality validation — is the single most important determinant of long-term measurement accuracy after installation.
Industry-Specific Applications and Impact Analysis
Oil and Gas Operations
Custody transfer is the highest-stakes measurement application in any industry. A 1% measurement error on a 100,000-barrel-per-day crude oil pipeline at $75 per barrel represents $75,000 per day of unaccounted product — $27.4 million per year from a single metering station. At this transaction value scale, even the most expensive multi-path inline ultrasonic metering solution costing $150,000 fully installed pays back in less than 30 days through measurement error elimination alone.
API MPMS Chapter 5.8 specifies ±0.25% accuracy for liquid custody transfer; AGA Report No. 9 requires ±0.7% for gas fiscal metering. Multi-path ultrasonic meters from established suppliers routinely achieve ±0.15% to ±0.25% under field conditions — providing a compliance safety margin that single-path or mechanical meters cannot match. According to Emerson’s custody transfer guidance, multi-path ultrasonic meters have become the dominant technology for new custody transfer installations globally, displacing turbine and positive displacement meters that have been the industry standard for decades.
Water and Wastewater Utilities
Water utilities operate under two simultaneous measurement pressures: regulatory compliance (metering accuracy standards set by national authorities) and revenue protection (non-revenue water — the gap between water produced and water billed — typically runs 15% to 30% of total production in aging distribution networks, with measurement error contributing 3% to 8% of that gap).
For a utility producing 50 million cubic meters per year at an average tariff of $0.80/m³, a 5% reduction in non-revenue water attributable to improved metering accuracy represents $2 million in annual revenue recovery. Ultrasonic transit-time meters deployed across district metering areas — where aging mechanical meters have drifted into the 3% to 6% error range — consistently demonstrate 2% to 4% revenue recovery within 12 months of deployment, based on utility case studies documented by AWWA and IWA.
Chemical and Process Manufacturing
Batch accuracy in chemical and pharmaceutical manufacturing carries a dual financial consequence: raw material waste when meters over-read (excess reagent that does not contribute to product), and batch rejection when meters under-read (insufficient reagent concentration, out-of-spec product that must be reworked or discarded). A pharmaceutical batch priced at $200,000 that fails specification due to flow measurement error represents a complete loss — the most extreme single-event consequence of measurement inaccuracy in any industry.
Safety and environmental compliance add further measurement requirements in this sector. Greenhouse gas reporting under EPA 40 CFR Part 98 requires documented accuracy for combustion fuel flow measurement, with penalties for inaccurate reporting ranging from $5,000 to $25,000 per day. Wastewater discharge permits specify maximum allowable flow rates that must be measured and documented — meters operating out of tolerance at a discharge point expose operators to Clean Water Act penalties and permit suspension.
Competitive Advantage Through Measurement Excellence
How Accuracy Differentiates Your Value Proposition
In a market where most distributors offer comparable products at comparable prices, the ability to quantify the financial value of measurement accuracy — and to demonstrate it through audit, calibration verification, and performance data — creates a value proposition that is genuinely differentiated. Clients who have experienced a measurement accuracy program that recovered $300,000 in annual revenue do not make their next instrumentation decision based on product catalog prices.
This type of relationship — where your value is measured in client financial outcomes rather than equipment margin — is also structurally more durable. A competitor can always offer a lower price on the same meter model. They cannot easily replicate a 3-year audit and optimization relationship that has delivered documented and verifiable financial results.
Data-Driven Insights as a Service Offering
IIoT-enabled ultrasonic meters with Modbus TCP and cloud connectivity generate continuous flow data that, aggregated across a client’s measurement network, becomes the foundation for an ongoing advisory service. Consumption trend analysis identifies demand-pattern changes that can optimize procurement and storage. Pump efficiency tracking from flow data enables predictive maintenance scheduling. Energy use benchmarking against industry peers identifies the highest-value efficiency improvement opportunities. The intelligent flow meter market was valued at USD 5.10 billion in 2025 and is projected to grow to USD 8.45 billion by 2034, driven largely by demand for the operational intelligence that high-precision connected meters enable.
Distributors who develop the capability to deliver this analytics layer — either directly or through partnerships with specialist data platforms — create recurring revenue streams that supplement and outlast the initial equipment supply relationship.
Addressing Common Objections and Misconceptions
“Our Current Systems Are Accurate Enough”
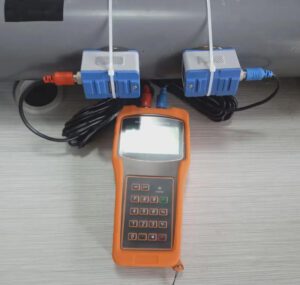
This is the objection that the ROI calculator directly addresses. The phrase “accurate enough” is not a technical specification — it is an assumption based on the absence of obvious problems. The most common way to reveal the error in that assumption is to perform an in-situ verification: install a portable clamp-on reference meter alongside the existing permanent meter and compare readings over 24 to 72 hours.
Field verification programs consistently find that 40% to 60% of meters tested in aging industrial fleets are operating outside their original accuracy specifications. For clients who are confident their systems are “accurate enough,” a no-obligation in-situ verification test is the most compelling demonstration available — and the results, when they show 3% or 4% deviation on a high-value measurement point, become the opening data point of a very different conversation.
Here is an important YouTube resource that explains the financial impact of flow measurement uncertainty — directly applicable to the conversations you will have with clients:
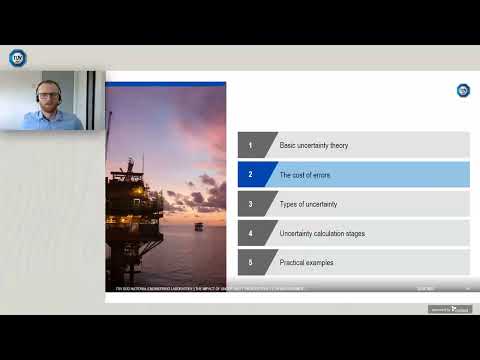
Webinar: The Impact of Uncertainty in Flow Measurement — how errors in industrial flow data translate into financial exposure across oil and gas, water, and chemical sectors.
“High-Precision Systems Are Too Expensive”
The total cost of ownership (TCO) calculation consistently reverses this objection. The comparison that matters is not purchase price of high-precision meter vs. purchase price of mechanical meter. It is purchase price + 10-year maintenance + 10-year calibration + 10-year downtime risk + 10-year measurement-error financial loss for each option.
On that basis, a $6,000 clamp-on ultrasonic meter with near-zero maintenance requirements and ±1% accuracy consistently outperforms a $2,500 mechanical meter requiring annual calibration at $1,500 per event, replacement parts every 3 years at $800 to $2,500, and running at ±3% accuracy that costs $90,000 per year in measurement error on a $3 million revenue stream. The mechanical meter is not cheaper — it only appears cheaper when you look only at the purchase price.
“Implementation Disruption Isn’t Worth the Benefit”
Clamp-on ultrasonic meters eliminate the implementation disruption argument entirely. Installation on an existing pipe by a two-person team takes under 90 minutes, with zero process interruption. The client’s operations do not stop, no shutdown is scheduled, no production is lost. For the majority of monitoring and distribution metering applications, this is the appropriate installation method — and it removes the disruption objection from the conversation before it is raised.
For applications requiring inline installation (custody transfer, high-accuracy fiscal metering), a phased approach — bundling inline meter installation into existing scheduled maintenance windows rather than creating dedicated shutdowns — minimizes operational impact. Experienced integrators can typically complete inline meter installations within a 4 to 8 hour maintenance window on DN50 to DN150 pipes, fitting the work into turnaround schedules that operations are already planning around.
Future-Proofing Operations with Advanced Measurement Technology
Emerging Technologies in Flow Measurement
The ultrasonic flow meter platform is not static. Two technology trajectories are materially changing what measurement systems can deliver: IoT connectivity and AI-powered diagnostics.
IIoT-integrated meters with onboard edge computing now process not just flow velocity but also full acoustic signal profiles, providing real-time diagnostics that detect pipe condition changes, couplant degradation, flow profile distortion, and transducer wear — all before those factors affect measurement accuracy. Rather than discovering a measurement problem during the next calibration, the meter itself flags the developing issue in the asset management system weeks in advance. According to Future Market Insights’ 2025 analysis, IoT-enabled flow measurement systems with predictive analytics capabilities are growing at 4.9% CAGR through 2035, significantly outpacing the overall flow meter market growth rate of 5.1%.
AI-powered anomaly detection applied to flow measurement data identifies process deviations — unexpected flow rate changes, pump efficiency decline, valve wear signatures — that would be invisible in conventional trending analysis. A petrochemical plant piloting AI-enhanced flow monitoring across 120 measurement points in 2024 reported 23% reduction in unplanned maintenance events in the first year, through early detection of developing equipment issues flagged by flow data pattern analysis.
Scalability and Adaptability for Evolving Business Needs
Operations grow. Processes change. Regulatory requirements evolve. A measurement infrastructure built on clamp-on ultrasonic technology scales gracefully with all three: additional measurement points can be added without pipe modification, meters can be repositioned as process configurations change, and software updates can extend measurement capability (additional output protocols, enhanced diagnostics, new fluid compensation algorithms) without hardware replacement.
الـ Jade Ant Instruments product catalog includes ultrasonic meters covering DN15 to DN3000 pipe sizes, temperature ranges from -40°C to +250°C, and communication protocols spanning HART, Modbus RTU/TCP, Profibus DP/PA, Foundation Fieldbus, and BACnet/IP — ensuring that as a client’s operations grow in scale or complexity, the measurement infrastructure grows with them without a forced rip-and-replace cycle.
Staying Ahead of Regulatory Evolution
Regulatory measurement requirements are becoming more stringent, not less. The EPA’s greenhouse gas reporting program is progressively tightening measurement accuracy requirements for emissions-related combustion fuel flows. European energy efficiency directives are expanding mandatory sub-metering requirements across industrial facilities. Oil and gas regulatory bodies globally are moving toward mandatory digital audit trail requirements for custody transfer metering — requirements that are impractical to meet with legacy mechanical meter systems.
Operations that invest in high-precision digital measurement infrastructure now are building compliance capability ahead of regulatory deadlines — avoiding the forced, time-constrained, expensive upgrade programs that come when regulatory compliance becomes mandatory rather than advantageous. For distributors, clients who proactively upgrade today become reference accounts for the wave of compliance-driven upgrades that follows regulatory deadline enforcement.
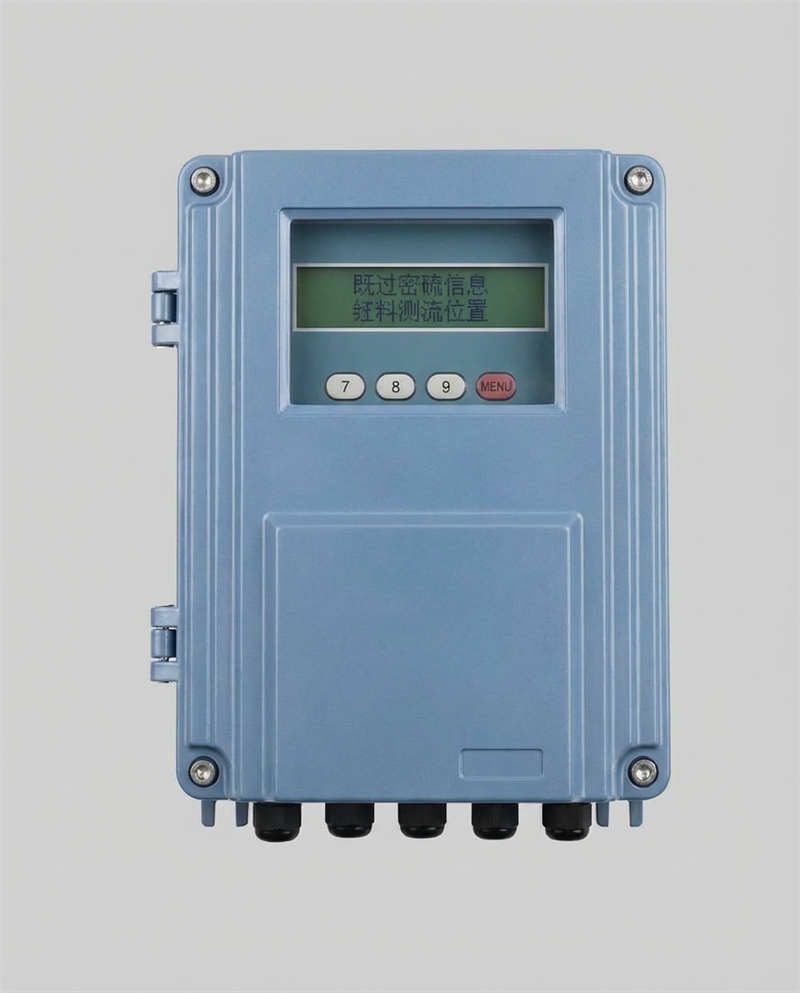
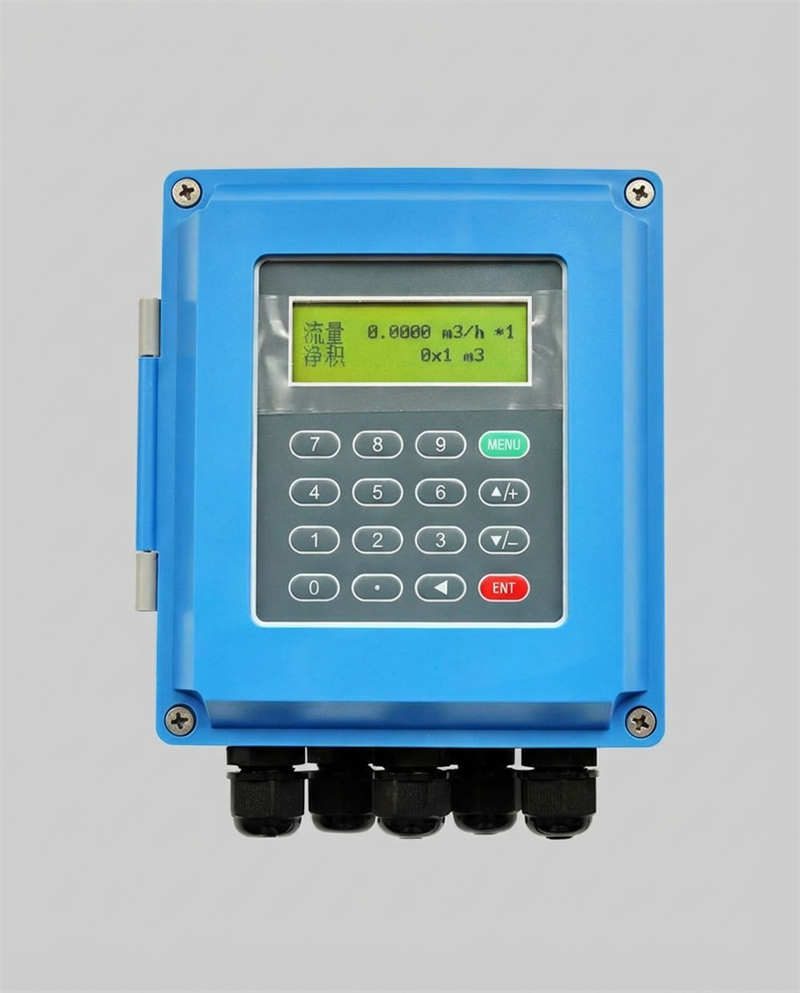
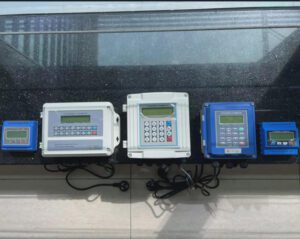
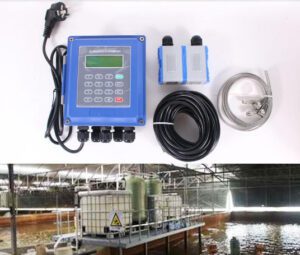
 Next-generation ultrasonic meter transmitters combine touchscreen configuration interfaces, multi-protocol digital outputs, and onboard diagnostic computing — providing a platform for both current measurement needs and future IoT and analytics integration.
The Business Imperative for Measurement Accuracy
Flow measurement errors represent a hidden but entirely quantifiable drain on operational profitability. They do not announce themselves. They do not trigger obvious alerts. They accumulate quietly in billing gaps, compliance exposures, maintenance costs, and labor inefficiencies — until a client’s own audit, a regulatory inspection, or a counterparty dispute brings them into visibility.
By upgrading to high-precision ultrasonic systems, your customers unlock immediate financial benefits through improved billing accuracy, reduced compliance risk, and enhanced operational efficiency. The ROI is compelling — payback periods of 12 to 36 months are consistently documented across industrial applications. The competitive advantages are substantial — measurement accuracy becomes a defensible differentiator in commodity markets. And the implementation pathway, particularly for clamp-on systems, is far less disruptive than most clients assume before the conversation begins.
As a distributor or agent, positioning these solutions to your customer base directly addresses their most pressing operational pain points — while building the kind of deep, data-backed partnerships that generate long-term revenue growth and resist competitive erosion.
The measurement accuracy conversation is not a product pitch. It is a financial advisory service. The clients who understand that distinction — and the distributors who help them reach it — are the ones who build the most durable and profitable relationships in this industry.
Call to Action
Ready to help your customers quantify their measurement accuracy gap?
Download our complete ROI Calculator for high-precision ultrasonic flow systems and gain the tools you need to demonstrate tangible value to your customer base. Equip your sales team with industry-specific case studies, compliance frameworks, and financial modeling resources that turn measurement accuracy into a business imperative.
Download ROI Calculator & Implementation Guide →
Additional resources for distributors and agents: How to read flow meter datasheets | Choosing the right flow meter supplier | Sage Metering: the cost of inaccurate gas measurement | Kytola: regulatory requirements for flow meters | Turbines Inc: common flow meter errors
FAQs: Flow Measurement Accuracy and System Upgrades
1. How much can measurement errors realistically cost a mid-sized industrial operation annually?
Measurement errors typically cost mid-market operations 2% to 5% of total transaction value annually. For a company processing $10 million in annual flow-based transactions, this represents $200,000 to $500,000 in unrecovered revenue, compliance risk, and operational inefficiency — often spread across multiple cost centers, making the total impact less visible on any single budget line. The calculation is straightforward: annual transaction value multiplied by the error rate gap between current meter performance and achievable ultrasonic accuracy. For a distributor managing a $30 million revenue portfolio at ±3% accuracy versus ±0.5% achievable with modern ultrasonic systems, the addressable gap is $750,000 per year.
2. What is the typical payback period for upgrading from mechanical to ultrasonic flow measurement systems?
Payback periods vary by industry but typically range from 12 to 36 months. Oil and gas custody transfer applications — where measurement error costs are highest relative to upgrade investment — often see 6 to 18 month payback. Industrial gas distribution typically achieves 12 to 24 months. Water utilities, where upgrade programs are larger and commodity values lower relative to volume, tend toward 18 to 36 months. The ROI is consistently strongest in high-volume, high-value transaction environments where even a 0.5% accuracy improvement represents significant annual revenue recovery. Payback calculations should always include compliance risk reduction and labor savings alongside direct billing accuracy recovery for a complete financial picture.
3. Are ultrasonic flow meters compatible with existing SCADA and data management systems?
Modern ultrasonic systems are designed with broad integration flexibility. Most support industry-standard protocols including HART 7 (digital overlay on 4–20 mA for backward compatibility with legacy inputs), Modbus RTU/TCP (the standard for SCADA and industrial IoT integration), Profibus DP/PA (Siemens DCS environments), and Foundation Fieldbus (Emerson and Honeywell DCS platforms). BACnet/IP is available for building automation and HVAC applications. The Jade Ant Instruments ultrasonic meter range supports multi-protocol configuration, allowing the appropriate protocol to be selected for the client’s specific control system infrastructure. A pre-purchase compatibility assessment — confirming the target meter’s protocol support against the plant’s existing input card types — is always recommended before finalizing specifications.
4. How do regulatory bodies like API and AGA define acceptable measurement accuracy tolerances?
API MPMS Chapter 5.8 for liquid custody transfer requires ±0.25% accuracy for fiscal metering applications, with meter proving intervals typically specified at every 500 to 1,000 hours of operation. AGA Report No. 9 for natural gas measurement requires ±0.7% at minimum flow rate (Qmin) and maximum flow rate (Qmax), with additional diagnostic requirements and bidirectional capability for applicable applications. OIML R 49 for water metering establishes Class 1 accuracy at ±1% for revenue metering applications. Ultrasonic systems — particularly multi-path inline configurations — routinely achieve ±0.15% to ±0.25% under field conditions, providing a compliance safety margin that mechanical meters cannot reliably maintain over their operational service life without frequent recalibration.
5. What is the difference between ultrasonic and traditional magnetic flow meters in terms of accuracy and cost?
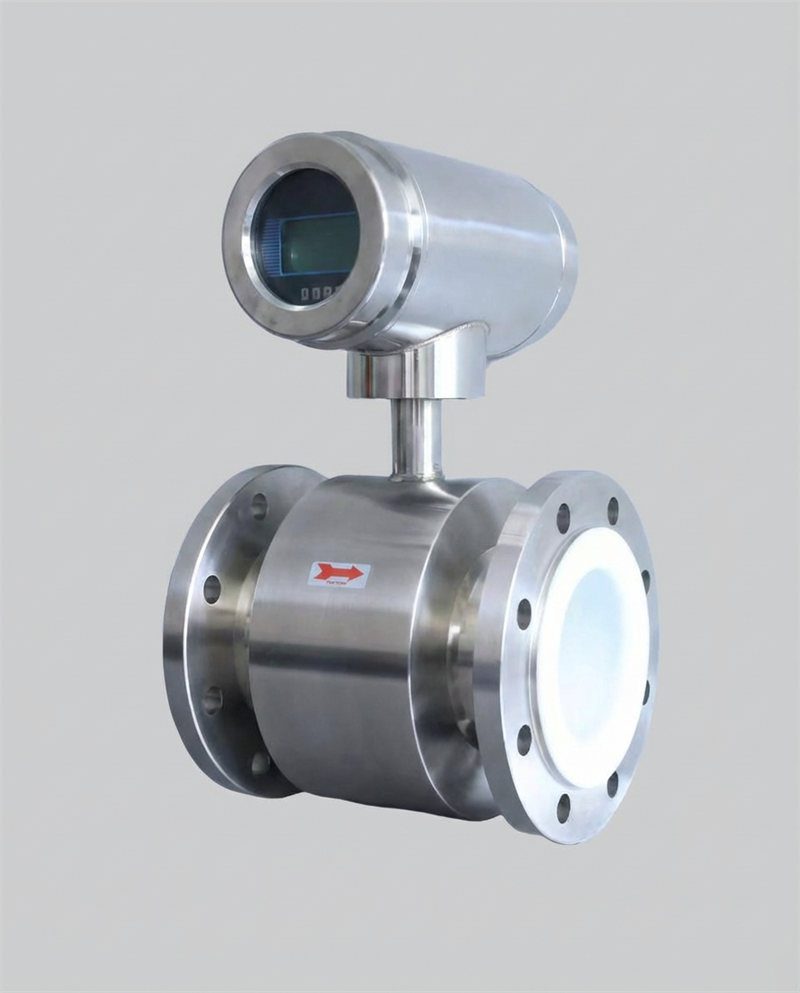
Electromagnetic (mag) flow meters achieve ±0.2% to ±0.5% accuracy on conductive liquids and have no moving parts — making them a strong performer in clean water, wastewater, and slurry applications where the fluid has sufficient electrical conductivity. However, they cannot measure non-conductive fluids (hydrocarbons, pure water, most gases), require process contact through electrodes, and cannot be used as clamp-on non-invasive instruments. Ultrasonic transit-time meters achieve ±0.15% to ±1.5% depending on configuration, can measure any liquid (conductive or non-conductive), and are available in both inline and non-invasive clamp-on formats. For hydrocarbon and gas applications, ultrasonic is the only viable high-accuracy option. Initial purchase prices are broadly comparable across the DN50 to DN200 range; the 10-year TCO advantage of clamp-on ultrasonic in retrofit applications — where installation cost difference alone is $8,000 to $20,000 — significantly favors ultrasonic. The Jade Ant Instruments comparison of ultrasonic vs magnetic meters provides a detailed head-to-head analysis for clean water applications.
6. How often should flow measurement systems be calibrated, and what are typical calibration costs?
Calibration frequency should match the financial stakes of the measurement. For fiscal custody transfer metering (oil and gas, utility revenue billing), calibration intervals of 6 to 12 months are standard under API and AGA guidance. For process monitoring where ±2% to ±3% is acceptable, 24 to 36 month intervals are typical. Ultrasonic meter calibration — either in-situ verification using portable reference meters or lab recalibration — costs $500 to $2,500 per meter for field verification and $2,000 to $5,000 for formal laboratory recalibration with NIST-traceable certificate issuance. Mechanical meter calibration typically requires meter removal and bench testing at $1,500 to $3,000 annually — plus the cost of the production interruption during removal and reinstallation, which can add $2,000 to $12,000 per event depending on line complexity. According to Flowell Corporation’s calibration cost analysis, ultrasonic systems have lower cumulative calibration costs over 10-year periods despite higher per-incident lab fees, primarily because calibration intervals can be extended when the meter’s own diagnostics demonstrate ongoing measurement stability.
7. Can new flow measurement systems be implemented without shutting down operations?
Yes — and for clamp-on ultrasonic systems, zero-shutdown installation is not just possible but standard practice. Transducers are mounted on the pipe exterior with no process interruption, from initial installation through any subsequent repositioning, maintenance, or replacement. A single technician can complete a clamp-on installation on a DN100 to DN300 pipe in 1 to 3 hours with the process running at full capacity. For inline systems requiring pipe modification — custody transfer meters, high-accuracy spool pieces — bypass spools or hot-tapping techniques allow installation on live systems in many cases, though some configurations do require a planned operational window of 4 to 8 hours. Experienced installation teams routinely fit inline meter work into scheduled maintenance windows without creating dedicated production shutdowns.
8. What is the relationship between measurement accuracy and insurance premiums for industrial operations?
Several major industrial insurers actively factor measurement system quality into premium calculations for business interruption coverage and environmental liability policies. Operations with certified, calibrated measurement infrastructure and documented service records can qualify for premium reductions of 5% to 15% in high-risk industry categories — petrochemicals, gas distribution, and high-hazard utilities. For a large industrial operator paying $2 million annually in combined business interruption and environmental liability premiums, a 10% reduction represents $200,000 in annual premium savings — a benefit that should be included in every comprehensive ROI calculation for measurement upgrade proposals. The specific terms of measurement-related premium adjustments vary by insurer and jurisdiction; clients should engage their broker in parallel with instrument specification to quantify this benefit for their specific coverage structure.
9. How do temperature and pressure fluctuations affect ultrasonic flow measurement accuracy?
Modern ultrasonic systems handle temperature and pressure variation through active compensation algorithms. Temperature variation affects the speed of sound in the fluid — a 60°C rise in water temperature increases acoustic velocity by approximately 5%, which would create a proportional reading error without correction. Quality ultrasonic meters include integrated temperature sensors and continuous compensation that corrects for this effect in real time, maintaining accuracy within ±0.5% to ±1.5% across normal industrial operating temperature ranges. For gas measurement, pressure compensation (PTZ correction using AGA-8 equations of state) converts measured volumetric flow to standard conditions regardless of operating pressure — eliminating the systematic error that uncorrected gas measurement at elevated pressure would introduce. This active compensation is a significant advantage over mechanical meters, whose accuracy degrades under variable process conditions in ways that are difficult to detect without independent reference measurement.
10. What documentation and audit trails do ultrasonic systems provide for compliance purposes?
High-precision ultrasonic systems generate comprehensive digital records that directly support regulatory compliance: timestamped measurement logs with configurable storage intervals (from 1-second to 1-hour averages), event logs recording configuration changes and alarm activations, signal quality metrics documenting ongoing measurement reliability, factory calibration certificates with NIST-traceable accuracy data, and on-demand diagnostic reports exportable in formats compatible with common compliance documentation systems. This digital audit trail eliminates the manual log reconstruction that legacy meter compliance documentation requires — a labor burden that typically costs 60 to 150 engineering hours per meter per regulatory audit cycle. For pharmaceutical applications requiring 21 CFR Part 11 compliance, meters with validated software and electronic signature capability provide audit trails that directly satisfy FDA inspection requirements.
This article was developed by the technical and commercial team at أدوات النمل اليشم, a leading manufacturer of electromagnetic, ultrasonic, vortex, and turbine flow meters. For technical consultation, product specifications, or distributor partnership enquiries, visit www.jadeantinstruments.com.