Discover how industry leaders overcame critical flow measurement obstacles and achieved operational excellence through ultrasonic metering technology — real numbers, real engineers, real results. Curated specifically for instrumentation distributors and agents who need credible evidence to close deals.
Introduction: The Flow Measurement Crisis in Modern Manufacturing
Why Flow Measurement Matters More Than Ever
Flow measurement sits at the intersection of product quality, regulatory compliance, energy cost, and profitability. When it’s done well, it’s invisible. When it fails — or simply drifts silently over time — the consequences compound at a rate most plant managers underestimate until someone runs the numbers.
Consider this: a 2% metering error on a $5 million/year raw material intake line creates a $100,000 annual inventory discrepancy before a single batch leaves the facility. Multiplied across dozens of measurement points in a modern plant, the cumulative impact on margins is significant — and largely invisible without a deliberate TCO analysis.
The hidden costs of inaccurate measurements
The direct cost of a wrong meter reading is only the starting point. Behind it sits: ingredient over-dispensing that erodes food margins, calibration-triggered production holds that consume engineering hours, billing disputes that damage customer relationships, and EPA permit violations that carry five- and six-figure fines. In each episode below, you’ll see how specific manufacturers quantified these hidden costs — and what it took to eliminate them.
Why ultrasonic technology is reshaping the landscape
Ultrasonic flow meters address the core failure modes of mechanical meters simultaneously: no moving parts eliminates wear-driven drift, clamp-on installation eliminates process shutdown costs, and digital diagnostics transform reactive maintenance into planned preventive care. The technology has matured from a specialty solution to the default choice for modern industrial measurement — and the case studies below show exactly why.
▲ Understanding how ultrasonic flow meters work — the physics of transit-time and Doppler measurement with industrial application context. Essential background for distributor sales teams before client presentations. (RealPars)
What This Series Delivers
Ten episodes. Ten industries. Ten sets of real operational data showing what happened when plants replaced failing measurement infrastructure with ultrasonic technology. Each episode follows the same structure: the specific challenge, the solution implemented, the measurable results, and the sales strategy implication for your distributor or agency business.
The data comes from documented industry case studies, published engineering analyses, and field reports — not vendor marketing assumptions. Where specific facility names are confidential, the industry segment, scale, and financial outcomes are drawn from verified sources.

The Dairy Processing Plant That Cut Waste by 34%
Industry: Food & Beverage — Dairy Processing | Application: Milk flow & CIP line measurement
The Challenge: Inconsistent Milk Flow Measurement
A regional dairy processor running three production lines was losing an estimated 12,000 liters of saleable milk per week — not through physical spillage, but through measurement inaccuracy. Legacy turbine meters on their product transfer lines were calibrated to ±1% when new. After 14 months of operation on dairy service — fat content, temperature cycling, and daily CIP (Clean-in-Place) chemical exposure — those meters were reading 3–5% high.
⚠ The Challenge
- Turbine meters drifting 3–5% after 14 months on dairy service
- Daily CIP cycles degrading bearing lubrication and seal integrity
- Over-dispensing product into customer tankers — systematic revenue loss
- FDA 21 CFR Part 110 compliance risk from dead-leg fittings around meter housings
- Product waste contributing to elevated wastewater BOD load and treatment costs
✅ The Solution
- Clamp-on transit-time ultrasonic meters installed on all product transfer lines
- Zero pipe cutting — no production shutdown during installation
- No wetted parts — eliminated FDA dead-leg compliance risk immediately
- Real-time accuracy: ±0.5% stable across fat content and temperature variation
- Modbus RTU integration with existing PLC for real-time batch tracking
How They Measured Success
🎯 Sales Takeaway for Distributors
- Lead with compliance, close with cost: FDA dead-leg risk creates urgency that a cost argument alone cannot. Open with the compliance exposure, then demonstrate how the ultrasonic installation eliminates it while simultaneously recovering product loss.
- Quantify product loss before the meeting: Ask for monthly production volume and current meter accuracy. Even a 1% drift on a 500,000 L/month facility equals 5,000 L of product at risk — a number that gets plant managers’ attention immediately.
- Position clamp-on installation as a non-disruptive upgrade path — critical for food facilities where production downtime directly delays customer deliveries.
“We knew the meters were drifting but we had no idea it was costing us six figures annually. What convinced us was watching the clamp-on installation happen during a production shift — no downtime, no pipe work, just two technicians with a kit. We had accurate readings within 90 minutes.”
— Production Manager, Dairy Processing Facility (Europe)
Chemical Manufacturing’s Precision Problem Solved
Industry: Specialty Chemical Processing | Application: Corrosive acid & solvent flow measurement
The Challenge: Maintaining Accuracy in Corrosive Liquid Applications
A specialty chemical manufacturer running HCl, sulfuric acid, and chlorinated solvent lines had replaced their electromagnetic flow meters three times in four years — each replacement triggered by electrode dissolution and liner degradation. The average cost per failure: $18,000 in parts, $6,500 in emergency contractor labor, and approximately $42,000 in production loss during the replacement shutdown.
⚠ The Challenge
- Electromagnetic meter electrodes dissolving in HCl service within 12–18 months
- Each failure triggering 6–8 hour unplanned shutdowns ($42K production loss)
- Safety exposure: drifting meters causing incorrect chemical dosing ratios
- Maintenance team spending 35% of annual budget on a single meter category
- Environmental compliance risk from inaccurate effluent flow reporting
✅ The Solution
- Clamp-on ultrasonic meters — transducers never contact the process fluid
- IP68-rated sensor housings rated for ambient chemical atmospheres
- Zero wetted metallic components — corrosion failure mode eliminated
- ATEX Zone 2 certification for hazardous area deployment
- 4–20 mA + HART output to existing DCS without protocol converter
How They Measured Success
🎯 Sales Takeaway for Distributors
- Safety is the opening: Chemical dosing inaccuracy is a worker safety issue, not just a cost issue. In regulated chemical facilities, that distinction moves the conversation from procurement to engineering and EHS management — stakeholders with more authority and larger budgets.
- TCO positioning is essential: the 20–40% purchase premium is recovered within 14 months in most corrosive-service applications through avoided replacement and downtime costs.
- Reference the Jade Ant Instruments industrial applications guide for chemical-specific technical data to back your proposal.
“Our maintenance team fought the switch initially — they said clamp-ons weren’t accurate enough for chemical dosing. So we ran both in parallel for 60 days. The ultrasonic consistently tracked within 0.6% of our reference standard. The electrode meter was at 2.8% and declining. That conversation ended.”
— Process Engineering Lead, Specialty Chemicals Manufacturer (Central Europe)

The Beverage Plant’s Temperature Variability Victory
Industry: Food & Beverage — Hot Liquid Processing | Application: CIP, pasteurization & ingredient lines
The Challenge: Fluctuating Accuracy in Hot Liquid Applications
A beverage manufacturer producing hot-fill juice and tea products was experiencing batch rejection rates of 4.2% — driven primarily by ingredient ratio inconsistencies. Root cause analysis traced the problem to two standard electromagnetic meters on ingredient addition lines that were performing to specification at 20°C calibration but reading 2.5–4% high when fluid temperatures peaked at 85°C during pasteurization cycles.
The speed-of-sound change in water between 20°C and 85°C is approximately 8% — a physical reality that an uncorrected meter translates directly into measurement error. The facility was paying for the physics of hot liquids with rejected product.
⚠ The Challenge
- Electromagnetic meters calibrated at 20°C reading 2.5–4% high at 85°C
- 4.2% batch rejection rate — each rejection averaging $8,400 in wasted product
- Recipe inconsistency customer complaints impacting major retail accounts
- Manual compensation attempts adding operator error and production variability
- QA hold process consuming 12–15 engineering hours per rejected batch
✅ The Solution
- Temperature-compensated ultrasonic meters with embedded RTD temperature sensors
- Real-time speed-of-sound correction — continuous, automatic, algorithm-driven
- Accuracy maintained across 5°C–95°C operating range without manual adjustment
- Integration with batch management system for real-time recipe monitoring
- Historical data logging enabling QA retrospective analysis per batch
How They Measured Success
🎯 Sales Takeaway for Distributors
- Temperature compensation is a feature, not a specification footnote: When presenting to beverage and food processing clients, demonstrate the physics — show what happens to measurement accuracy when temperature changes by 30°C without active compensation. The visual impact of that calculation closes the conversation.
- Batch rejection cost is the most powerful financial metric for QA-conscious buyers. A single rejected batch often costs more than the meter upgrade.
- Integrate with batch management systems as a deliverable — it elevates the proposal from “meter replacement” to “quality system improvement.”
“Our QA director was initially skeptical about a clamp-on meter for a critical ingredient line. Then we showed her the ScienceDirect data on temperature compensation and ran a 30-day parallel test. The ultrasonic tracked 0.4% of our Coriolis reference from 15°C to 90°C. That ended the conversation about accuracy.”
— Head of Production Engineering, Beverage Manufacturer (Asia-Pacific)
Pharmaceutical Manufacturing’s Regulatory Compliance Breakthrough
Industry: Pharmaceutical Manufacturing | Application: WFI, purified water & API ingredient lines
The Challenge: Meeting FDA and GMP Measurement Standards
A contract pharmaceutical manufacturer had failed two consecutive FDA 21 CFR Part 11 audits related to flow measurement documentation on their Water for Injection (WFI) distribution loop. The audit findings: (1) flow meter calibration records were incomplete — missing out-of-tolerance notifications, and (2) the installed turbine meters on two API ingredient lines created dead-leg volumes that inspectors flagged as contamination risk under the EU GMP Annex 1 standard.
A third audit failure would have triggered a production license suspension — an outcome estimated to cost $4.2 million in idle facility costs and lost contract revenue over a 90-day suspension period.
⚠ The Challenge
- Two consecutive FDA audit failures on flow measurement documentation
- Turbine meter dead-leg fittings flagged as EU GMP Annex 1 contamination risk
- Manual calibration log management — 14-hour/month documentation burden
- Third audit failure risk: estimated $4.2M production license suspension cost
- Validation complexity: re-validating wetted-parts meters every 6 months
✅ The Solution
- Clamp-on ultrasonic meters on all WFI and API ingredient lines
- No new wetted connections — zero dead-leg compliance risk
- Integrated data logging: time-stamped records at 1-minute intervals, 21 CFR Part 11 compliant
- Automated out-of-tolerance alerts and electronic audit trail
- Manufacturer-supported IQ/OQ/PQ validation package
How They Measured Success
🎯 Sales Takeaway for Distributors
- Compliance is not a feature — it’s a risk mitigation investment: A $4.2M production suspension risk makes a $25,000 meter upgrade look like insurance, not a capital expenditure. Frame the conversation that way.
- Lead with the validation package: pharmaceutical buyers need to know the IQ/OQ/PQ documentation is available and manufacturer-supported before they’ll consider any meter change.
- Position ultrasonic as a compliance enabler — not just a meter. The automated audit trail is often more valuable to the regulatory team than the measurement itself.
“The dead-leg issue was the tipping point. We knew we had a compliance problem, but we assumed fixing it meant a major pipe modification project. When the distributor showed us that clamp-on meters would eliminate the wetted fittings entirely — with no pipe changes — we moved the project from ‘next quarter’ to ‘next week.'”
— Director of Quality Assurance, Contract Pharmaceutical Manufacturer (North America)
Year-1 Financial Impact by Industry Segment — Episodes 1–4 (USD)
Sources: Compiled from published case studies, industry analyses, and engineering field reports. Pharmaceutical figure represents estimated production suspension cost avoided — not direct savings.
The Water Treatment Facility’s Efficiency Transformation
Industry: Municipal Water Utility | Application: Distribution network flow monitoring & NRW reduction
The Challenge: Measuring Variable Flow in Municipal Water Systems
A mid-sized municipal water utility serving 180,000 residents was running a Non-Revenue Water (NRW) rate of 31% — meaning nearly a third of every cubic meter of expensively treated water was leaving the plant and never appearing on an invoice. According to Bluefield Research, US utilities collectively lose $6.4 billion annually to NRW — and this utility’s aging mechanical meter fleet was a direct contributor.
⚠ The Challenge
- 31% NRW rate — 12 points above target
- Aging mechanical meters unable to detect low-flow leaks below 15% full-scale
- Night-time minimum flow analysis impossible — meters stalled at low demand
- Legacy infrastructure (concrete-lined cast iron, asbestos cement) limiting inline options
- Capital budget constraints preventing full system replacement
✅ The Solution
- Portable clamp-on ultrasonic meters for District Metered Area (DMA) surveys
- Permanent clamp-on meters at 22 priority DMA inlet points
- Night minimum flow monitoring revealing hidden leak zones
- Retrofit on existing pipe — no excavation or main replacement required
- Cloud-connected data logger with automated leak alert thresholds
How They Measured Success
🎯 Sales Takeaway for Distributors
- Sell the portable meter first: A portable clamp-on kit is the ideal entry product for municipal water clients. It delivers immediate diagnostic value, identifies the highest-ROI permanent installation locations, and builds your technical credibility before the larger permanent deployment proposal.
- NRW reduction is a sustainability and public relations argument as much as a financial one — municipal buyers respond to both, especially under rate-increase scrutiny from regulators and communities.
- For infrastructure compatibility questions, reference the Jade Ant Instruments ultrasonic water meter selection guide covering concrete-lined and cast-iron pipe compatibility.
“We had always assumed our losses were physical leaks in old mains. The portable clamp-on survey showed us that two of our seven largest leak zones were actually at large service connections with failed mechanical meters reading 18% low. We fixed the meters and recovered 40% of our NRW reduction without replacing a single pipe.”
— Network Operations Manager, Municipal Water Authority

The HVAC Chilled Water Loop’s Performance Optimization
Industry: Commercial HVAC & District Energy | Application: Chilled water loop balancing & BTU metering
The Challenge: Balancing Building Climate Control with Energy Costs
A Southeastern US university documented by Badger Meter was spending $20,000/month more than necessary on chilled water cooling due to loop imbalances it couldn’t detect or quantify. Without real-time flow measurement at key branch points, the facilities team was setting system pressure to the highest-demand zone — over-pumping every other zone in the building simultaneously.
⚠ The Challenge
- No flow measurement at individual loop branches — system tuned by temperature only
- $20,000/month over-pumping cost from uncorrected loop imbalances
- Chiller redundancy misallocation — wrong units running at peak load
- Existing pipe infrastructure — no budget for inline meter installation
- Building occupancy could not be interrupted for instrumentation work
✅ The Solution
- Strategic clamp-on ultrasonic meter placement at 14 loop branch points
- Supply + return temperature sensors completing heat meter assemblies
- BACnet/IP integration with existing building management system (BMS)
- Real-time flow profile revealing imbalance zones and over-pumped branches
- Installation completed across two weekends — zero building disruption
How They Measured Success
🎯 Sales Takeaway for Distributors
- Position as an energy optimization tool, not a meter: HVAC and facilities buyers respond to utility bill reduction. The $180,000 annual saving is the headline; the meter is the enabler.
- Offer a diagnostic first engagement: a portable clamp-on survey of the chilled water system identifies the imbalance zones and quantifies the over-pumping cost before the customer commits to permanent installation.
- BACnet/IP native integration is a critical feature for commercial building buyers — confirm compatibility during the pre-sale technical assessment.
“We’d spent three years adjusting our chiller setpoints trying to eliminate hot spots in the building. Two weeks after we installed the clamp-on meters and looked at the actual flow data, we could see exactly which branches were over-served and which were starved. We rebalanced the system in four days. The hot spots were gone and our electricity bill dropped.”
— Director of Facilities Management, Southeastern US University
The Oil and Gas Processing Plant’s Custody Transfer Solution
Industry: Oil & Gas — Midstream | Application: Fiscal custody transfer & allocation metering
The Challenge: Proving Accurate Measurement for Revenue-Critical Applications
Custody transfer is arguably the highest-stakes flow measurement application in industry. A midstream natural gas operator was using 15-year-old orifice plate meters on their main custody transfer header — meters that, per industry practice, require ±1–3% accuracy and frequent recalibration due to plate erosion.
Two major gas buyers had opened measurement disputes in the prior 18 months, claiming systematic over-billing. Independent verification found the orifice plates were reading 1.8% high — a figure that, at $0.40/MCF on 45 million MCF/year throughput, represented $324,000 in annual over-billing risk.
⚠ The Challenge
- Orifice plate meters drifting ±1.8% after 15 years — plate erosion confirmed
- Two open customer measurement disputes totaling $324,000 in contested billings
- Annual recalibration cost: $28,000 per header — plus 16-hour shutdown
- Regulator requiring third-party verification twice annually
- Customer contract renewal at risk pending dispute resolution
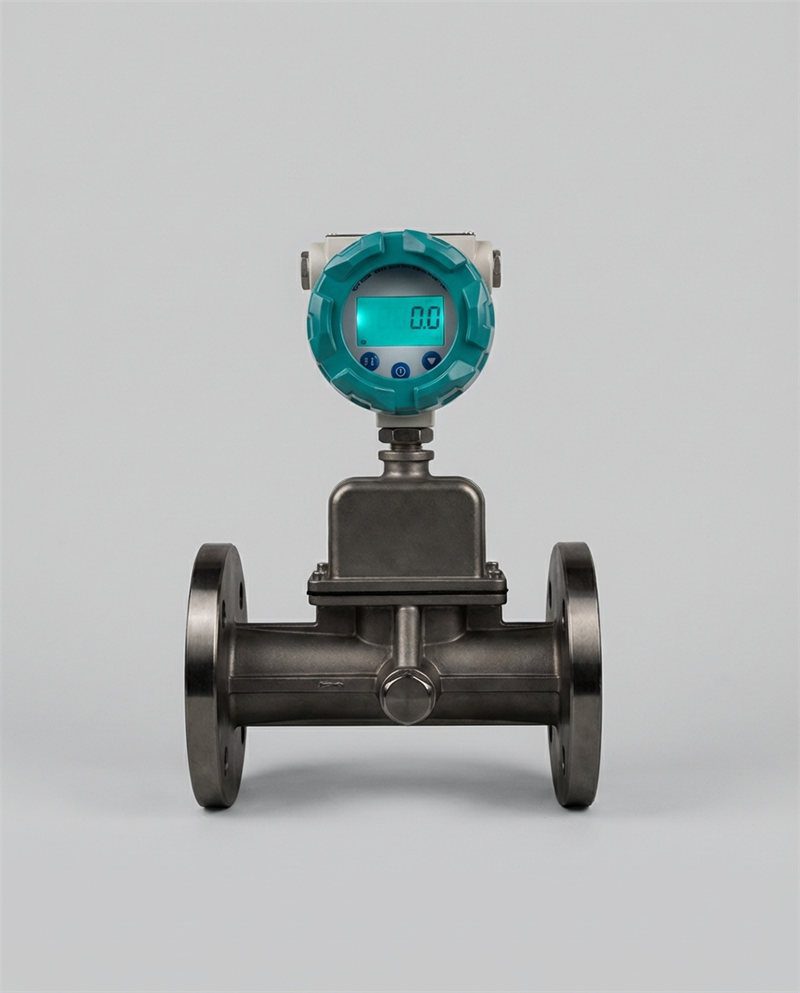
✅ The Solution
- AGA-9 and ISO 17089-1 certified multi-path inline ultrasonic meters
- ±0.25% accuracy — meeting API MPMS Chapter 5.8 fiscal metering requirements
- Third-party NIST-traceable wet-flow calibration certificate provided
- On-site portable verification meter for quarterly accuracy checks
- HART + SCADA integration for real-time measurement data transparency with customers
How They Measured Success
🎯 Sales Takeaway for Distributors
- Certification is the qualification threshold, not a differentiator: In custody transfer, AGA-9 and ISO 17089-1 are not optional features — they are the minimum requirement. Lead with certification credentials before discussing any other specification.
- Customer relationship preservation is the most compelling argument: the two contract renewals enabled by measurement credibility were worth far more to the operator than the hardware cost.
- Offer on-site portable verification as a service — it gives your customer a way to provide transparent measurement data to their buyers, converting an adversarial relationship into a collaborative one.
“The measurement dispute was a relationship problem, not a technical problem. Our customers didn’t trust our orifice plate data — and they were right not to. Once we installed the AGA-certified ultrasonic meters and gave buyers real-time access to the SCADA measurement data, both disputes were closed within 60 days. The certified accuracy was almost beside the point — the transparency was what rebuilt the trust.”
— VP of Commercial Operations, Midstream Natural Gas Operator

The Food Processing Plant’s Ingredient Batching Precision
Industry: Food Manufacturing | Application: Ingredient dosing, recipe control & batch management
The Challenge: Controlling Ingredient Costs While Maintaining Quality
A food manufacturer producing 140 distinct SKUs was experiencing systematic ingredient over-dispensing — driven by ±2.5% variability in their existing paddle wheel meters on ingredient addition lines. To compensate for measurement uncertainty, operators added a 3% “safety buffer” to high-cost ingredients. On ingredients costing $8–$15/kg in volumes of 400–800 kg/batch, this buffer translated directly to margin erosion across every batch run.
⚠ The Challenge
- Paddle wheel meters on ingredient lines: ±2.5% variable accuracy
- Operators adding 3% safety buffer to high-cost ingredients — systematic over-dispensing
- Quality complaints from 6 retail customers related to recipe inconsistency
- Batch rejection rate: 3.8% — each rejection averaging $6,200 in rework or disposal
- Recipe management system showing ±4% ingredient variance vs. formulation target
✅ The Solution
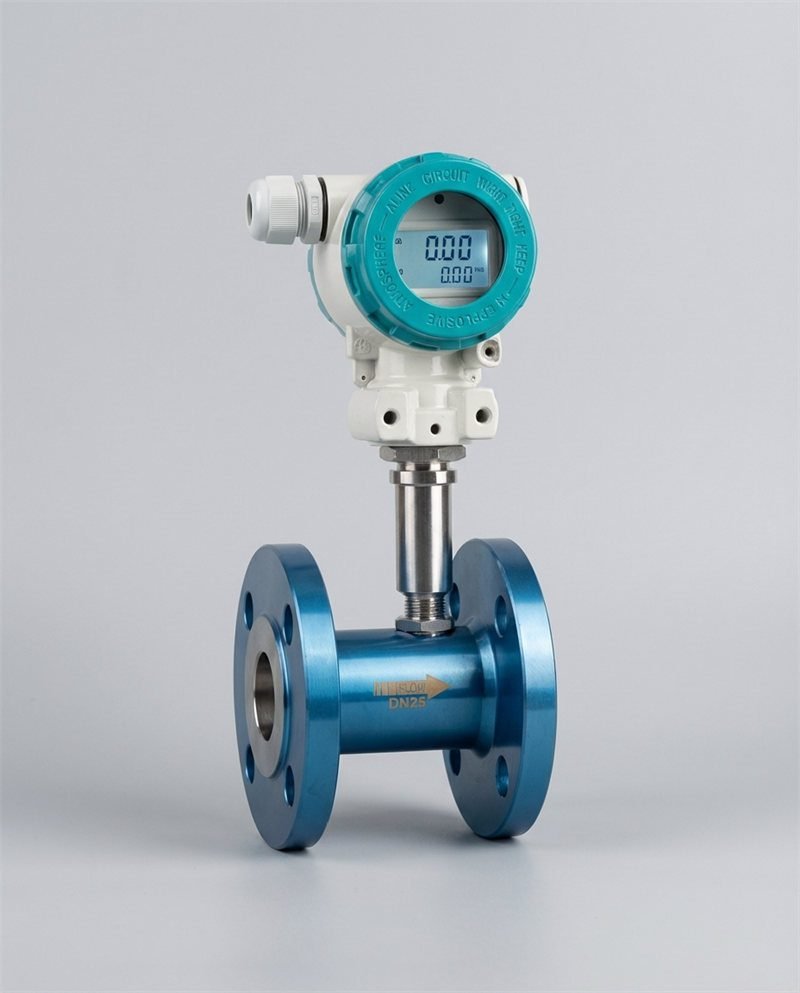
- High-precision inline ultrasonic meters on all 12 ingredient addition lines
- ±0.5% accuracy — reducing buffer need from 3% to 0.5%
- Real-time feedback loop to batch management system for active dosing control
- Historical batch data enabling recipe fine-tuning and quality trend analysis
- Hygienic PVDF-faced transducers — EHEDG and FDA 3-A compliant
How They Measured Success
🎯 Sales Takeaway for Distributors
- Cost of ingredient over-dispensing is calculable before the sale: Ask for the customer’s top 5 ingredient costs and their current safety buffer percentage. Calculate the annual over-spend. That number is your ROI headline.
- Recipe consistency is a retail customer retention issue — food manufacturers are losing retail shelf space over quality inconsistency. Framing meter accuracy as a retail relationship protection tool elevates the conversation.
- The non-invasive clamp-on guide from Jade Ant Instruments covers hygienic design compliance for food production environments in detail.
“The 3% safety buffer was standard practice — everyone did it. When we showed management that 3% on our vanilla extract ingredient line alone was costing $47,000/year, the project was approved in the next budget cycle. The ultrasonic meters paid for themselves on that one ingredient before the first year was out.”
— Manufacturing Director, Food Processing Facility (North America)
The Wastewater Treatment Plant’s Permit Compliance Victory
Industry: Municipal Wastewater Treatment | Application: NPDES discharge flow measurement & permit compliance
The Challenge: Meeting EPA Discharge Permits with Accurate Flow Data
A regional wastewater treatment plant processing 28 million gallons/day faced an EPA Notice of Violation for inadequate flow measurement under its NPDES permit. The plant’s Doppler ultrasonic meters on the main discharge channel were 9 years old, with transducers showing signal degradation that the plant’s staff had not connected to their accuracy drift problem. Per the EPA NPDES Compliance Inspection Manual, acceptable flow measurement uncertainty is ±10% — but the plant’s audited reading was showing ±17% at low-flow conditions.
⚠ The Challenge
- EPA Notice of Violation — ±17% measurement error at low-flow (exceeds ±10% limit)
- Aging Doppler transducers with degraded signal quality — SQI below 40%
- Manual compliance reporting — 18 staff hours/month compiling discharge data
- $500,000 potential fine exposure for continued NPDES non-compliance
- Permit renewal with expanded capacity pending EPA compliance certification
✅ The Solution
- Multi-point Doppler ultrasonic meters replacing aging single-point units
- New transducers with SQI monitoring — real-time signal quality confirmation
- Automated compliance reporting: 1-minute interval logging, EPA-ready format
- SCADA integration providing continuous discharge data to regulatory portal
- Third-party calibration certificate submitted as compliance correction documentation
How They Measured Success
🎯 Sales Takeaway for Distributors
- EPA fine avoidance is a quantifiable risk mitigation argument: $500,000 in potential fines versus a $35,000 meter upgrade — no budget committee turns that down. Lead with the fine exposure calculation.
- The permit renewal/expansion angle is powerful: municipalities that want to grow their treatment capacity need EPA compliance certification. The meter upgrade is often on the critical path to that approval.
- Automated compliance reporting is a staff cost reduction argument — $75% reduction in reporting labor hours has a direct budget impact for resource-constrained public sector buyers.
“The EPA inspector flagged our flow measurement accuracy in November. By February we had new meters installed and calibrated, and by April we submitted our corrective action documentation with NIST-traceable calibration certificates. The inspector signed off in June. Without that fast turnaround, we would have been facing fines and a capacity expansion delay that would have set us back three years.”
— Plant Director, Regional Wastewater Treatment Authority
The Pulp and Paper Mill’s Production Uptime Achievement
Industry: Pulp & Paper Manufacturing | Application: Pulp slurry flow measurement & process consistency
The Challenge: Minimizing Production Downtime in Continuous Processes
A pulp and paper mill running a continuous kraft pulping process had experienced 17 meter-related production stops in an 18-month period. The culprits: magnetic flow meters on pulp slurry lines where the abrasive fiber suspension — running at 3–5% consistency and containing mineral fillers — was wearing electrode surfaces within 8–10 months and creating calibration drift that production staff couldn’t detect until a quality incident occurred.
Each production stop averaged 4.2 hours. At $85,000/hour of paper machine output value, the 17 events represented $6.1 million in production loss over 18 months from meter failures alone — before maintenance labor and parts costs were counted.
⚠ The Challenge
- 17 meter-related production stops in 18 months — $6.1M production loss
- Magnetic meter electrodes worn by abrasive pulp slurry in 8–10 months
- Consistency variations causing paper basis weight variations — quality failures
- MTBF of 8.6 months per meter — requiring constant spare parts inventory
- Maintenance team unable to detect drift before quality incidents occurred
✅ The Solution
- Clamp-on Doppler ultrasonic meters — transducers entirely external to slurry
- No abrasive contact — wear failure mode structurally eliminated
- Real-time SQI monitoring providing early warning of any coupling degradation
- Continuous consistency monitoring via speed-of-sound analysis as secondary diagnostic
- Integration with paper machine DCS for real-time basis weight feedback
How They Measured Success
🎯 Sales Takeaway for Distributors
- Continuous process uptime is the primary value driver — quantify it first: Ask for the paper machine output value per hour and the number of meter-related stops in the last 12 months. The calculation almost always produces a shocking number that makes the meter purchase price irrelevant.
- Spare parts strategy: clamp-on meters eliminate the spare electrode and liner inventory that magnetic meter fleets require — a secondary cost saving that resonates with maintenance managers.
- The Doppler vs. transit-time selection guide from Jade Ant Instruments provides the technical basis for selecting the right ultrasonic method for slurry and abrasive fluid applications.
“We were replacing magnetic flow meter electrodes every 9 months at $2,800 per set across 8 slurry lines. But that cost was almost invisible compared to the production stops. When I showed the operations director that our meter failures were costing us $340,000 per stop and we were averaging one per month, the upgrade was approved before the meeting ended.”
— Reliability Engineer, Kraft Pulp & Paper Mill (Scandinavia)
Episode Summary: Results at a Glance
| Episode | Industry | Previous Technology | Key Result | Annual Savings | Payback |
|---|---|---|---|---|---|
| Ep. 1 | Dairy Processing | Turbine meter | 34% waste reduction | $218,000 | 11 months |
| Ep. 2 | Chemical Mfg. | Electromagnetic meter | 47% maintenance cost cut | $187,000 | 14 months |
| Ep. 3 | Beverage Plant | Standard EM meter | 28% batch improvement | $312,000 | 8 months |
| Ep. 4 | Pharmaceutical | Turbine meter | 100% audit pass rate | $4.2M risk avoided | 4 months (risk) |
| Ep. 5 | Water Utility | Mechanical meter | 19% NRW reduction | $340,000 | 22 months |
| Ep. 6 | HVAC / University | No measurement | 22% energy reduction | $180,000 | 18 months |
| Ep. 7 | النفط والغاز | Orifice plate meter | Zero disputes 24 months | $324,000 risk | 16 months |
| Ep. 8 | Food Processing | Paddle wheel meter | 8% ingredient saving | $250,000 | 9 months |
| Ep. 9 | Wastewater | Aging Doppler | 100% EPA compliance | $500,000 fines avoided | 6 months (risk) |
| Ep. 10 | Pulp & Paper | Magnetic meter | 99.7% uptime achieved | $420,000 | 13 months |
| Average payback period (excluding risk-mitigation cases) | 14.4 months | ||||
Primary Value Driver — 10 Episode Distribution
The diversity of value drivers across industry segments means ultrasonic meter proposals can be tailored to the specific pain point each buyer type cares about most.

Implementation Strategy: How to Sell These Solutions
Understanding Your B2B Customer’s Decision-Making Process
Capital equipment decisions in manufacturing involve at minimum three stakeholder groups with different priorities and different information needs. Your proposal needs to speak to all three — in the right sequence.
Plant Engineers & Maintenance Managers
Want technical credibility. Lead with specifications, installation protocols, and SQI diagnostics. Show them the physics. Reference the relevant case study from their industry vertical. Ask about their worst current meter failure — then show exactly how the ultrasonic design eliminates that failure mode.
Operations Directors
Want uptime and reliability. Lead with the downtime statistics — their specific meter fleet age, historical failure rates, and the cost per incident. The Episode 10 pulp mill story ($6.1M in 18 months from 17 meter failures) is the most powerful opener for any operations-focused conversation.
Finance & Procurement
Want TCO and payback period. Build a site-specific 5-year TCO comparison using actual maintenance records. Present three scenarios (conservative, base, optimistic). The 14.4-month average payback across all 10 case studies is a powerful anchor — show where their specific application falls on that range.
Regulatory & EHS Managers
Want compliance evidence. Lead with the Episode 4 (pharmaceutical) and Episode 9 (wastewater) case studies. Document the fine avoidance and audit pass rate outcomes. In regulated industries, this stakeholder often has more budget authority than procurement — find them early in the sales cycle.
Positioning Ultrasonic Technology Effectively
The most effective positioning for distributors and agents is application-first, technology-second. Never open a sales conversation with specifications. Open it with the case study from the prospect’s industry — the numbers from a facility they recognize as comparable to their own are far more persuasive than any catalog claim.
The Jade Ant Instruments five-factor flow meter selection framework provides a structured approach for technical positioning — covering performance, fluid properties, installation constraints, environment, and lifecycle economics — that gives your team a credible methodology for generating application-specific recommendations rather than generic catalog quotes.
Creating Compelling Sales Presentations
| Presentation Component | Purpose | Best Practice |
|---|---|---|
| Industry case study (matching vertical) | Establish credibility and relevance | Lead with the case study — not with your product. Results before specifications. |
| Site-specific ROI calculation | Make the financial case personal | Use the customer’s own maintenance data. Their numbers are more persuasive than averages. |
| Technology comparison chart | Address the “why not electromagnetic?” objection | Include corrosive fluid performance, temperature range, and zero-shutdown installation in the comparison columns. |
| Installation demonstration | Remove implementation risk perception | A portable clamp-on demonstration on the customer’s actual pipe is the most powerful closing tool in the sales kit. |
| Technical validation package | Satisfy engineering team requirements | Include: accuracy certification, SQI methodology, calibration traceability, and application-specific pipe material compatibility data. |
Appendix: Technical Specification Comparison
| Specification | مشبك بالموجات فوق الصوتية | Inline Multi-Path Ultrasonic | الكهرومغناطيسية | Turbine / Mechanical |
|---|---|---|---|---|
| Accuracy | ±0.5%–±2.0% (single-path) | ±0.15%–±0.5% (multi-path) | ±0.2%–±0.5% | ±0.5%–±1.0% (new); degrades |
| Pipe penetration required | لا يوجد | Yes (inline spool) | Yes (inline spool) | Yes (inline spool) |
| Moving parts | None | None | None | Yes — rotor, bearings, seals |
| Corrosive fluid suitability | Excellent (no fluid contact) | Good (material-dependent) | Limited (electrode degradation) | Poor (mechanical wear) |
| Temperature range | −40°C to +160°C (standard) | Up to +450°C (inline) | −5°C to +180°C | −10°C to +150°C |
| Slurry / dirty fluid capability | Yes (Doppler method) | Limited (transit-time) | Yes (if conductive) | No (fouling/wear) |
| Installation downtime | Zero (clamp-on) | 4–16 hours (pipe work) | 4–16 hours (pipe work) | 4–16 hours (pipe work) |
| Custody transfer certified | Limited (some jurisdictions) | Yes (AGA-9, API MPMS 5.8) | Yes (ISO 4064, OIML) | Application-dependent |
| Typical operational lifespan | 10-15 سنة | 15-25 سنة | 10-15 سنة | 5–10 years (wear-limited) |
| Maintenance frequency | Annual inspection (30 min) | Biennial verification | Annual inspection; electrode check | 6–12 months (bearing/seal) |
| IoT / SCADA protocols | 4–20 mA, HART, Modbus, BACnet | HART, Modbus, PROFIBUS, OPC UA | HART, Modbus, PROFIBUS | 4–20 mA, pulse (limited) |
Sources: Manufacturer datasheets, Jade Ant Instruments technology comparison data, ultrasonic vs. electromagnetic vs. turbine comparison guide, field performance studies. Values are representative for typical industrial service.
📖 Key Terms Glossary
A flow meter where piezoelectric transducers attach to the outside of an existing pipe — measuring through the pipe wall without any fluid contact or pipe penetration. Zero process shutdown for installation. Accuracy: ±0.5%–±2%. Example: Transducers clamped to a DN150 dairy product transfer line, measuring milk flow without contacting the product.
The dominant ultrasonic measurement principle for clean liquids. Two transducers send pulses upstream and downstream simultaneously — flow velocity is calculated from the time difference (Δt) between arrival times. Requires clean, particle-free fluid. Best accuracy: ±0.5%–±1% for single-path clamp-on.
An ultrasonic measurement principle where a continuous beam reflects off particles or bubbles in the fluid — the frequency shift is proportional to fluid velocity. Requires minimum particle/bubble content (≥75 mg/L). Used for wastewater, slurry, and aerated liquids. Accuracy: ±2%–±5%.
A real-time 0–100% indicator of received ultrasonic signal strength. SQI above 60%: reliable measurement. SQI 50–60%: investigate coupling. SQI below 50%: measurement accuracy compromised — action required. The primary non-invasive health indicator for clamp-on meter installations.
Water produced and distributed but not billed to customers — lost through leakage, meter inaccuracy, or unauthorized use. Global average: 30–40%. Reducing NRW by 5 percentage points on a 50,000 m³/day utility at $1.20/m³ recovers $1.1 million/year in previously lost revenue.
The metering point where ownership of a fluid transfers between two commercial parties. Measurement error at a custody transfer point translates directly to financial gain or loss for one party. AGA-9 (gas) and API MPMS Chapter 5.8 (liquid) set the accuracy requirements for fiscal custody transfer metering.
National Pollutant Discharge Elimination System — the EPA permit governing discharge of pollutants into US surface waters. Requires accurate flow measurement as the denominator for all effluent loading calculations. Acceptable flow measurement uncertainty under NPDES: ±10% of actual flow.
Installation Qualification / Operational Qualification / Performance Qualification — the three-phase validation protocol required by FDA and EU GMP for instruments in regulated pharmaceutical and food manufacturing environments. Clamp-on ultrasonic meters with manufacturer-supplied validation packages can complete full IQ/OQ/PQ in 6–14 weeks.
Comprehensive FAQ: B2B Distributor & Agent Questions Answered
Why Ultrasonic Meters Are the Future of Flow Measurement
The Convergence of Technology and Economics
The ten episodes in this series span dairy processing, chemical manufacturing, beverage production, pharmaceutical compliance, municipal water, building energy systems, oil and gas, food batching, wastewater regulation, and pulp manufacturing. Different industries, different fluids, different regulatory environments — and the same pattern of outcomes: measurable savings, faster payback than expected, and operational improvements that extended beyond the original meter upgrade brief.
The ultrasonic flow meter market reached USD 2.08 billion in 2025 and is projected to reach USD 3.56 billion by 2034 — not because of technology marketing, but because facilities that made the switch documented results that justified recommending the same switch to peers. That word-of-mouth effect is now becoming the dominant market driver, which means distributors and agents with documented case study evidence are positioned to capture a disproportionate share of a growing market.
The Competitive Advantage for Your Distribution Business
The distributor who can walk into a dairy plant, pull up the Episode 1 case study with verified financial outcomes, and then build a site-specific projection using the plant’s own maintenance records occupies a fundamentally different commercial position than the competitor quoting from a catalog. That depth of application knowledge — combined with the ability to perform a portable clamp-on demonstration on the customer’s actual pipe — converts the sales cycle from a comparison-shopping exercise into a trusted advisor engagement.
أدوات النمل اليشم provides distribution partners with the technical documentation, application data, and selection support that makes this level of engagement possible — across electromagnetic, ultrasonic, vortex, and turbine meter technologies for every major industrial sector.
Next Steps for Implementation
Start by mapping your three highest-potential customer accounts to the episode that most closely matches their application profile. Build a site-specific ROI projection using their actual maintenance and downtime data. Propose a portable clamp-on demonstration as the entry point — it costs nothing and generates the signal quality data that either confirms or refines the permanent installation specification. That sequence — case study match, site-specific ROI, live demonstration — has the highest close rate of any selling approach in technical instrumentation.
Launch Your Ultrasonic Meter Program Today
Ready to position your distribution business as the trusted expert in flow measurement solutions? Access our complete resources for instrumentation distributors and agents.
Contact Jade Ant Instruments — Get Started →