The global differential pressure flow meter market was valued at USD 3.1 billion in 2024 and is forecast to exceed USD 5.0 billion by 2033. That number tells one story. Here is a more useful one for distributors and agents: differential pressure (DP) technology accounts for the largest single share of all industrial flow measurement installations worldwide — ahead of electromagnetic, vortex, ultrasonic, and Coriolis combined on a unit basis.
Why? Because no other flow measurement principle offers the same combination of: zero moving parts, compatibility with gases, liquids, and steam, proven standards (ISO 5167, API MPMS), and a price point accessible to every industrial segment.
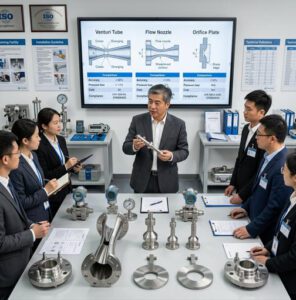
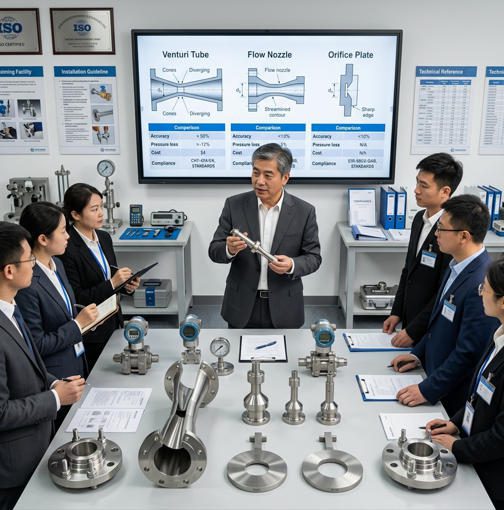
This guide gives distributors and agents a complete, field-grounded command of DP flow measurement — from the physics of Bernoulli’s principle through Venturi meters, flow nozzles, and orifice plates, all the way to SCADA integration, calibration, and regulatory compliance. Every section is designed to help you speak your client’s engineering language, recommend the right device, and build the kind of technical reputation that generates repeat business.
🔍 Market Insight: Oil and gas remains the single largest end-use segment for DP flow measurement — but water & wastewater, chemical processing, and power generation together represent a growing 55–60% of new installations. Distributors who can serve all four sectors with technically appropriate DP solutions have a structurally larger addressable market than those who specialize in only one.
Understanding the Fundamentals of Differential Pressure Flow Measurement

What is Differential Pressure Flow Measurement?
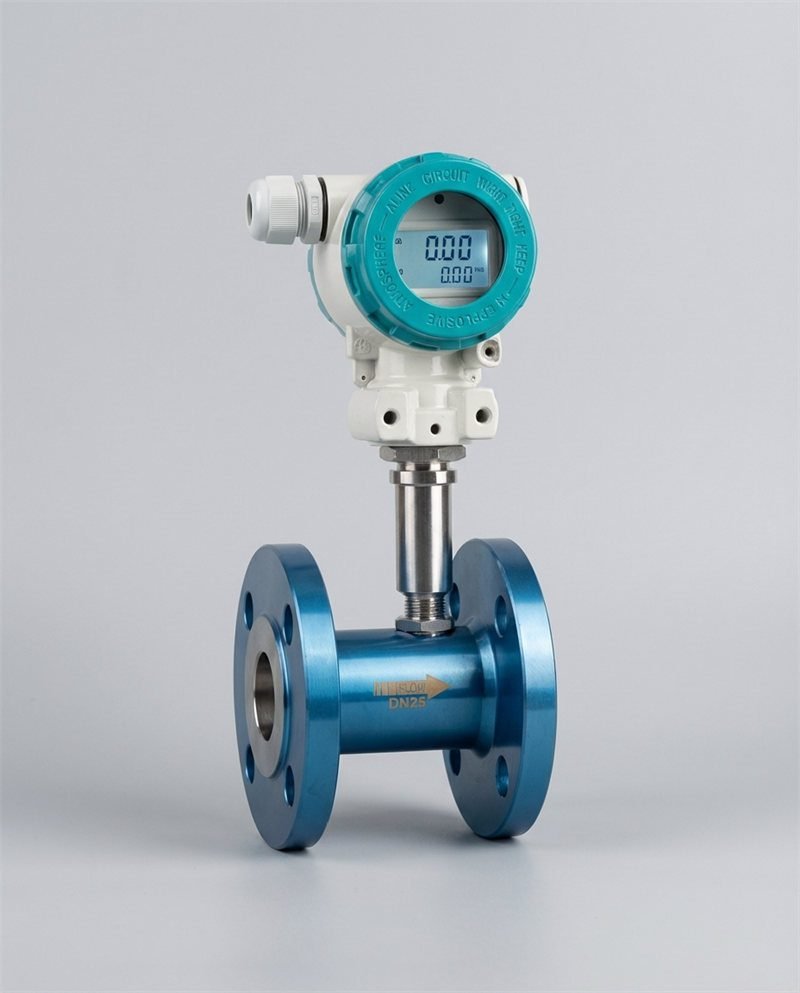
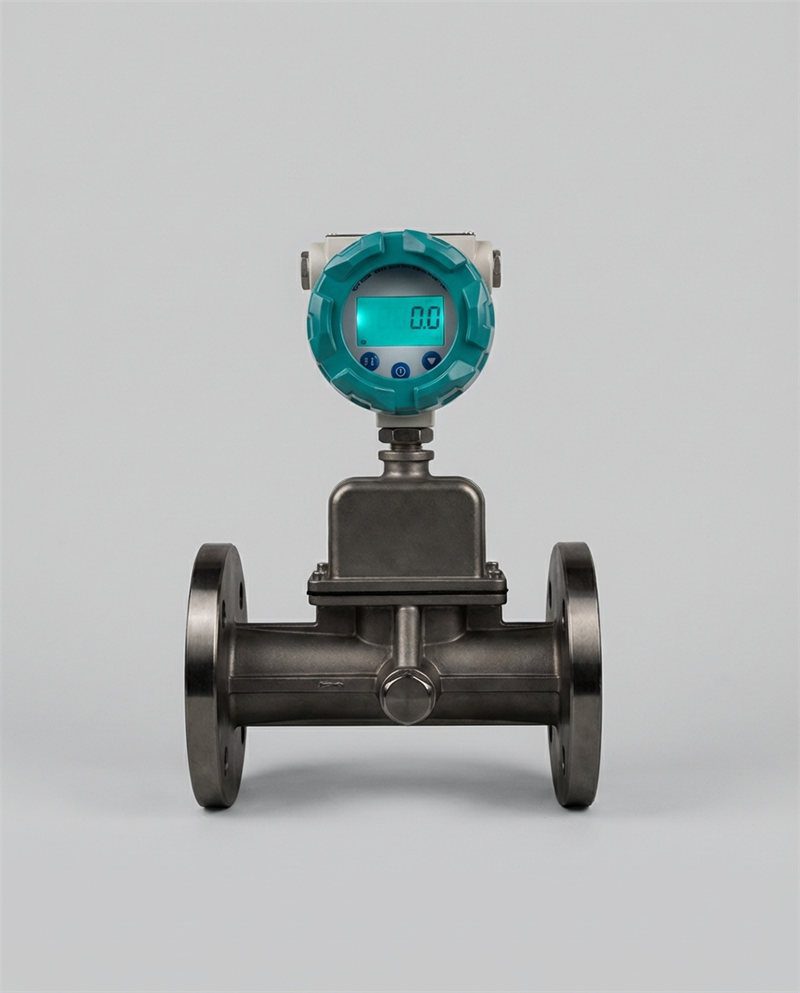
Differential pressure (DP) flow measurement is a method of determining fluid flow rate by measuring the pressure difference (ΔP) created when a flowing fluid passes through a deliberate restriction in the pipe. That restriction — the primary element — accelerates the fluid, drops its pressure, and creates a measurable signal that is mathematically related to the flow rate.
The primary element (Venturi tube, flow nozzle, or orifice plate) creates the pressure difference. A DP transmitter (a precision electronic instrument) measures that difference. A flow computer or transmitter converts the ΔP reading into a flow rate using the governing equations. Together, these three components form the complete measurement loop.
The elegance of DP flow measurement is its universality: the same physical principle applies whether you are measuring water in a municipal main, natural gas in a custody-transfer station, steam in a power plant, or solvent in a chemical reactor. The primary element changes to match the application; the underlying physics does not.
📖 Key Terms — Defined at First Use
- Differential Pressure (ΔP): The pressure difference between two measurement points — upstream (high pressure) and downstream (low pressure) — across a flow restriction.
- Primary Element: The mechanical device installed in the pipe to create the ΔP signal (e.g., Venturi tube, flow nozzle, orifice plate).
- Beta Ratio (β): The ratio of the restriction throat diameter to the pipe internal diameter. Determines measurement sensitivity and pressure loss.
- Discharge Coefficient (Cd): A dimensionless factor that corrects the ideal flow equation for real-world fluid behavior at the restriction.
- Reynolds Number (Re): A dimensionless value describing whether flow is smooth (laminar) or turbulent, affecting Cd and measurement accuracy.
- Permanent Pressure Loss: The portion of the created ΔP that is not recovered after the primary element — representing energy permanently consumed by the measurement.
- Impulse Line: Small-bore tubing connecting the process pressure taps to the DP transmitter.
Why Differential Pressure Technology Matters for Your B2B Clients
DP flow measurement is not simply a legacy technology surviving on inertia. It is the dominant approach for a set of practical reasons that still apply in 2025 and will continue to apply into the next decade.
First, it is standards-governed. ISO 5167, API MPMS, and ASME standards define exactly how to size, install, and calculate DP devices — giving industrial clients a verifiable compliance path that technologies without established standards cannot offer. Second, it is technology-agnostic with respect to fluid: the same Venturi meter or flow nozzle design works for water, gas, oil, steam, or mixed-phase fluids, as long as the density and viscosity are known. Third, it is field-proven: DP measurement systems installed in the 1980s and 1990s are still running accurately in power plants and chemical facilities today — if maintained correctly.
For your clients — plant engineers, procurement teams, and project managers — these characteristics translate to lower regulatory risk, easier auditing, and predictable long-term performance. For you as a distributor or agent, they mean a clear technical story, documented performance data to share, and a customer base that re-orders every 5–15 years as systems are upgraded or expanded.
The Complete Comparison: Venturi Meters vs. Flow Nozzles vs. Orifice Plates
| Criterion | Venturi Meter | Flow Nozzle | Orifice Plate |
|---|---|---|---|
| Typical accuracy | ±0.5–1.0% | ±0.5–1.0% | ±0.5–1.5% |
| Permanent pressure loss | 5–15% of ΔP | 30–45% of ΔP | 60–80% of ΔP |
| Initial equipment cost | Highest | Medium | Lowest |
| Physical size / pipe length required | Largest (5–8× pipe D) | Medium (0.5–2× pipe D) | Smallest (plate only) |
| High-temp / high-pressure suitability | Good | Excellent | Good |
| Erosion resistance | Good | Excellent (solid body) | Poor (sharp edge) |
| Dirty / abrasive fluid tolerance | Good | Moderate | Poor |
| Turndown ratio | 3:1 – 5:1 | 4:1 – 5:1 | 3:1 – 4:1 |
| ISO 5167 standard part | Part 4 | Part 3 | Part 2 |
| 10-year TCO vs. orifice plate | Lowest (energy savings) | Lower (maintenance savings) | Highest (energy penalty) |
Venturi Meters: Design, Advantages, and Best-Use Applications
A Venturi meter consists of three sections machined or cast into a single body: a converging inlet cone that gradually narrows the flow, a cylindrical throat where the maximum velocity and minimum pressure occur, and a long diverging outlet cone that gradually expands the flow back to full pipe diameter.
That diverging recovery section is the Venturi’s defining advantage. By allowing the fluid to re-expand gradually, the Venturi recovers 85–95% of the differential pressure it creates. In plain terms: the fluid uses almost all the energy it borrowed from the pipe to generate the measurement signal — very little is wasted as turbulence and heat. For a large municipal water main flowing at 5,000 m³/h, the difference between a Venturi and an orifice plate in annual pump energy cost is typically USD 15,000–40,000 per measurement point, depending on local electricity pricing.
The trade-off is physical size and cost. A Venturi tube for a DN 300 pipe is typically 1.5–2.5 meters long and may weigh 50–150 kg. It costs 3–5× more than an equivalent orifice plate upfront. For brownfield retrofit projects with limited space or tight capital budgets, Venturi meters are frequently eliminated from consideration not because they are the wrong technical choice — they often are the right choice — but because the project economics favor a smaller initial outlay even at higher long-term cost.
Ideal applications for Venturi meters: large-diameter water and wastewater pipelines where pump energy cost is a primary operating expense; clean liquid applications with stable flow conditions; slurry applications (the smooth internal profile resists blockage better than orifice plates or flow nozzles); and facilities with ISO 50001 energy management certifications that require minimum measurement system energy waste.
Flow Nozzles: Performance Characteristics and When to Recommend Them
A flow nozzle is a solid-machined primary element with a smooth, bell-shaped converging inlet leading to a cylindrical throat. Unlike the Venturi, it has no diverging recovery section — the throat discharges directly into the downstream pipe, creating more turbulent re-expansion and a moderate (not exceptional) pressure recovery of 55–70%.
The nozzle’s solid body is its most important characteristic in demanding service. With no thin plate geometry and no sharp edge, it resists thermal distortion, pressure surges, and erosive wear far better than an orifice plate. This makes it the default choice for steam flow measurement in power generation, high-velocity gas on compressor discharge lines, and any high-temperature application where an orifice plate’s thin geometry creates durability concerns. The flow nozzle meter’s advantages in high-temperature service have been validated across thousands of power plant and petrochemical installations globally.
Ideal applications for flow nozzles: steam flow in power generation (main steam, boiler feedwater, hot/cold reheat); high-pressure, high-temperature gas measurement; applications requiring better erosion resistance than orifice plates can provide; and retrofit situations where a Venturi meter’s physical size cannot be accommodated but better performance than an orifice plate is required.
Orifice Plates: Cost-Effectiveness and Installation Considerations
An orifice plate is the simplest possible primary element: a flat disc with a precisely machined circular bore, clamped between two pipe flanges. The bore creates a sharp restriction, accelerating the fluid and generating a measurable ΔP. The entire orifice plate for a DN 100 pipe can be held in one hand and costs USD 80–300.
That simplicity is its greatest strength and its most significant limitation. Because orifice plates are cheap, standardized (ISO 5167-2, API MPMS 14.3), and universally understood by instrument technicians, they dominate applications where cost-efficiency matters more than energy efficiency. A plant with 200 flow measurement points and a capital budget of USD 400,000 will typically choose orifice plates — not because they are the best technical choice for each point, but because they are the only technically acceptable choice at that budget level.
The sharp upstream edge is the orifice plate’s Achilles heel. Erosion, scale buildup, and thermal distortion all attack that edge — and each millimeter of edge radius growth shifts the discharge coefficient and biases the flow reading. In clean, low-velocity, moderate-temperature applications, an orifice plate in SS 316 can last 10+ years without significant degradation. In steam service, wet/abrasive fluid applications, or high-velocity gas, the edge degrades measurably within 6–24 months.
Ideal applications for orifice plates: natural gas custody transfer (API MPMS 14.3); clean water flow monitoring for process control (non-custody); compressed air systems; chemical process lines with clean, non-erosive fluids; and any application where rapid, low-cost replacement is the primary operational requirement.
Venturi Meter
Pressure Budget
Recovers 85–95% of ΔP.
Lowest long-term energy cost.
Flow Nozzle
Pressure Budget
Recovers 55–70% of ΔP.
Balanced energy vs. durability.
Orifice Plate
Pressure Budget
Recovers only 20–40% of ΔP.
Highest pump energy cost.
Permanent pressure loss as a percentage of created ΔP at beta ratio = 0.6. Source: Engineering ToolBox / ISO 5167 engineering reference.
How Differential Pressure Flow Measurement Works: The Physics Behind the Technology
📺 Venturi Tubes, Orifice Plates, and Flow Nozzles — a clear visual explanation of how all three DP primary elements create and measure differential pressure. Ideal for training new technical sales staff.
Bernoulli’s Principle and Pressure Drop Principles
Bernoulli’s principle states that in a flowing fluid, an increase in velocity is accompanied by a decrease in static pressure. When a fluid is forced through a restriction (the primary element throat), it must speed up to maintain the same mass flow through a smaller cross-sectional area — and as it speeds up, its static pressure drops. The pressure tap on the upstream side measures the high-pressure, slow-moving fluid; the pressure tap at the throat measures the low-pressure, fast-moving fluid. The difference between these two readings is the differential pressure (ΔP).
The key relationship is: flow rate is proportional to the square root of differential pressure. This non-linear relationship has an important practical implication — at 50% of maximum flow, the DP signal is only 25% of its full-scale value. At 25% flow, DP is only 6.25% of full scale. This is why DP measurement systems lose accuracy at very low flow rates, and why specifying the correct transmitter range is critical for applications with wide flow turndown requirements.
Flow Rate vs. Differential Pressure — The Square Root Relationship
ΔP varies with the square of flow rate. At 50% flow, DP signal is only 25% of full scale — this is why DP systems need high-rangeability transmitters for applications with wide flow variation.
Calculating Flow Rate from Differential Pressure Readings
The ISO 5167 flow equation for volumetric flow (Q) through a primary element is:
Where: Q = volumetric flow rate (m³/s); Cd = discharge coefficient (device-specific, defined by ISO 5167); ε = expansibility factor (= 1.0 for liquids; < 1.0 for compressible gases); d = throat or bore diameter (m); ΔP = differential pressure (Pa); ρ = fluid density at flowing conditions (kg/m³); β = beta ratio (throat diameter / pipe diameter).
In practice, modern DP transmitters and flow computers perform this calculation continuously using real-time ΔP, pressure, and temperature inputs. For your clients, the practical implication is: the flow computer must be programmed with the correct Cd, β, and d values specific to the installed primary element — these are not interchangeable between devices without reconfiguration.
Understanding Reynolds Number and Flow Regimes
The Reynolds number (Re) describes the nature of flow in a pipe — specifically, the ratio of inertial forces (driving flow forward) to viscous forces (resisting flow). The formula is: Re = (ρ × V × D) / μ, where V = fluid velocity, D = pipe diameter, and μ = dynamic viscosity.
At low Re (below ~2,300), flow is laminar — smooth, parallel streamlines with a parabolic velocity profile. At high Re (above ~4,000), flow is fully turbulent — chaotic mixing with a relatively flat velocity profile. The transition zone between 2,300 and 4,000 is unpredictable and should be avoided in precision flow measurement applications.
Why does this matter for DP flow measurement? Because the discharge coefficient (Cd) of every primary element varies with Reynolds number, particularly at low values. ISO 5167 specifies minimum Reynolds numbers for each device type: typically Re > 10,000 for orifice plates, Re > 50,000 for flow nozzles, and Re > 200,000 for Venturi tubes in critical applications. Operating below these thresholds degrades accuracy — and this is the primary reason that DP devices are not the right choice for highly viscous fluids (oils above 50 cP, for example) without appropriate selection of a low-Re-capable device type.
Selecting the Right Differential Pressure Device for Your Client’s Needs

Assessing Fluid Type, Temperature, and Pressure Requirements
The fluid’s physical and chemical properties drive the first and most important cut in device selection. Three properties determine which DP devices are technically viable for a given application:
Fluid phase and cleanliness: Gases and clean liquids work with all three device types. Wet steam, abrasive fluids, or fluids with suspended solids above 0.5% by weight eliminate orifice plates from consideration (sharp-edge erosion) and limit Venturi and nozzle options to appropriate materials. Highly contaminated fluids (>2% solids) generally eliminate all three traditional DP devices in favor of Coriolis or electromagnetic meters. For a structured flow meter selection methodology, the fluid properties evaluation should always come first.
Temperature and pressure: Above 400 °C and 200 bar, flow nozzles in appropriate alloys (ASTM A182 F22, Inconel 625) are the dominant choice — solid body construction resists thermal distortion that can permanently deform orifice plates. Venturi meters are viable at these conditions but require custom-engineered body lengths that significantly increase cost. Below these extremes, all three devices are competitive.
Viscosity: Viscosity above approximately 15–20 cP reduces the Reynolds number at typical industrial flow velocities, potentially falling below the minimum Re specified in ISO 5167. Always verify the minimum Re for the selected device and calculate whether it will be achieved at minimum operating flow with the actual fluid viscosity.
| Application Condition | Venturi | Flow Nozzle | Orifice Plate | Best Choice |
|---|---|---|---|---|
| Clean water / light liquid, energy cost priority | ✅ Excellent | ✓ Good | ○ Acceptable | Venturi |
| Steam (high temp/pressure) | ✓ Good | ✅ Excellent | ✗ Poor | Flow Nozzle |
| Natural gas custody transfer | ✓ Good | ✓ Good | ✅ Standard (API MPMS) | Orifice Plate (API) |
| Budget-constrained, clean fluid, process control | ✗ Cost too high | ✓ Good | ✅ Best value | Orifice Plate |
| Moderate slurry / contaminated fluid | ✅ Best DP option | ✓ Moderate | ✗ Poor | Venturi (or EM meter) |
| Large pipe (DN ≥ 300), low-energy budget priority | ✅ Excellent | ✓ Good | ✗ High energy cost | Venturi |
| Confined space / retrofit, moderate conditions | ✗ Too large | ✅ Best fit | ✅ Smallest | Nozzle or Orifice |
Matching Device Selection to Industry-Specific Applications
Industry-specific norms and regulatory standards often override pure engineering optimization in device selection. A distributor who understands these norms can save clients weeks of specification work and avoid the costly mistake of supplying a technically excellent device that fails a regulatory audit.
In oil and gas, API MPMS Chapter 14.3 is the governing standard for natural gas orifice metering — and it specifies orifice plates with specific edge conditions, tap types, and meter tube requirements. Proposing a Venturi tube for a client’s custody transfer station, however technically superior from an energy standpoint, will require a regulatory variance that may not be worth the effort. Know the applicable standard before making a recommendation.
In power generation, ASME PTC 6 governs steam turbine performance testing flow nozzles, and ISO 5167-3 governs all other steam nozzle installations. These standards specify not just the device but the exact geometry, material certification, installation requirements, and calculation methodology. Supplying a flow nozzle without the dimensional inspection certificate to an ASME PTC 6 application will typically result in rejection at the inspection milestone.
In water and wastewater, plant operators often face competing pressures: environmental regulators require accurate flow data with audit documentation, while operations budgets push toward the lowest capital cost. Venturi meters are increasingly winning this market because their low permanent pressure loss directly reduces pumping energy costs — and in water treatment plants running 24/7, that energy saving generates a clear ROI within 2–4 years even at higher capital cost.
Industry Applications: Where Differential Pressure Measurement Delivers Results
DP Flow Meter End-Use by Industry — Market Share Estimate (%)
Estimated DP flow meter market share by end-use industry. Sources: MarketsandMarkets 2024, Differential Pressure Flow Meter Market 2024 research. Figures are approximate.
Oil and Gas: Custody Transfer and Production Monitoring
Oil and gas remains the largest single market for DP flow measurement, driven by the custody transfer requirement: the legal need to measure precisely how much oil or gas changes hands between producer, transporter, and buyer. In natural gas transmission, API MPMS Chapter 14.3 (AGA-3) mandates orifice meter stations with specific dimensional requirements, inspection frequencies, and calculation procedures. A measurement bias of 0.5% on a pipeline flowing 10 million Nm³/day represents approximately USD 15,000–20,000 per day in billing discrepancy at current gas prices — making calibration compliance a financial priority, not just a regulatory formality.
Production monitoring — measuring flow rates at wellheads, separators, and injection systems — has more flexibility in device selection. Here, Venturi meters and flow nozzles compete with orifice plates based on fluid condition and maintenance access. Subsea and remote production facilities increasingly specify flow nozzles over orifice plates because the nozzle’s longer replacement interval reduces the cost and risk of intervention in difficult-to-access locations.
Water and Wastewater: Treatment Plant Optimization
Water treatment plants operate their pump infrastructure at very high utilization — often 20–22 hours per day, 365 days per year. At this utilization, the permanent pressure loss of a primary element is not an engineering footnote — it is a line item in the annual energy budget. A typical DN 400 raw water intake Venturi at a large municipal treatment facility recovering 90% of its ΔP versus an orifice plate recovering 35% at the same location saves approximately USD 12,000–22,000 per year in pump electricity at industrial electricity rates.
Environmental regulators increasingly require treatment plants to document influent and effluent flow data with calibrated instruments and traceable uncertainty budgets — particularly for EPA compliance in the US and equivalent directives in the EU. DP meters satisfy these requirements when properly installed and calibrated to ISO 5167. The documentation package (dimensional inspection records, calibration certificates, uncertainty calculations) is a value-added service that distributors can provide alongside the hardware to strengthen their competitive position.
Chemical Processing: Precise Dosing and Batch Control
Chemical plants demand measurement accuracy across an exceptionally wide range of fluid properties — from low-viscosity solvents at ambient temperature to high-temperature, high-pressure steam in reactor jackets. DP measurement covers a large fraction of this range with a single technology platform: Venturi tubes for large-diameter, high-energy-cost process lines; flow nozzles for high-temperature reactor feeds and steam measurement; orifice plates for budget-constrained utility and process monitoring applications.
For batch processes, the accuracy of flow measurement directly determines product consistency. A polymer plant receiving reactor-feed solvent via a flow meter that reads 2% high will produce batches with 2% excess solvent — outside specification and requiring rework or disposal. Identifying that measurement drift before it affects product quality requires a structured calibration program — something that distributors who offer post-sale calibration verification services can monetize as an ongoing service contract.
Installation Best Practices: Ensuring Accurate Measurements from Day One

Proper Pipe Configuration and Straight-Run Requirements
DP primary elements require a fully developed, undisturbed velocity profile at the measurement point to deliver catalogued accuracy. Any pipe fitting, valve, pump, or diameter change within a certain distance upstream creates velocity distortions that shift the effective discharge coefficient — and those shifts do not show up in transmitter diagnostics. The measurement simply reads wrong, silently, until someone does a calibration check.
ISO 5167 specifies minimum straight-pipe requirements for each disturbance type and device. The table below summarizes the most common cases. All dimensions are in pipe diameters (D = internal pipe diameter).
| Upstream Disturbance | Orifice Plate (β = 0.6) |
Flow Nozzle (β = 0.6) |
Venturi Tube (β = 0.6) |
Downstream (all devices) |
|---|---|---|---|---|
| Single elbow (in-plane) | 18D | 16D | 10D | 6D |
| Two elbows (out-of-plane) | 40D | 35D | 25D | 6D |
| Control valve (fully open) | 44D | 40D | 30D | 6D |
| Gate valve (fully open) | 16D | 12D | 8D | 4D |
| Reducer (2:1 area ratio) | 20D | 18D | 12D | 5D |
| Source: ISO 5167:2022. D = internal pipe diameter. Values shown for β = 0.6; higher beta ratios require longer runs. Always verify against the full standard for your specific combination of device and disturbance. | ||||
Pressure Tap Positioning and Impulse Line Setup
Pressure taps — the small ports that connect the pipe pressure to the impulse lines and transmitter — must be positioned precisely according to the device type. For orifice plates, ISO 5167-2 specifies flange taps (25.4 mm from each plate face), D and D/2 taps (at 1 pipe diameter upstream and 0.5D downstream), or corner taps (immediately at the plate face). Each tap type has slightly different discharge coefficient characteristics — they are not interchangeable without recalculating the sizing.
Impulse lines (the tubing connecting pressure taps to the transmitter) are a critical and frequently neglected part of the measurement system. The most common impulse line problems in field installations are: gas pockets in liquid service lines (causing signal damping and instability), condensate blockages in gas service lines (creating false pressure readings), and partial blockages from scale or debris in process fluid lines (biasing the measurement without triggering any alarm).
For liquid service: slope impulse lines upward from the process tap toward the transmitter, or install vent valves at high points to purge trapped gas. For gas service: slope lines downward toward drain pots to prevent liquid accumulation. For steam service: install condensation pots at equal elevations on both high and low-pressure lines to create balanced liquid legs. The transmitter should always be mounted below the steam pipe in steam service.
Common Installation Mistakes and How to Avoid Them
⚠️ Top 7 Installation Mistakes — And Their Consequences
- Orifice plate installed backwards — creates a completely different (and wrong) flow profile; typically shows 10–30% flow under-reading. Always verify the “+” mark faces upstream.
- Insufficient upstream straight run — the most common cause of systematic flow bias; a 30% shortfall in upstream run can cause 2–4% measurement error in a standard installation.
- Impulse line high points in liquid service — trapped gas creates signal damping, making the transmitter respond sluggishly and giving falsely stable readings during actual flow transients.
- Transmitter mounted above process pipe in steam service — condensate drains away from the transmitter, creating unequal liquid column heights and a permanent ΔP zero offset.
- Gaskets protruding into the bore — even a 1 mm gasket protrusion at a DN 100 flange changes the effective beta ratio, shifting Cd by 0.5–1.5%.
- Pipe internal diameter not measured (using nominal instead) — nominal and actual pipe ID can differ by 2–5% due to schedule, lining, or wall variation; this directly errors the beta ratio calculation.
- Transmitter ranged for maximum possible flow — if the system rarely reaches design maximum, the transmitter spends most of its time reading in the bottom 10–15% of its range, where accuracy is poorest.
Accuracy, Maintenance, and Troubleshooting Differential Pressure Systems
Factors Affecting Measurement Accuracy
The overall measurement uncertainty of a DP flow loop is not a single number from a transmitter datasheet — it is the root-sum-square combination of contributions from every element in the loop. In a well-executed installation with a calibrated transmitter and ISO 5167-compliant primary element, total uncertainty of ±0.5–1.5% of reading is achievable. In a field installation with suboptimal straight pipe, uncalibrated density compensation, and an aging impulse line, the same device type might deliver ±4–8% in practice.
The three largest uncertainty contributors in most DP flow systems are: (1) the primary element discharge coefficient uncertainty (±0.5–1.5% for ISO 5167-compliant devices); (2) installation effects from inadequate straight pipe or disturbances (0–5% depending on severity); and (3) fluid density uncertainty, particularly for gases and steam where density varies with temperature and pressure. Specifying a multi-variable transmitter that simultaneously measures ΔP, static pressure, and temperature — allowing real-time density compensation — is the most effective single step to reduce gas and steam measurement uncertainty.
Preventive Maintenance Schedules and Procedures
| Maintenance Task | Frequency — Clean Service | Frequency — Harsh Service | What to Check / Do |
|---|---|---|---|
| Transmitter zero verification | Every 6 months | Every 3 months | Equalize manifold; verify transmitter reads 0 ΔP; record drift vs. previous check |
| Impulse line inspection | Annual | Every 6 months | Check for leaks, blockages, corrosion; purge lines; verify drain/vent valve operation |
| Primary element inspection | Every 3–5 years | Annual | Visual inspection for erosion, deposits, damage; measure bore/throat if accessible |
| Transmitter full calibration | Every 2–3 years | Annual | Bench calibration against traceable reference; check span and zero; update calibration records |
| Gasket/seal inspection | At every nozzle/plate removal | Replace at every removal | Never reuse high-temperature gaskets; inspect for extrusion into bore |
| DCS/SCADA trend review | Monthly | Monthly | Review ΔP trend at known operating conditions; flag gradual drift for investigation |
For a complete technical framework for managing calibration schedules across different meter types, the flow meter calibration setup guide covers traceability requirements, in-situ verification methods, and documentation standards that are directly applicable to DP systems.
Diagnosing and Resolving Common System Issues
| Symptom | Most Likely Cause | Diagnostic Step | Resolution |
|---|---|---|---|
| Reading consistently high | Primary element erosion; low-side impulse leak | Check for low-side steam/liquid leak; inspect primary element | Repair leak; replace primary element if worn |
| Reading consistently low | Primary element fouling; high-side impulse blockage | Purge impulse lines; inspect primary element throat | Clean impulse lines; clean/replace primary element |
| Noisy, unstable reading | Gas pocket in liquid line; two-phase flow; vibration | Vent impulse line high points; check process for cavitation | Install vent valves; add vibration dampener; increase transmitter damping |
| Zero offset when no flow | Unequal impulse line fill; transmitter zero drift | Equalize manifold; check zero output; compare HP/LP liquid levels | Re-zero transmitter; equalize condensation pots |
| No output / reading frozen | Complete impulse line blockage; transmitter power loss; manifold valve error | Confirm power supply; check manifold valve positions; test transmitter | Restore power; open isolation valves; clear blockage |
| Gradual drift over weeks/months | Progressive primary element fouling or erosion; slow transmitter drift | Compare to DCS trend; cross-check against mass balance or portable meter | Schedule primary element inspection; recalibrate transmitter |
Integrating Differential Pressure Measurement with Modern Control Systems

Connecting to SCADA, PLC, and Data Logging Systems
A DP transmitter produces a measurement signal that must be communicated to the plant control or data acquisition system. The signal type determines the integration complexity, available diagnostic information, and maintenance capabilities — making transmitter selection as important as primary element selection for modern industrial installations.
| Signal Type | Description | Diagnostic Capability | Best Used For |
|---|---|---|---|
| 4–20 mA analog | Industry standard; 4 mA = 0% of range, 20 mA = 100% | None beyond signal level | Legacy systems; simple process control |
| HART (over 4–20 mA) | Digital data superimposed on 4–20 mA loop; bi-directional communication | Configuration, diagnostics, second variable, device health | Most industrial DP applications; HART-7 for advanced diagnostics |
| FOUNDATION Fieldbus | All-digital; multiple variables; onboard control function blocks | Full device diagnostics; multiple process variables simultaneously | High-end process plants; advanced control loops |
| PROFIBUS PA | European industrial bus standard; intrinsically safe version available | Full diagnostics; hazardous area compatible | European chemical and pharmaceutical plants |
| Modbus RTU / TCP | Serial or Ethernet-based; widely used in SCADA systems | Register-based diagnostics; depends on device implementation | Remote monitoring; integration with plant SCADA; data logging |
All instrumentation from Jade Ant Instruments supports 4–20 mA, pulse, HART, and Modbus as standard outputs, with compatibility for SCADA, DCS, and PLC systems across all major industrial platforms. This integration flexibility eliminates the most common obstacle in brownfield upgrades: signal incompatibility with the existing control system.
Signal Conditioning and Transmitter Selection
The DP transmitter is the electronic heart of the measurement loop. For distributors, transmitter selection is often where the greatest value can be added — because clients frequently underestimate the importance of transmitter specifications relative to the primary element.
Key transmitter specifications to match to the application: rangeability (a 100:1 rangeability transmitter can accurately read from 1% to 100% of span — critical for processes with variable flow); static pressure rating (must exceed maximum line pressure, not just differential pressure — a 250 bar static rating is required for high-pressure steam service even if design ΔP is only 50 kPa); temperature compensation (high-quality transmitters compensate for ambient temperature effects on the sensing element, maintaining accuracy across seasonal temperature swings); and multi-variable capability (simultaneous ΔP, static pressure, and temperature measurement for gas/steam mass flow compensation). The smart pressure transmitter comparison guide provides a framework for evaluating these specifications systematically.
Real-Time Monitoring and Predictive Maintenance Strategies
HART-7 and digital bus transmitters push far more than a flow number to the control system. A modern smart DP transmitter continuously logs: ΔP trend data, static pressure at the measurement point, internal electronics temperature, diagnostic flags for sensor drift, and communication health indicators. Platforms that aggregate this data across all DP loops in a plant — plotting ΔP trends at constant flow conditions to detect progressive fouling or erosion — convert the measurement system from a passive indicator into an active asset health monitor.
For distributors, predictive maintenance is a service opportunity: help clients configure their DCS historian to flag DP measurement loops where the trend at standard operating conditions has drifted more than ±1% from the baseline established at commissioning. This automated alert system identifies measurement degradation before it affects process control or regulatory compliance — and it positions you as the technical partner who prevents problems rather than the vendor who shows up after they occur.
Regulatory Compliance and Standards for Differential Pressure Measurement
ISO 5167 Standards and Certification Requirements
ISO 5167:2022 is the primary international standard for DP flow measurement with pressure differential devices in circular pipes with full-bore flow. It consists of six parts: Part 1 covers general principles applicable to all devices; Part 2 covers orifice plates; Part 3 covers nozzles and Venturi nozzles; Part 4 covers Venturi tubes; Part 5 covers cone meters; Part 6 covers wedge meters.
Compliance with ISO 5167 does not require external certification — it is a self-declaration by the manufacturer and installer that the device geometry, installation, and calculation methodology meet the standard’s requirements. However, that declaration must be backed by documented evidence: dimensional inspection certificates for the primary element, pipe internal diameter measurement records, installation drawings showing actual straight-pipe dimensions, and transmitter calibration records. When a client faces a regulatory audit, a measurement point where these records are complete and correct passes in minutes; one where records are incomplete triggers an investigation that can last weeks.
| Standard | Scope | Key Requirement | Region |
|---|---|---|---|
| ISO 5167:2022 | All DP primary elements in circular pipes | Geometry, installation, Cd, uncertainty calculation | Global |
| API MPMS Chapter 14.3 (AGA-3) | Natural gas custody transfer orifice metering | Meter tube spec; plate inspection; calculation method | North America |
| ASME MFC-3M | DP flow measurement in closed conduits | North American equivalent to ISO 5167 | North America |
| ASME PTC 6 | Steam turbine performance testing flow nozzles | Throat-tap nozzle geometry; uncertainty ≤ ±0.25% | Global |
| PED 2014/68/EU | Pressure equipment for European markets | CE marking; conformity assessment; documentation | EU / EEA |
| ISO 50001 | Energy management systems certification | Traceable energy metering; uncertainty budgets | Global |
Documentation and Validation for Audit Readiness
A complete compliance documentation package for a DP flow measurement system includes seven elements: (1) dimensional inspection report for the primary element (CMM preferred); (2) material test reports (EN 10204 3.1 minimum for pressure-retaining components); (3) installation drawing showing actual as-built straight-pipe lengths; (4) transmitter calibration certificate with traceability chain; (5) flow calculation sheet showing Cd, beta ratio, design ΔP, and measurement uncertainty at operating conditions; (6) commissioning record confirming initial zero verification and system functionality check; and (7) maintenance log showing all subsequent verification activities. Distributors who supply this package as standard practice at system delivery differentiate themselves from competitors who ship hardware only — and they significantly reduce client risk at audit time.
Building Your Sales and Support Strategy Around Differential Pressure Solutions

Educating Your Clients on Technology Advantages
The most effective client education for DP flow measurement is financial, not technical. Plant engineers understand engineering; their managers understand money. The conversation that opens budget approval is not “the flow nozzle has a lower discharge coefficient uncertainty than the orifice plate” — it is “upgrading those six orifice plates on your main steam lines to flow nozzles will reduce your annual pump energy cost by USD 18,000, extend your replacement interval from 3 years to 12 years, and eliminate the measurement bias that caused your last billing dispute.”
To have that conversation, you need: the client’s current device type and age, their electricity cost per kWh, their steam or water volume at each measurement point, and an estimate of their current maintenance schedule and replacement cost. With those five data points, you can construct a compelling TCO comparison in 30 minutes using a simple spreadsheet. The clients who receive that analysis — backed by real numbers from their own plant — buy upgrade projects. The clients who receive a product catalog do not.
Developing Technical Specification Sheets for Different Applications
A well-structured specification template for each DP device type — orifice plate, flow nozzle, Venturi — eliminates the most common cause of delivery problems: incomplete application data. The template should capture: pipe internal diameter (measured), fluid type and properties at operating conditions (density, viscosity, phase), operating pressure and temperature (min/normal/max), mass flow range (min/normal/max), available straight pipe (upstream and downstream), flange standard and pressure class, required output signal and communication protocol, applicable standard (ISO 5167 part, API MPMS, ASME PTC 6), and required certification documents.
Distributors who use such templates consistently: place more accurate orders, receive fewer RMAs, generate fewer site support calls, and build a reputation with their supplier (and with their clients’ engineers) as technically reliable partners. That reputation compounds over time — the client who experienced zero commissioning surprises on the first project will give you the next five without going through a competitive tender.
Creating After-Sales Support Protocols and Training Programs
After-sales support for DP flow measurement systems is a revenue opportunity that most distributors leave on the table. The services that create genuine client value — and that clients will pay for — include: annual measurement loop verification (transmitter zero check, impulse line inspection, primary element visual inspection); calibration verification against traceable reference standards; installation qualification reports documenting ISO 5167 compliance; and a spare parts inventory program that guarantees rapid replacement of critical components.
For training your internal team, build capability in three areas sequentially. First, application data collection: ensure every salesperson can ask the right questions to fully define a DP flow measurement application before any product is quoted. Second, device sizing: at minimum, ensure your team can verify that a proposed beta ratio and design ΔP are in the correct range for the application, and can flag obvious mismatches before they become field problems. Third, compliance documentation: train at least one person in your organization to assemble a complete ISO 5167 compliance documentation package — this person becomes your competitive advantage on regulated-industry projects. For deeper technical foundations, the engineer’s guide to flow meter selection covers application assessment methodology that directly maps to DP device selection.
Making Differential Pressure Measurement Your Competitive Advantage
Differential pressure flow measurement — through Venturi meters, flow nozzles, and orifice plates — is not a commodity market. The technical depth required to specify the right device, install it correctly, document it for compliance, and maintain it for long-term accuracy is substantial. Most distributors operate at the commodity end of this market, competing on price for catalog items.
The distributors who build genuine technical expertise — who can walk into a client’s plant, review their P&ID, identify where measurement quality is costing them money, and propose a specification-compliant solution with complete documentation — compete in a different market. They win projects that commodity distributors are never invited to quote on. Their margins are structurally higher. Their client relationships are longer. And every successful project generates documented performance data that accelerates the next sale.
This guide is the foundation of that expertise. The next step is applying it — starting with your existing client portfolio. Identify one client with aging orifice plates in steam service, one with a large-diameter water line, and one in natural gas distribution. Run a TCO analysis for each. Present the results. The conversations that follow will show you precisely where the technical expertise in DP flow measurement creates business value in your territory.
Ready to Make DP Measurement Your Competitive Edge?
Access our complete Differential Pressure Device Selection Matrix, ISO 5167 Compliance Checklist, Installation and Commissioning Worksheets, and Technical Specification Templates — designed specifically for B2B distributors and agents to close deals faster and build lasting client relationships.
Jade Ant Instruments — ISO-certified manufacturer of differential pressure flow elements, electromagnetic meters, vortex meters, and complete measurement systems for global distributors and agents.
📖 Extended Glossary of Differential Pressure Flow Measurement Terms
Vena Contracta
The point downstream of an orifice plate where the jet of fluid has contracted to its minimum cross-section and reached its maximum velocity. Located approximately 0.5–0.7 pipe diameters downstream of the plate. The low-pressure tap in corner-tap installations samples pressure closest to the vena contracta.
Expansibility Factor (ε)
A correction factor applied to the ISO 5167 flow equation for compressible fluids (gases and vapors). For liquids, ε = 1.0. For gases, ε is less than 1.0 and accounts for the density reduction as the gas accelerates through the restriction. Omitting this correction in gas measurement causes systematic under-reading.
Custody Transfer
The legal measurement of a fluid at the point where ownership or financial responsibility changes hands — e.g., at a gas pipeline delivery point or a refinery offtake. Custody transfer measurement has the highest accuracy and documentation requirements of any flow measurement application.
Five-Valve Manifold
A valve assembly with two isolation valves (block the high and low impulse lines), one equalization valve (connects HP and LP lines together for zero verification), and two drain/bleed valves. Allows safe transmitter removal, zero checking, and line purging without shutting down the process line.
Square-Root Extraction
The mathematical operation performed by the flow computer to convert ΔP into flow rate. Since ΔP ∝ Q², the flow rate Q ∝ √ΔP. This extraction must be performed by the flow computer, not pre-applied in the transmitter’s output scaling, to avoid compounding non-linearity errors.
Turndown Ratio
The ratio of maximum to minimum measurable flow at specified accuracy. A 4:1 turndown means the meter reads accurately from 100% down to 25% of design flow. DP meters have inherently limited turndown because ΔP at 25% flow is only 6.25% of design — approaching transmitter noise floor.
Wet Leg
An impulse line filled with liquid (typically condensate or a reference fluid) rather than process gas or steam. Used in steam and high-temperature gas applications where direct contact of process fluid with the transmitter diaphragm is not acceptable. Requires careful equalization of liquid column heights on both HP and LP sides.
HART Protocol
Highway Addressable Remote Transducer. A digital communication protocol that superimposes a digital signal on the standard 4–20 mA analog loop. Allows bi-directional communication for configuration, diagnostics, and secondary variable transmission without changing the existing wiring infrastructure.
Frequently Asked Questions
📚 Downloadable Resources and Further Reading
The following resources are available to support your DP flow measurement specification and sales activities:
📊 Device Selection Matrix
Venturi / Nozzle / Orifice comparison across 20 application parameters
✅ ISO 5167 Compliance Checklist
12-point pre-delivery and post-installation verification list
📋 Application Data Template
Structured RFQ form for accurate DP device specification
🔧 Maintenance Log Template
Audit-ready calibration and maintenance record format
External Technical References:
- ISO 5167-1:2022 — General Principles for DP Flow Measurement
- Engineering ToolBox — Orifice, Nozzle, and Venturi Flow Meter Principles and Calculations
- Jade Ant Instruments — Practical Insights into Differential Pressure Flow Measurement
- Jade Ant Instruments — Complete Flow Meter Selection Guide
- Jade Ant Instruments — How to Read Flowmeter Datasheets: A Complete 2026 Guide
- McCrometer — Learn About Differential Pressure Flow Meters
- Dwyer Omega — Introduction to Venturi Flow Meters, Flow Nozzles, and Orifice Plates