Your customers are losing money to flow measurement inaccuracies caused by temperature and pressure fluctuations. Thermal mass flow meters eliminate this problem entirely—while other technologies force your clients to choose between accuracy and cost. This guide shows distributors and agents exactly how to position thermal mass flow technology as the solution that protects their customers’ bottom lines.
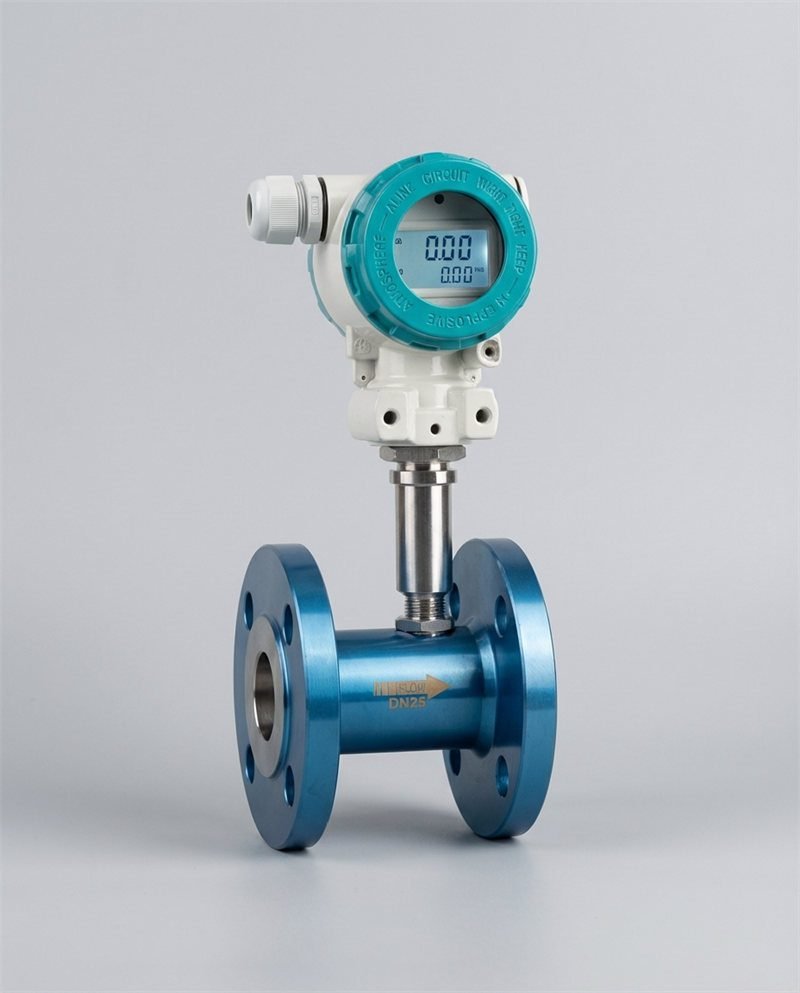
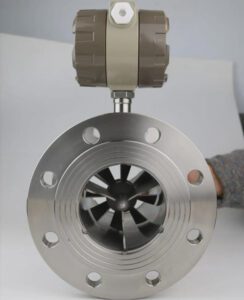
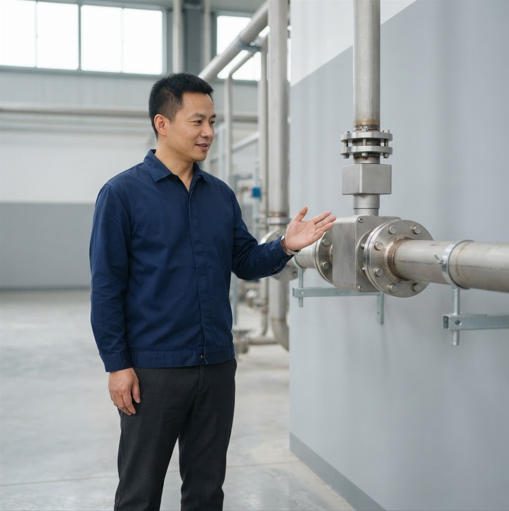
 Thermal mass flow meter on an industrial gas line — direct mass measurement, no temperature or pressure compensation required.
Intro: Why This Matters to Your Bottom Line as a Distributor
Picture this: one of your distribution clients runs a mid-size chemical plant. Their orifice plate meter was calibrated in July. By December, ambient temperatures have dropped 25°C. The gas density has shifted, the viscosity has changed, and the discharge coefficient is now operating outside the range it was calibrated for. The meter is reading 6–8% low. Nobody notices until an annual audit. By then, $40,000–$60,000 in product has been either lost or overbilled, depending on which side of the transaction your client sits.
This is not a hypothetical. It is the single most common complaint raised by industrial plant managers who have been using volumetric flow measurement technologies in variable-condition environments — and it is the single most powerful sales conversation you can have as a distributor or agent in 2026.
Thermal mass flow meters measure mass directly. They are physically decoupled from temperature and pressure variation at the measurement level. No correction factors. No auxiliary sensors. No seasonal recalibration cycles. This guide gives your sales team the technical clarity, scenario-based language, and objection-handling tools to turn that technology advantage into closed deals.
The Hidden Cost Your Customers Don’t See (But You Can Sell Against)
Most purchasing managers at industrial plants evaluate flow meters on sticker price. A turbine meter at $1,800 looks cheaper than a thermal mass meter at $3,200. That comparison is wrong, and you have the data to prove it.
A compressed air system running at 200 SCFM with a turbine meter subject to a 15°C seasonal temperature swing can experience 3–5% measurement drift without any mechanical failure — just physics. At $0.30–$0.50 per 1,000 cubic feet of compressed air generated (a figure cited across multiple energy audits), that 3–5% error in a system running 8,000 hours per year translates to $14,000–$24,000 per year in invisible measurement loss. The turbine meter was never broken. It was just doing what volumetric meters do when conditions change.
Now multiply that across a 15-plant distribution network. Your clients aren’t buying one meter. They’re operating dozens. The cumulative exposure is the number that changes procurement decisions — and your job is to put that number in front of the right person before a competitor does.
What This Guide Covers — And Why Your Sales Team Needs It
This guide is organized as a practical sales toolkit, not a technical paper. It covers:
- Why temperature and pressure changes cause measurable, quantifiable financial losses in orifice plates, turbine meters, and vortex meters — with real scenario data your sales team can reference in discovery calls
- How thermal mass flow meters physically eliminate this problem — explained simply enough to use in a 10-minute conversation with a skeptical plant manager
- Three high-value application scenarios (compressed air, chemical processing, cryogenic) with dollar impact estimates
- A complete objection-handling framework covering the three most common customer pushbacks
- TCO models, ROI timelines, and proposal language that gets approved by finance teams
- A distributor training checklist so your entire team delivers the same message consistently
By the time you finish this guide, you will have a repeatable framework for identifying which customer accounts are bleeding money due to measurement sensitivity — and a structured conversation to close those opportunities.
The Real Problem — Why Temperature and Pressure Changes Wreck Other Flow Meters
How Orifice Plates Fail When Conditions Change
The physics behind pressure drop inconsistency
An orifice plate (a flat plate with a precisely machined hole, inserted perpendicular to flow in a pipe) measures flow by creating a pressure differential — the difference in pressure upstream and downstream of the hole. Flow rate is then calculated using Bernoulli’s equation:
Where is volumetric flow, is the discharge coefficient, is the orifice area, is the measured pressure differential, and is fluid density.
The critical variable here is : fluid density. For gases, density is directly governed by temperature and pressure through the ideal gas law. When temperature rises by 20°C at constant pressure, gas density drops by approximately 6–7%. The meter’s electronics use a fixed or periodically updated density value. If the actual density has shifted and the correction hasn’t been applied, the calculated flow rate carries that same 6–7% error — automatically.
The discharge coefficient also varies with Reynolds number, which is itself a function of fluid viscosity — another temperature-dependent property. At an ISO 5167-compliant installation, the combined uncertainty of an orifice plate under stable conditions is ±0.5–1.0%. Under variable temperature conditions without active compensation, real-world accuracy degrades to ±2–3% routinely, and can exceed ±5% in extreme seasonal shifts.
Real-world scenario: A chemical processing plant losing 8% measurement accuracy in winter
A specialty chemicals distributor in Northern Europe supplied a customer running a continuous gas-phase reactor. The plant used an orifice plate to meter nitrogen feed gas. The meter was calibrated in August at 28°C. By January, the unheated utility header was at 3°C. The density correction hadn’t been updated since installation.
The actual mass flow of nitrogen was consistently 8.2% higher than the meter reported. The reactor was running nitrogen-lean. Product yield fell by an estimated 4.3% over a 12-week winter period before the instrumentation team identified the root cause. The corrective recalibration cost €2,800 in service fees. Lost yield was valued at €38,000. Total avoidable cost: €40,800 — for a €1,200 meter that was functioning exactly as designed.
Why Turbine Meters Give You False Readings
Viscosity changes that destroy repeatability
A turbine meter (a flow meter where a rotor spins in the fluid stream; rotor speed is proportional to volumetric flow) measures volumetric flow by counting rotor revolutions per unit time. The conversion from revolutions to flow rate assumes a known relationship between rotor speed and actual fluid velocity — a relationship defined by the meter’s K-factor, which is itself calibrated at a specific viscosity.
Gas viscosity changes with temperature. For air, viscosity increases approximately 0.3% per 1°C rise in temperature. At first glance that sounds negligible. But turbine meter K-factors are calibrated to within ±0.2% at the factory. A 15°C temperature swing shifts viscosity by roughly 4.5%, moving the meter outside its calibration range and introducing 1–3% additional systematic error. Over 20:1 rangeability (the typical span for a turbine meter), this error is not uniform — it compounds at low flow rates where boundary-layer effects dominate.
Case study: Pharmaceutical distributor’s customer complaint — and how you could have prevented it
A pharmaceutical ingredients manufacturer ran a turbine meter on their nitrogen blanketing system. The system was validated during summer commissioning at 22°C. Over the following months, the uninsulated pipe section feeding the meter experienced temperature swings from 8°C to 34°C across seasonal and diurnal cycles. The K-factor remained fixed at its commissioning value.
When the plant’s quality team ran a mass balance reconciliation during an FDA preparation audit, they identified a 2.7% average systematic error in nitrogen consumption records over 18 months. Correcting the records required a full instrumentation re-validation exercise costing $22,000 in engineering fees, plus a 6-week production audit. The distributor who had supplied the turbine meter lost the account. The replacement supplier led with a thermal mass meter and has since expanded to three additional measurement points at that facility.
Vortex Meters and Their Temperature Sensitivity Problem
Frequency drift in unstable environments
A vortex meter (a meter that places a bluff body — an obstruction — in the flow stream; the meter counts the frequency of vortices shed alternately on either side of the obstruction, which is proportional to flow velocity) is less sensitive to viscosity than turbine meters but introduces a different failure mode under temperature variability: frequency drift and low-flow cutoff instability.
Vortex meters cannot detect flow below a minimum Reynolds number threshold (typically Re > 10,000–20,000 depending on design). As gas temperature drops, density increases and viscosity changes, shifting the Reynolds number for the same volumetric flow. A system that operated comfortably above the cutoff threshold in summer may intermittently drop below it in winter, causing the meter to output zero — even when flow is present. This produces phantom flow interruptions in SCADA systems and corrupts historical consumption data.
The piezoelectric (converts mechanical vibration into electrical signal) sensor elements in vortex meters are also sensitive to thermal cycling. Repeated expansion and contraction of the meter body creates micro-stress at the sensor mounting, causing baseline signal drift that typically manifests as 0.5–1.5% of full-scale measurement error accumulating over 12–18 months.
The cost of recalibration cycles your customers actually face
ISO/IEC 17025-traceable calibration of a 4-inch vortex meter costs $800–$2,500 per event at an accredited flow laboratory. Add removal, shipping, reinstallation, and process downtime, and the true cost per recalibration cycle runs $3,500–$8,000 for a mid-size industrial installation. For a 10-meter network recalibrated annually, that is $35,000–$80,000 per year in maintenance overhead — before any discussion of measurement error losses. Thermal mass meters on the same network, with no moving parts and no temperature-pressure compensation requirement, typically need recalibration every 2–3 years at comparable per-event cost, reducing that annual overhead by 50–67%.
How Thermal Mass Flow Meters Win — The Competitive Advantage You Need to Explain
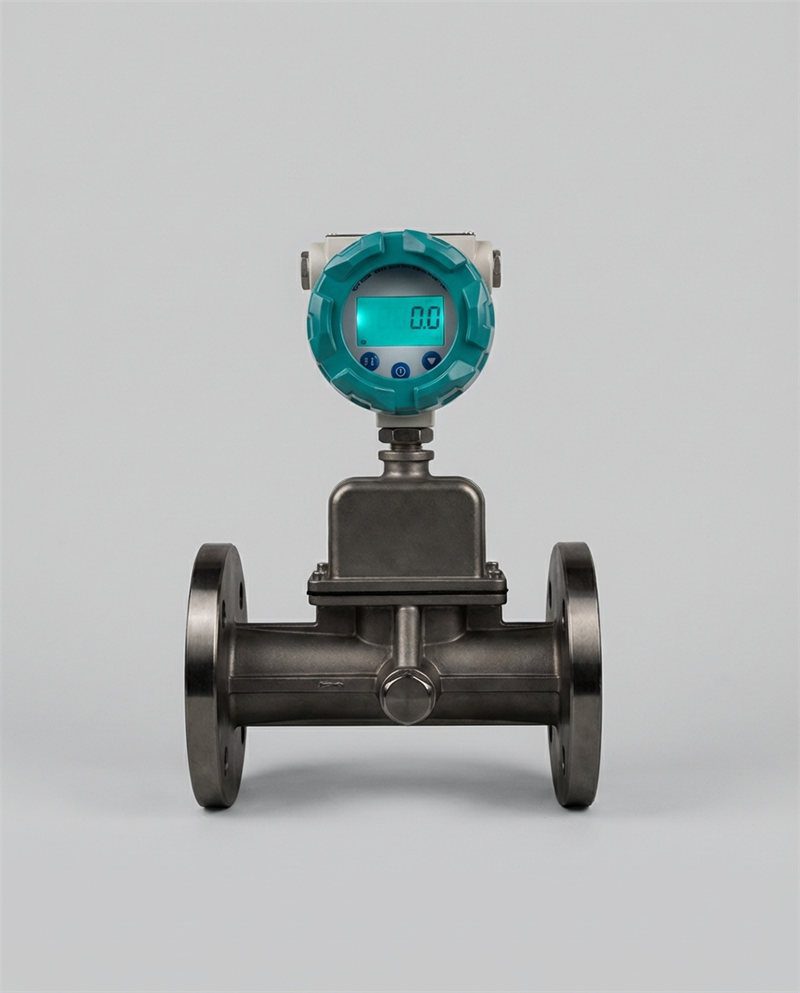
 Insertion-type thermal mass flow sensor: the heated element and reference temperature sensor measure heat transfer rate directly — a quantity that is proportional to mass flow, not volumetric flow.
The Physics That Makes Thermal Mass Independent (Explained Simply for Your Sales Conversations)
Direct mass measurement — why temperature and pressure simply don’t matter
A thermal mass flow meter works on a principle called convective heat transfer. Two sensor elements are inserted into the gas stream: one is heated to a controlled temperature above the gas temperature, and one measures the actual gas temperature. The amount of electrical power required to maintain the heated element at its setpoint temperature is directly proportional to the masa of gas flowing across it per unit time.
The fundamental equation is King’s Law in its mass-flow form:
Where is mass flow rate, is heater power, is the heated sensor temperature, is the gas temperature, and y are calibration constants.
The critical insight for your sales conversations: this equation measures mass flow rate directly. It does not calculate volume and then convert using an assumed density. Temperature and pressure affect how many molecules are packed into a given volume — but the thermal sensor is measuring how many molecules are flowing past it per second by quantifying the energy those molecules carry away. A higher temperature gas with lower density carries the same energy per molecule. A higher pressure gas with higher density carries proportionally more total energy for the same volumetric flow. Both effects are captured intrinsically in the heat transfer measurement.
In practical terms: a thermal mass flow meter calibrated at 25°C and 6 bar will deliver the same ±0.75–1.5% reading accuracy at 5°C and 9 bar — with zero correction factors applied.
Why your customers should care: Accuracy that stays constant regardless of conditions
“Constant accuracy regardless of conditions” is the phrase that resonates with plant engineers who have spent years managing seasonal recalibration schedules and explaining measurement discrepancies to their finance teams. Quantify it: at a plant running 300 days per year with a flow meter subject to ±5% seasonal drift, eliminating that drift recovers the equivalent of 15 full days of accurately measured production data. For a gas-intensive process consuming $500,000 of feedstock annually, that 5% measurement confidence improvement is worth $25,000 — every year, indefinitely.
Real-World Scenarios Where Thermal Mass Outperforms Everything Else
Scenario 1 — Industrial gas applications with wild temperature swings (compressed air systems, nitrogen delivery)
Compressed air is the most universal utility in industrial manufacturing. It is also among the most poorly measured. A 2023 study by the Compressed Air and Gas Institute found that the average industrial compressed air system operates with 20–30% energy waste from leaks and poor load management — and that a significant fraction of that waste is invisible precisely because flow meters are not providing accurate consumption data under varying conditions.
A manufacturing distributor servicing automotive assembly plants in a climate with 40°C annual temperature range (−10°C winter, 30°C summer) will find their clients’ differential pressure meters and turbine meters drifting by 4–8% across seasons. A thermal mass meter on the same header maintains ±1.0% accuracy year-round. For an assembly plant consuming $1.2 million/year in compressed air energy, the measurement improvement alone justifies a $4,000 meter investment within 6 weeks — not 3 years.
Scenario 2 — Cryogenic applications where other meters completely fail
At temperatures below −50°C — liquid nitrogen at −196°C, liquid CO₂ at −57°C, or LNG (Liquefied Natural Gas) at −162°C — turbine meter bearings seize, vortex meter bluff bodies become brittle, and orifice plate coefficients are no longer defined by standard ISO tables. Specialized cryogenic thermal mass meters using inert-gas-purged sensing elements operate reliably down to −200°C. There is no equivalent cost-competitive alternative for this temperature range. When a customer asks “what do we use for our liquid nitrogen transfer line?”, the answer is thermal mass — and only thermal mass.
Scenario 3 — Fluctuating pressure environments (steam, high-pressure processes)
High-pressure batch processing — a 60-bar hydrogen reactor, for example — involves pressure swings of ±10–15 bar between batch load and unload cycles. Every volumetric meter in that system recalculates incorrectly during the transient. A thermal mass meter reads through the transient accurately because the measurement is mass-based: more molecules at higher pressure means more heat transfer, which the meter reports as higher mass flow. The meter is correct. The process engineer can trust the data in real time, not after the batch has been manually reconciled.
The Financial Impact — What You Should Tell Your Customers
Eliminated recalibration costs and downtime
Thermal mass meters with no moving parts (no rotors, no bearings, no mechanical sensors) have a median time between maintenance cycles of 3–5 years in clean gas service. Compare that to turbine meters requiring annual bearing inspection and K-factor verification, or vortex meters requiring sensor element checks every 12–18 months. The per-meter maintenance cost differential is $800–$3,000 per year. Across a 20-meter installation, that is $16,000–$60,000 in annual savings — money that was previously invisible in the maintenance budget.
Reduced product waste from measurement errors
A chemical plant metering $2,000,000/year in process gas through five orifice plates carrying ±4% seasonal measurement error is exposed to $80,000/year in measurement-driven product accounting error. Replacing those five meters with thermal mass meters at $4,000 each ($20,000 total capital) eliminates that exposure. The ROI calculation is not complicated: $20,000 investment, $80,000 annual savings, payback in 3 months.
Lower total cost of ownership over 5+ years
| Componente de coste | Orifice Plate (5-yr) | Turbine Meter (5-yr) | Vortex Meter (5-yr) | Thermal Mass (5-yr) |
|---|---|---|---|---|
| Purchase price (3-inch) | $800–$1,500 | $1,500–$3,000 | $2.000–$4.000 | $2,800–$5,000 |
| Annual calibration/service | $1,200–$2,500 | $1,500–$4,000 | $1,200–$3,000 | $400–$800 |
| 5-year maintenance total | $6,000–$12,500 | $7,500–$20,000 | $6,000–$15,000 | $2.000–$4.000 |
| Temp/pressure compensation hardware | $600–$1,800 | $500–$1,500 | $500–$1,500 | $0 |
| Measurement error loss (annual, 3% drift on $200k flow) | $6,000/yr | $4,000/yr | $3,000/yr | ~$0 |
| 5-year TCO (total) | $37,800–$56,800 | $30,000–$45,500 | $24,500–$37,500 | $13,000–$22,000 |
Note: Measurement error loss values assume ±3% seasonal drift on a system with $200,000 annual gas commodity value. Thermal mass assumes ±0.75% factory-specified accuracy maintained across seasonal range.
The thermal mass meter costs more on Day 1. By Year 3, it is the cheapest meter in the building.
How to Position This Advantage When Selling to Your Distributors’ Customers
The Sales Conversation Framework — What to Say and When
Identifying which customer applications are bleeding money due to temperature/pressure sensitivity
The discovery question that unlocks this conversation is not “what flow meter are you using?” — it is: “How often does your team recalibrate your flow meters, and what triggers the recalibration?”
A customer who answers “every 6 months” or “whenever we notice drift” is describing a volumetric meter in a variable-conditions environment. That answer tells you they are already experiencing the problem. Your follow-up question: “When you recalibrate, what do you typically find — and what does the out-of-tolerance period cost you?”
Most operations managers have never calculated that cost explicitly. Walking them through it — using their own gas commodity price, their own flow rate, and the ±3–5% drift range you know is typical for their meter technology — creates an immediate financial anchor for the thermal mass conversation.
Positioning thermal mass as the “no-excuse” accuracy solution
Avoid positioning thermal mass as a premium product for special applications. Position it as the standard solution for any gas measurement application where conditions vary — which is effectively every outdoor or semi-outdoor industrial installation outside of a climate-controlled laboratory. The “no-excuse” framing: “This meter does not need to be recalibrated when the season changes. It does not need a separate temperature transmitter. It does not need a pressure tap. It reads correctly in January and in July, and the reading it gives you is a mass flow rate — the number your process engineer actually needs, not a volumetric proxy that requires a conversion.”
Common Objections From Customers (And How to Overcome Them)
“Thermal mass is too expensive upfront” — the TCO conversation that wins deals
Lead with the 5-year TCO table above, customized to their specific gas commodity value and meter count. The conversation shifts the moment the customer sees that their “cheaper” turbine meters have already cost them more in maintenance and error losses than a thermal mass system would have over the same period. If they push back on the error-loss calculation, ask for their last two annual calibration reports and calculate the out-of-tolerance exposure together. This is a collaborative analysis, not a sales pitch.
“Our current meter works fine” — until it doesn’t (and the hidden costs that follow)
Acknowledge the statement directly: “It probably is working fine right now — because right now, conditions are close to your calibration conditions. The question isn’t whether it works fine today. The question is: what does ‘works fine’ cost you in January, or during your summer shutdown restart when pressures spike?” If the customer cannot answer that question with confidence, the conversation has moved to the right place.
“We don’t have extreme conditions” — why even mild fluctuations add up
A 10°C seasonal temperature swing — well within the norm for any indoor manufacturing facility with seasonal HVAC loads — produces approximately 3.5% density variation in air at atmospheric pressure. For a plant with $500,000/year in compressed air costs, that is $17,500/year in measurement uncertainty exposure. “Mild” conditions still cost money. The thermal mass meter eliminates that exposure regardless of the magnitude of fluctuation.
Building Your Pitch Around Customer Pain Points, Not Features
Temperature stability = production consistency = revenue protection
Your customers’ finance teams do not care about discharge coefficients or Reynolds number effects. They care about production consistency and revenue protection. Translate: “When your flow meter drifts by 4% in winter, your reactor feed is 4% off specification. If that affects yield by even 1%, and your annual production value is $5 million, that is $50,000 in recoverable revenue. The thermal mass meter costs $4,000.” Revenue protection is a language every finance approver understands.
Pressure independence = predictable costs = better budgeting
Thermal mass meters eliminate the unpredictability in measurement-related costs. No surprise recalibration bills when an audit finds out-of-tolerance performance. No emergency service calls when seasonal drift triggers a quality deviation. Budget-conscious plant managers respond to predictability as strongly as they respond to ROI — because unpredictable costs are the ones that generate the most internal friction and the most damage to the instrumentation department’s credibility.
Animated Scenarios & Visual Explanations Your Sales Team Should Master
 Compressed air headers in an automotive assembly plant: each branch line monitored by a thermal mass meter, enabling real-time leak detection and shift-by-shift consumption accountability regardless of ambient temperature changes.
Scenario Breakdown 1 — The Compressed Air System (Most Relatable for Industrial Distributors)
How daily temperature swings affect competitor meters vs. thermal mass
Consider a 6-inch compressed air main at 7 bar, supplying a manufacturing floor that runs two shifts. The facility is in a temperate climate: 8°C at 6 AM when the compressor starts, 27°C by 2 PM when the building is fully loaded, dropping back to 12°C by 10 PM for the night shift.
A turbine meter on this header calibrated at 20°C will report flow based on a fixed K-factor for 20°C air density (approximately 1.204 kg/m³ at 20°C, 1 atm). At 8°C and 7 bar, actual air density is approximately 9.41 kg/m³. At 27°C and 7 bar, it is approximately 8.93 kg/m³ — a 5.4% difference across a single operating day. The turbine meter’s K-factor does not adjust for this. The readings are off by up to 5.4% depending on time of day, even with the machine running identically.
A thermal mass meter on the same header reads the actual mass of air flowing per second. At 8 AM and at 2 PM, if the same number of kilograms per hour is flowing — which is what the compressor control system targets — the meter reports the same number. The daily temperature swing is invisible to the measurement.
The dollar impact: Show your customer what measurement drift costs them annually
For a facility spending $800,000/year on compressed air energy, a 5.4% peak daily measurement drift creates an annual measurement uncertainty exposure of approximately $43,000. If that uncertainty is systematic (consistently reading low in cold morning conditions), the plant is consistently under-reporting consumption, and the energy management program is making decisions on bad data. The thermal mass investment to eliminate this: 3–4 meters at $3,500–$5,000 each = $10,500–$20,000. Annual savings: $43,000. Payback: 3–6 months.
Scenario Breakdown 2 — The Chemical Processing Plant (High-Value Opportunity)
Why pressure fluctuations during batch processing destroy orifice plate accuracy
A batch reactor for specialty adhesives cycles between atmospheric pressure during loading and 8 bar during the reaction phase, with a 40-minute pressurization ramp. The orifice plate metering nitrogen purge gas is calibrated at 5 bar steady-state. During the pressurization ramp, the actual pressure swings from 1 to 8 bar — a 7:1 pressure ratio. Orifice plate accuracy under these conditions degrades significantly: the calculation assumes a fixed expansion factor (the ratio of gas density at the orifice to density upstream, a number that changes with pressure ratio), and the 5-bar calibration value is wrong for 70% of each batch cycle.
The result: nitrogen consumption is systematically misreported by 12–18% during batch transitions. For a plant running 200 batches per year, consuming $180,000 in nitrogen annually, that is $21,600–$32,400 in measurement error affecting cost accounting, recipe validation, and regulatory reporting.
How thermal mass delivers consistent results — and why that justifies premium pricing
A thermal mass meter on the same nitrogen feed line reads actual mass flow throughout the pressurization ramp. At 1 bar and at 8 bar, the measurement is equally valid because it is based on heat transfer to the gas molecules, not on a calculated conversion from a pressure differential. Batch records are accurate from the first second to the last. Recipe validation data is defensible in regulatory submissions. The $5,500 thermal mass meter pays for itself in less than three months of avoided measurement error costs.
Scenario Breakdown 3 — The Cryogenic Application (Competitive Knockout)
Why turbine and vortex meters fail catastrophically in extreme cold
Turbine meters at cryogenic temperatures face three simultaneous failure modes: bearing lubricants freeze and cease to function (turbine bearings are typically rated to −40°C at best), rotor blade materials become brittle and susceptible to fracture under flow-induced stress, and the thermal contraction of the meter body misaligns the rotor from its calibrated position. A turbine meter specified for −50°C service but deployed at −150°C in an LNG application will fail mechanically within weeks — typically with no warning, because the meter continues to output a signal even as the rotor begins to drag.
Vortex meters face similar issues: the piezoelectric sensor elements experience cracking and delamination at temperatures below −80°C in most commercial designs, and the bluff body mounting structures are subject to thermal stress fracture.
Thermal mass as the only viable solution — and your competitive advantage
Cryogenic-rated thermal mass flow meters use inert-gas-purged sensor elements with no lubricants, no bearings, and no mechanical moving parts. The sensing principle — heat transfer — functions equally well at −150°C as at +50°C. The heated element is maintained at a controlled differential above the process gas temperature regardless of absolute temperature. This is a physical advantage that no volumetric meter technology can replicate in this temperature range.
When your customer’s quote request specifies a cryogenic gas measurement application, thermal mass is not one of several options — it is the correct answer. Competitors offering turbine meters for cryogenic service are either unfamiliar with the application or hoping the customer is. Either way, your knowledge of this failure mode is itself a differentiator that builds lasting technical credibility with engineering teams.
Technical Foundation — What You Need to Know (But Keep Simple for Customers)
The Science Behind Thermal Mass Independence (Without the Jargon)
Heat transfer principles that make temperature irrelevant to mass measurement
The core principle: Newton’s Law of Cooling tells us that the rate of heat transfer from a hot surface to a moving fluid is proportional to the caudal másico of that fluid — not its volume. Specifically, the heat carried away by a flowing gas is:
Where is heat transfer rate (watts), is mass flow rate (kg/s), is the specific heat capacity of the gas at constant pressure (J/kg·K), and is the temperature difference between heater and gas.
The thermal mass meter’s electronics measure directly (by measuring heater power consumption) and divide by the known y to solve for . The gas temperature appears in this equation — but it is measured directly by the reference sensor and used in the calculation in real time. It is not an assumed constant. Temperature variation is thus compensated at the fundamental measurement level, not as an afterthought correction factor.
Why pressure changes affect volume-based meters but not mass-based ones
Increase the pressure of a gas, and you pack more molecules into the same volume. A volumetric meter sees the same number of cubic meters per minute and reports the same volumetric flow rate. But the mass flow rate has increased — there are more molecules (more mass) flowing per unit time. The orifice plate, turbine, and vortex meter all miss this. The thermal mass meter’s heated sensor element is exposed to more molecules per second at higher pressure. Those molecules carry more heat away per unit time. The meter reports higher mass flow. It is correct.
Comparing Technologies Head-to-Head (Use This Chart in Sales Calls)
Orifice plates, turbine meters, vortex meters, Coriolis, and thermal mass — accuracy under temperature/pressure stress
| Technology | Baseline Accuracy | Accuracy with ±15°C Swing | Accuracy with ±20% Pressure Swing | Rangeability | T/P Compensation Required? |
|---|---|---|---|---|---|
| Orifice plate (AGA/ISO) | ±0.5–1.0% | ±2.0–3.5% | ±3.0–5.0% | 3:1 | Yes (mandatory) |
| Contador de turbina | ±0.5% (calibrated) | ±1.5–3.0% | ±1.0–2.5% | 20:1 | Yes (recommended) |
| Vortex meter | ±0.7–1.5% | ±1.5–2.5% | ±1,0–2,01 TP3T | 10:1 | Yes (for mass flow) |
| Coriolis meter | ±0.1–0.3% | ±0.1–0.3% | ±0.1–0.3% | 100:1 | No |
| Thermal mass meter | ±0.75–1.5% | ±0.75–1.5% | ±0.75–1.5% | 100:1 | No (intrinsic) |
Accuracy figures under variable conditions represent typical field performance, not manufacturer specification limits. Sources: Fox Thermal, Bronkhorst, Sierra Instruments, Endress+Hauser field data compilations.
Maintenance costs, recalibration frequency, and long-term reliability
| Technology | Moving Parts? | Recalibration Interval | Annual Maintenance Cost (per meter) | Expected Service Life |
|---|---|---|---|---|
| Placa de orificio | No (plate only) | 1–2 years | $600–$1,500 + plate inspection | 15–25 years (plate) |
| Contador de turbina | Yes (rotor/bearings) | 6–12 months | $1,500–$4,000 | 5–10 years (bearings) |
| Vortex meter | Minimal (sensor) | 12–18 months | $1,200–$3,000 | 8–15 years |
| Coriolis meter | No | 2–3 years | $800–$2,000 | 15–20 years |
| Thermal mass meter | No | 2–3 years | $400–$800 | 10–20 years |
Implementation Guide — How Your Distributors Help Customers Make the Switch
Assessing a Customer’s Current Situation (The Discovery Questions)
What temperature and pressure ranges do they actually experience?
Before recommending any meter, map the actual operating envelope — not the nameplate design conditions. Ask for the process historian data from the last 12 months, specifically the temperature and pressure at the meter location. Many plants will find their “stable” process varies by 12–20°C across seasons and 15–25% in pressure between startup, normal operation, and shutdown. This data becomes the foundation of your ROI case.
How much measurement error can they currently tolerate (and what does it cost them)?
This question reframes the conversation from technical specs to business exposure. A plant manager who says “we can tolerate 2% error” needs to be walked through what 2% error on their specific gas commodity value means in annual dollars. $500,000/year in gas × 2% = $10,000/year in measurement exposure — minimum. Most plant managers have never done this calculation. When you do it with them, the conversation changes.
Building the Business Case — The Proposal Your Customers Will Accept
TCO analysis showing thermal mass ROI within 2–3 years
Structure the proposal in three columns: (1) Current state — meter cost + annual maintenance + recalibration + estimated error losses; (2) Thermal mass investment — purchase price + installation + 5-year maintenance; (3) Year-by-year cumulative savings. Most proposals reach break-even by Year 2 and show 40–60% total savings advantage by Year 5. This format addresses both the operations manager (who cares about maintenance reduction) and the finance team (who cares about NPV and payback period).
Risk mitigation: What happens if they don’t upgrade?
Include a risk section in every proposal. If a metering audit identifies systematic measurement error, what is the retroactive liability? If a product quality event is traced to a measurement deviation, what is the regulatory exposure? These are not scare tactics — they are legitimate business risks that your customer’s risk management function is already thinking about. Thermal mass eliminates both risks simultaneously.
Installation and Integration — Removing Customer Concerns
Thermal mass retrofit compatibility with existing systems
Insertion-style thermal mass meters (meters where the sensor probe is inserted through a port in the pipe wall without cutting the pipe) are available in sizes from ½-inch to 48-inch pipe diameter. They can typically be installed using existing hot-tap fittings or compression fittings without process shutdown. The transmitter outputs (4–20 mA, HART, Modbus, PROFIBUS) are fully compatible with all major DCS (Distributed Control System) and SCADA platforms. Most retrofits can be completed within a single 4-hour maintenance window.
Minimal downtime, maximum confidence
The installation qualification process for a thermal mass meter is simpler than for any volumetric technology: confirm sensor insertion depth, verify zero-flow reading in a blocked-in condition, and confirm span against the factory calibration certificate. No in-situ proving loop required. No differential pressure tap commissioning. The meter is operational and verified within hours of installation.
Infographic & Animation Script — What to Show, What to Say
Visual 1 — The Temperature/Pressure Impact Comparison (Side-by-Side)
How competitor meters drift under changing conditions
The following chart shows representative accuracy performance across a 24-hour operating cycle for a compressed air system with a 19°C diurnal temperature swing (6°C at 0600 to 25°C at 1400). Values represent percentage deviation from true mass flow.
Accuracy Deviation (%) vs. Time of Day — Compressed Air System, 19°C Diurnal Swing
+5% ┤
+4% ┤ ╭──── Orifice Plate (peak: +4.8%)
+3% ┤ ╭────╯
+2% ┤ ╭───╯ Turbine Meter (peak: +3.1%)
+1% ┤ ╭───╯ ╭──────────────────────────╮
0% ┼───╯ ╰──── Thermal Mass (±0.8%) ╯
-1% ┤
-2% ┤
-3% ┤────────────────────────────────────────── Turbine (low)
-4% ┤
-5% ┤
0600 0800 1000 1200 1400 1600 1800 2000 2200
Visual interpretation: Orifice and turbine meter readings drift by 3–5% across the operating day without manual recalibration. Thermal mass meter remains within ±0.8% across the full temperature range.
How thermal mass stays stable — the visual proof that closes deals
When presenting this chart to a plant manager, annotate the Y-axis with dollar values calibrated to their specific commodity cost. “Each 1% on this axis equals $X/day in measurement error for your facility.” The abstract percentage becomes a concrete, daily financial number. Plant managers who see this chart rarely need further convincing — they need a quote.
Visual 2 — The Real-World Application Scenario (Animated Walkthrough)
Time-lapse of a day in a compressed air system: temperature swings, pressure fluctuations, measurement accuracy
A useful visualization for sales presentations: a timeline chart showing four simultaneous data streams across a 24-hour operating period — ambient temperature (°C), system pressure (bar), turbine meter reported mass flow, and actual mass flow (from a reference thermal mass meter). The gap between the two flow readings at any given time represents money. Present this as a “measurement debt” that accumulates throughout the operating year.
Competitor meter accuracy degrading throughout the day vs. thermal mass staying flat
The key visual message: thermal mass flow is a flat line. Every other technology is a moving curve. In a world where your customer’s process engineer needs a reliable baseline to make decisions, the flat line is the product. The curve is the problem.
Visual 3 — The Cost Impact Over Time (Animated Financial Graph)
Year-by-year comparison: competitor meter (recalibration, downtime, product waste) vs. thermal mass (set it and forget it)
| Year | Turbine Meter Cumulative Cost | Thermal Mass Cumulative Cost | Thermal Mass Advantage |
|---|---|---|---|
| Year 0 (purchase) | $2,200 | $4,200 | −$2,000 |
| Year 1 | $9,400 | $6,100 | −$700 |
| Year 2 | $16,600 | $8,000 | +$600 |
| Year 3 | $23,800 | $9,900 | +$13,900 |
| Year 4 | $31,000 | $11,800 | +$19,200 |
| Year 5 | $38,200 | $13,700 | +$24,500 |
Assumptions: $200,000/year gas commodity value, 3.5% average turbine meter error loss, $2,500/year turbine maintenance, $600/year thermal mass maintenance. Thermal mass error losses assumed negligible at ±0.75% accuracy.
ROI breakeven point clearly marked — when thermal mass investment pays for itself
The breakeven point in this model is between Year 1 and Year 2 — specifically at approximately 20 months from installation. Present this breakeven timeline as the headline of your proposal. “You are paying more today and saving more from Month 20 onward, indefinitely.” The indefinitely part matters: a 10-year horizon shows $50,000+ in cumulative advantage on a single 3-inch gas meter.
Distributor Training — How to Equip Your Sales Team
Key Messages Your Team Must Deliver Consistently
Temperature and pressure changes are inevitable — but measurement errors don’t have to be
Every industrial application operates in a real environment. Real environments have seasons, HVAC cycles, process upsets, and startup transients. Volumetric meters measure what the environment gives them, then apply corrections that are never quite right. Thermal mass meters measure what the process gives them, independent of what the environment is doing. Your team must be able to deliver this distinction in two sentences, without jargon, to a plant manager who has five minutes between meetings.
Thermal mass is the only technology that truly decouples accuracy from environmental conditions
Coriolis meters achieve comparable temperature/pressure independence, but at 3–5× the cost and with significant limitations on pipe size availability (most Coriolis meters are limited to 6-inch diameter or below for practical industrial use). For 2–12-inch gas measurement applications, thermal mass is the only technology that delivers ±1% accuracy independent of environmental conditions at a commercially viable price point. This is your competitive moat, and your team needs to own it.
Role-Playing Scenarios — Practice These Conversations
The skeptical operations manager who thinks their current meter is “good enough”
Practice this exchange: Customer: “We’ve been using the same turbine meters for 8 years and we haven’t had any problems.” Distributor: “When did you last run a comparative check against a reference meter during winter conditions?” Customer: “…we haven’t done that specifically.” Distributor: “I’d like to do that with you — we can bring a portable calibrated thermal mass reference and run it parallel to your existing meter for a week. The data will tell us exactly how much measurement deviation you’re carrying, and we can calculate what it’s costing you. If the answer is ‘nothing significant,’ you keep your turbine meters and we’ve both learned something. If the answer is significant, you’ll have a clear business case for the upgrade.”
This approach is non-threatening, data-driven, and positions the distributor as a technical partner rather than a vendor. It also consistently produces compelling ROI data that closes the follow-up conversation.
The budget-conscious plant manager who only sees upfront cost
The single most effective technique: show the 5-year TCO table and ask them to identify which year they want to start saving money. The thermal mass meter costs more in Year 0. In every subsequent year, it costs less. The question is not whether to buy the thermal mass meter — it is when. Most finance-approved plant managers will accept a “delayed start on savings” framing. It transforms the conversation from “this is too expensive” to “let’s decide when to begin the ROI period.”
Certification Checklist — What Your Sales Team Should Know Cold
Your sales team should be able to answer the following questions without hesitation in a discovery call or product demonstration:
- Why does a thermal mass meter not need a separate temperature transmitter or pressure tap? (Because it measures mass flow directly via heat transfer, which is intrinsically proportional to molecular mass flux — not to volume.)
- What is the typical accuracy specification for a thermal mass meter in industrial gas service? (±0.75–1.5% of reading, maintained across the full operating temperature and pressure range.)
- What is the minimum pipe diameter for an insertion-style thermal mass meter? (Typically ½ inch, though 1-inch and above is standard for most industrial applications.)
- What are the three applications where thermal mass has no competitive substitute? (Cryogenic gas measurement below −50°C; batch processes with large pressure transients; clean-room or pharmaceutical nitrogen systems requiring validated, stable mass-based measurements.)
- How do you calculate the measurement error loss for a specific customer? (Annual gas commodity cost × average meter drift percentage = annual exposure. Thermal mass investment ÷ annual exposure = payback period in years.)
FAQ Section — The Questions Your Distributors’ Customers Actually Ask
 Thermal mass meters are routinely specified for chemical plant nitrogen and gas measurement — particularly in batch applications where pressure fluctuates significantly across each production cycle.
1. Why does my current flow meter give different readings at different temperatures if I’m measuring the same flow?
Your current meter most likely measures volumetric flow — the number of cubic meters per minute passing through the pipe. Gas volume changes with temperature because of the ideal gas law (PV = nRT): the same number of molecules (the same mass) occupies a larger volume at higher temperature and a smaller volume at lower temperature. If your meter doesn’t have real-time temperature compensation that continuously corrects the volumetric reading back to mass flow, the reading will drift with temperature — not because the flow has changed, but because the gas has expanded or contracted. Thermal mass flow meters bypass this entirely: they measure the mass of gas flowing per unit time, which does not change with temperature.
2. Can I just recalibrate my orifice plate more frequently to solve temperature/pressure drift issues?
Technically yes, but the economics are punishing. An ISO/IEC 17025-traceable calibration of an orifice plate runs $800–$2,000 per event, plus removal, shipping, reinstallation, and 1–3 days of process downtime. If your seasonal temperature swing is significant enough to drive 3–5% measurement error, you would need to recalibrate at least twice per year to maintain acceptable accuracy — and even then, you’re carrying uncorrected drift for 6 months between events. A thermal mass meter, at roughly $800–$1,200 total maintenance cost per year, eliminates that drift entirely. The recalibration-more-often approach costs more and delivers less accuracy than switching technologies.
3. How much will temperature and pressure fluctuations actually cost me in measurement errors — do I really need to worry?
It depends on your gas commodity value. Here is a quick formula: multiply your annual gas cost (in dollars) by your estimated measurement drift percentage (typically 3–6% for volumetric meters in variable conditions). That product is your annual measurement error exposure. For a facility spending $400,000/year on process gas with a 4% average drift, that is $16,000/year — quietly disappearing into measurement uncertainty. For a 20-facility network, that is $320,000/year industry-wide. Whether that number matters is a business decision, not a technical one. Our experience at Jade Ant Instruments is that virtually every customer who runs this calculation decides it matters.
4. Is thermal mass flow meter technology reliable enough for critical applications, or is it still experimental?
Thermal mass flow measurement has been deployed in industrial gas applications since the 1970s. Modern implementations by manufacturers such as Sierra Instruments, Fox Thermal, Bronkhorst, and Endress+Hauser are fully mature, with documented performance in oil and gas, semiconductor manufacturing, pharmaceutical production, and food processing. The technology is explicitly recommended by organizations including ASHRAE for compressed air measurement and by multiple international standards for natural gas applications. It is not experimental; it is, in many applications, the established reference technology against which other meters are compared.
5. What’s the actual total cost of ownership difference between thermal mass and a Coriolis meter over 10 years?
Both technologies deliver temperature/pressure-independent mass flow measurement. The differences are: Coriolis meters deliver ±0.1–0.3% accuracy (versus ±0.75–1.5% for thermal mass) and are suitable for both liquids and gases. They also cost 3–5× more for equivalent pipe sizes, require more complex installation (the vibrating tube design is sensitive to pipe vibration and requires specific support conditions), and are generally limited to 6-inch diameter maximum in cost-practical configurations. Over 10 years, a Coriolis meter in a 4-inch gas application might carry a $45,000–$70,000 TCO versus $25,000–$35,000 for thermal mass. If your application requires ±0.1% custody-transfer accuracy, Coriolis is worth the premium. If ±1% is sufficient — and for most process monitoring applications it is — thermal mass delivers equivalent T/P independence at roughly half the TCO.
6. Can thermal mass flow meters handle cryogenic applications where other meters fail?
Yes, with the appropriate product selection. Cryogenic-rated thermal mass meters use construction materials qualified for low-temperature service (typically 316 SS or Hastelloy C-276 sensor bodies) and inert-gas-purged sensing elements that maintain function down to −200°C. Standard turbine meters fail below −40°C (bearing lubricant failure), standard vortex meters fail below −80°C (piezoelectric sensor cracking), and orifice plates require discharge coefficient data that is not standardized below −50°C for most gas mixtures. For liquid nitrogen, LNG, or liquid CO₂ applications, a cryogenic thermal mass meter is not a premium option — it is the minimum viable solution.
7. If I switch to thermal mass, will I need to replace my entire measurement infrastructure, or can I retrofit existing systems?
For most industrial gas applications, thermal mass meter retrofit requires only a pipe entry point (hot-tap fitting, flanged spool piece, or existing process connection) and a 24VDC or 110/220VAC power supply. The transmitter outputs 4–20 mA and/or digital protocols (HART, Modbus, PROFIBUS) that connect directly to your existing DCS or SCADA without configuration changes beyond the new meter tag. For pipe sizes 2 inches and above, insertion-style sensors are installed without cutting the pipe or shutting down the process. Total installation time for a straightforward retrofit is typically 4–8 hours. You do not need to replace pressure taps, impulse lines, flow computers, or wiring — only the primary measurement device.
8. How often do thermal mass flow meters need maintenance compared to turbine or vortex meters?
In clean gas service (natural gas, nitrogen, compressed dry air), thermal mass meters with no moving parts typically require visual inspection and functional verification annually, and full laboratory recalibration every 2–3 years. Turbine meters require bearing inspection and K-factor verification every 6–12 months. Vortex meters require sensor integrity checks every 12–18 months. The per-event cost of maintenance is similar across all three technologies ($500–$2,500 depending on meter size and service provider). The frequency difference — 2–3x less frequent for thermal mass — translates directly to 50–67% lower annual maintenance cost over the meter’s service life.
9. What happens to thermal mass accuracy in applications with extreme pressure swings — does it eventually drift like other technologies?
No — provided the thermal mass meter was calibrated across the expected operating pressure range, or the electronics include an active pressure compensation input. Most modern thermal mass meters for industrial gas service are available with an optional pressure input (4–20 mA from a separate pressure transmitter) that the meter uses to maintain stated accuracy across the full operating pressure range. Without pressure compensation, a thermal mass meter can experience accuracy degradation of 0.5–1.0% per 10-bar pressure deviation from calibration conditions — better than most volumetric technologies, but not negligible in extreme-pressure applications. For batch processes with pressure swings > 20 bar, specify the pressure-compensated variant.
10. Are thermal mass meters suitable for both gas and liquid applications, or are they limited?
Thermal mass meters are optimized for gas applications. The thermal sensing principle is most sensitive and most accurate in gas flows because gases have relatively low thermal conductivity and specific heat capacity, making the temperature differential between the heated sensor and the fluid easy to measure precisely. In liquid applications, the high thermal conductivity of most liquids causes rapid heat dissipation that reduces sensor sensitivity and narrows the measurable flow range significantly. For liquid flow measurement, Coriolis meters or electromagnetic flow meters are the preferred technology. Do not sell a thermal mass meter into a liquid application unless the meter’s data sheet explicitly specifies liquid performance and the accuracy requirement is within that specification.
11. How do I explain to my finance team why we should pay more upfront for thermal mass when our current meter seems to work?
The framing that works: “Our current meter works fine on average, but it works incorrectly by 3–5% depending on season, time of day, and process conditions. We’re paying for that incorrectness every day in measurement error losses — we just haven’t been tracking it as a line item. The thermal mass meter costs $X more than replacing our existing meter with the same technology. The measurement error savings are $Y per year. The additional investment pays back in Z months, and then we’re saving $Y per year indefinitely.” Run the numbers for your specific facility and present them as a one-page financial summary. Finance teams approve investments they can model; they reject abstract quality arguments. Give them the model.
12. Can thermal mass meters work in high-vibration industrial environments, or will that affect accuracy?
Insertion-style thermal mass meters with robust probe designs are specified for pipeline and industrial environments that routinely involve mechanical vibration. The sensing elements do not have resonant frequency sensitivities comparable to vortex meter piezoelectric sensors. However, extreme vibration (>5g RMS in the 10–1000 Hz range, typical near reciprocating compressors or heavy stamping presses) can introduce signal noise in some designs. For high-vibration installations, specify a meter with vibration-isolated sensor mounting and verify the manufacturer’s vibration specification against your measured vibration spectrum. In most manufacturing environments (conveyor systems, CNC machining, standard HVAC), standard thermal mass meters operate without vibration-related issues.
13. What’s the typical payback period for switching from a traditional meter to thermal mass in a compressed air system?
For a typical industrial compressed air system spending $300,000–$800,000/year on compressed air energy, with a volumetric meter currently carrying 3–6% measurement drift, the payback period for a thermal mass upgrade runs 3–18 months depending on system size and meter count. The specific calculation: multiply annual compressed air cost by drift percentage to get annual error exposure, then divide by the meter purchase and installation cost. A $500,000/year system with 4% drift ($20,000/year exposure) switching to a $4,500 thermal mass meter (installed) recovers the investment in approximately 2.7 months. Note that this calculation covers only measurement error savings — it excludes the additional maintenance cost reduction and recalibration avoidance, which typically add another 20–40% to the annual benefit.
Your Competitive Advantage in the Market
Why Positioning This Now Matters (Before Competitors Do)
Early adopters gain customer loyalty by solving a problem competitors haven’t even identified
The thermal mass value proposition is not widely articulated at the distributor level. Most flow meter sales conversations still focus on installation type, pipe compatibility, and purchase price — entirely missing the temperature/pressure sensitivity issue that is costing industrial customers $15,000–$80,000 per year per facility in measurement losses. Distributors and agents who master the TCO argument and the ROI conversation first will establish themselves as the technically credible partner in their market — not just a product supplier.
Customer loyalty in B2B instrumentation is built on one thing: you identified a problem your customer didn’t know they had, quantified it in their language (dollars), and solved it with a specific product. That sequence — identify, quantify, solve — creates a relationship that survives competitive price pressure and supply chain disruptions. The distributor who brings the “here’s what your measurement drift is costing you” conversation to a 20-plant industrial account will earn preferred supplier status that is extremely difficult for competitors to dislodge.
Thermal mass becomes your differentiator — the technology others can’t match
Your competitors are selling the same turbine meters and orifice plates they’ve been selling for 20 years. The conversation is about price, delivery, and brand. When you shift the conversation to measurement performance under real operating conditions, you are competing on a dimension where your competitors have not invested in knowledge. That asymmetry is your advantage. Use it before they figure it out.
Action Plan for Your Distribution Team This Quarter
Build a 90-day execution plan around three specific activities:
First, identify 5–10 customer accounts within your existing portfolio that operate industrial gas systems in variable-temperature environments. Look specifically for accounts with compressed air systems in non-climate-controlled facilities, chemical batch processors, or any application involving cryogenic gases. These are your highest-probability thermal mass opportunities.
Second, schedule discovery calls using the assessment framework from this guide — specifically the questions about recalibration frequency, seasonal measurement drift, and annual gas commodity spend. Use the three discovery questions as a systematic diagnostic, not an open-ended conversation. The goal of the discovery call is a specific dollar figure: “Your estimated annual measurement error exposure is $X.”
Third, present thermal mass business cases to at least three qualified prospects this quarter, using the 5-year TCO model and the payback period calculation. Track the conversion rate and the average deal size. Most distributors who execute this framework find conversion rates of 40–60% on qualified opportunities — significantly above average for instrumentation sales.
Making This Real for Your Customers
The Bottom Line: Temperature and Pressure Don’t Have to Cost You Money
Temperature and pressure fluctuations are a fact of industrial life — but measurement errors don’t have to be. While competitors force customers to choose between accuracy and cost, thermal mass flow meters eliminate that choice entirely.
Your role as a distributor or agent is to help your customers see this advantage before they’ve wasted another year — and another $20,000–$80,000 — on inaccurate measurements and recalibration cycles that address the symptom without curing the disease.
The customers who understand this advantage first will be the ones who stay with you longest. They’ll also be the ones who recommend you to their peers. That’s how you build a defensible market position in a market where every competitor is selling on price.

📺 Watch This First: Before your next sales call on a thermal mass opportunity, watch this comprehensive comparison of thermal mass vs. competing gas measurement technologies — it covers the core physics in a format you can adapt directly for customer presentations.
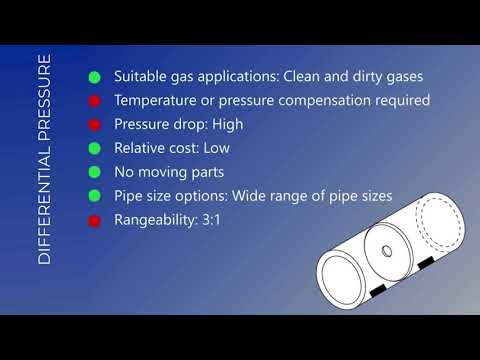
A Brief Comparison of Thermal Mass Flowmeters and Other Technologies — Sierra Instruments. Covers the key measurement principles, accuracy trade-offs, and industrial application fit in under 8 minutes.
Ready to Equip Your Sales Team?
The thermal mass opportunity is in your existing account base right now. Your customers are already losing measurement accuracy — they just haven’t quantified it yet. Your job is to run that calculation with them, present the TCO case, and position the upgrade.
To support your team’s execution, Jade Ant Instruments provides application-specific technical consultation, customer-ready TCO calculation templates, and competitive positioning documentation. Whether you are entering a new industrial account or deepening an existing one, the thermal mass conversation is the most defensible revenue opportunity in gas flow measurement today.
- 📐 Explore thermal mass flow meter specifications and sizing tools: Jade Ant Instruments Thermal Mass Flow Resources
- 🔍 Understand the full cost of measurement errors: Hidden Costs of Flow Measurement Errors — Jade Ant Instruments
- ⚙️ Compare thermal mass controller vs. conventional meters: Thermal Mass Flow Controller vs. Conventional Flow Meters
- 📊 Read the independent technology comparison (Fox Thermal): Thermal Mass Flow Meters vs. Competing Technology — Fox Thermal
- 📚 Understand industrial gas flow measurement standards: Bronkhorst — Thermal Mass Flow Measurement Principles
Your customers’ measurement accuracy — and your market share — depends on getting this right.
Glosario de términos clave
| Término | Plain-Language Definition |
|---|---|
| Mass flow rate | The amount of matter (in kilograms or pounds) flowing through a pipe per unit time — independent of temperature and pressure changes that affect volume |
| Volumetric flow rate | The volume of fluid (cubic meters per minute) flowing through a pipe — changes with temperature and pressure even if the actual amount of matter is constant |
| Discharge coefficient (Cd) | A calibration factor for orifice plates that accounts for real-world flow non-idealities; varies with Reynolds number and fluid conditions |
| Reynolds number | A dimensionless ratio of inertial to viscous forces in a fluid; determines whether flow is laminar or turbulent, and affects the calibration accuracy of most volumetric meters |
| Specific heat capacity (Cp) | The amount of energy required to raise the temperature of 1 kg of a substance by 1°C; used in the thermal mass meter’s fundamental measurement equation |
| T/P compensation | Temperature and Pressure compensation — correction factors applied to volumetric meter readings to convert to mass flow; required for orifice plates, turbines, and vortex meters |
| TCO | Total Cost of Ownership — the complete 5–10 year cost including purchase price, installation, maintenance, calibration, downtime, and measurement error losses |
| Hot-tap fitting | A pipe fitting that allows a sensor probe to be inserted into a live, pressurized pipe without process shutdown |
| Rangeability (Turndown ratio) | The ratio of maximum to minimum measurable flow rate; thermal mass meters typically achieve 100:1, meaning they measure accurately from near-zero to full-scale flow |
| HART protocol | Highway Addressable Remote Transducer — a digital communication standard that allows simultaneous analog (4–20 mA) and digital communication with smart field instruments |