
Cooling infrastructure accounts for approximately 40% of a typical data center’s total electricity consumption, according to Fuji Electric’s data center analysis. As rack densities climb past 40 kW per cabinet in AI-driven facilities — and exceed 100 kW per rack in high-performance computing (HPC) clusters — the margin for error in thermal management is shrinking rapidly. Poor hydraulic control in cooling loops can inflate energy overhead by 10–20%, turning what should be an operational efficiency problem into a significant P&L liability.
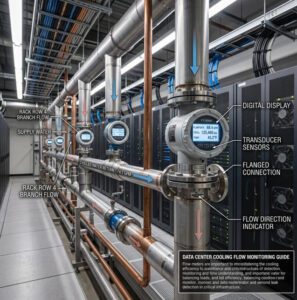
Inline flow meters sit at the center of this challenge. They provide the real-time flow rate, velocity, and temperature data that building management systems (BMS) and SCADA platforms rely on to modulate pumps, balance distribution loops, and maintain stable rack inlet temperatures within ASHRAE TC 9.9’s recommended range of 18–27 °C (64.4–80.6 °F). The difference between a facility running at a PUE of 1.58 (the industry average per Uptime Institute) and one operating at 1.2 or below often comes down to the precision and reliability of the instrumentation embedded in the cooling plant.
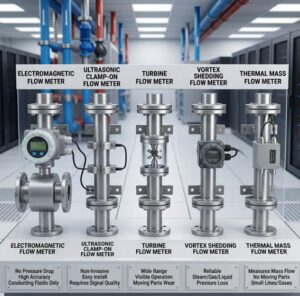
This article provides a comprehensive, engineering-level comparison of inline flow meter technologies — turbine, ultrasonic, electromagnetic, and Coriolis — evaluated specifically for data center and HPC cooling applications. We cover measurement principles, real-world accuracy data, pressure drop implications, material compatibility with common coolants, total cost of ownership over a 10-year lifecycle, and a step-by-step selection framework you can apply to your next project. Where applicable, we reference deployment patterns and product capabilities from Jade Ant Instruments, whose electromagnetic, turbine, and ultrasonic meter portfolio has been specified in HVAC and industrial cooling loops across more than 12,000 installations.
What Inline Flow Meters Measure and Why It Matters

Key Measurement Parameters: Flow Rate, Velocity, Temperature, and Sign of Flow
An inline flow meter installed in a data center cooling loop provides several critical measurements. The primary output is volumetric flow rate — typically expressed in liters per minute (LPM) or gallons per minute (GPM) — which tells operators exactly how much coolant is circulating through a given pipe segment at any moment. Some meter technologies (notably Coriolis) measure mass flow directly, eliminating the need to compensate for fluid density variations caused by temperature shifts or glycol concentration changes.
Beyond flow rate, many modern inline meters also measure or infer fluid velocity, which is essential for verifying that coolant speed remains within design parameters. Excessive velocity causes erosion and cavitation; insufficient velocity allows thermal stratification and inadequate heat transfer at the rack level. Bidirectional flow detection is another increasingly important capability, particularly in systems with variable-speed pumps or parallel header configurations where backflow can occur during pump trips or load-shifting events.
Integrated temperature sensors (RTDs or thermistors) in certain meter platforms enable the calculation of thermal energy (BTU or kW) by measuring both flow rate and delta-T across a heat exchanger or coolant distribution unit (CDU). This combined measurement feeds directly into PUE and cooling efficiency calculations.
How Measurements Influence Cooling Performance and Energy Efficiency
In a 10 MW data center with a PUE of 1.5, roughly 5 MW is consumed by non-IT infrastructure — and the cooling plant is the single largest contributor. A flow measurement error of just 5% on the chilled water primary loop can translate into hundreds of thousands of dollars in annual energy waste because pump speeds, chiller loading, and valve positions are all calculated from that flow data. Facilities that have deployed high-accuracy inline metering (±0.5% or better) and used the data to optimize variable-frequency drive (VFD) pump control have documented cooling energy reductions of 15–25%, according to operational data reported by Badger Meter and KROHNE field case studies.
The mechanism is straightforward: when the BMS receives accurate, real-time flow data, it can reduce pump speed to the minimum required to maintain target delta-T, rather than running at a fixed speed with excess flow margin. Over a 10-year facility lifecycle, this compounding effect makes the flow meter one of the highest-ROI instruments in the cooling plant.
Typical Use Cases in Data Centers and HPC Environments
Inline flow meters are deployed at multiple points in the cooling architecture. On the primary chilled water loop, they monitor total plant flow from the chiller plant to the data hall. On secondary loops, they track distribution to individual CDUs or computer room air handlers (CRAHs). At the rack level — increasingly common in direct liquid cooling (DLC) and rear-door heat exchanger (RDHx) deployments — smaller-bore inline meters monitor coolant delivery to individual cabinets or cold plates. In HPC facilities running GPU clusters at 60–100+ kW per rack, rack-level metering is not optional — it is the only way to verify that each node receives adequate coolant flow to prevent thermal throttling that degrades computational throughput.
Video: Inside Data Centers — Process instrumentation in cooling systems (KROHNE, 2025)
Core Technologies Used in Inline Meters
Turbine and Variable-Area Meters
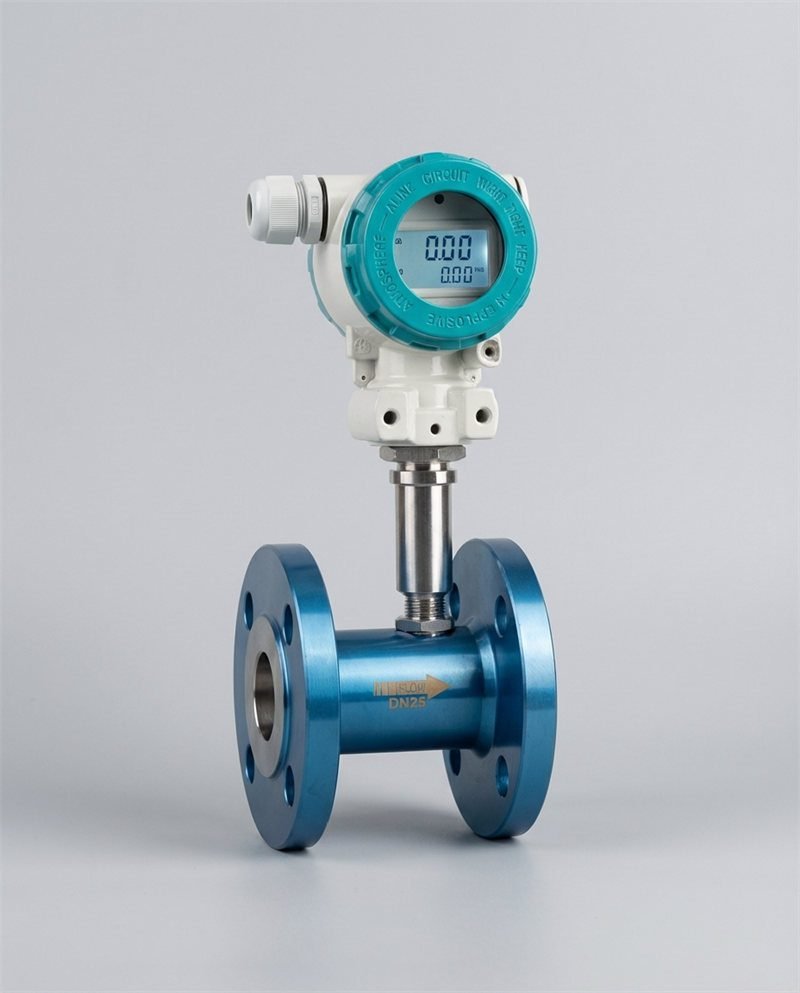
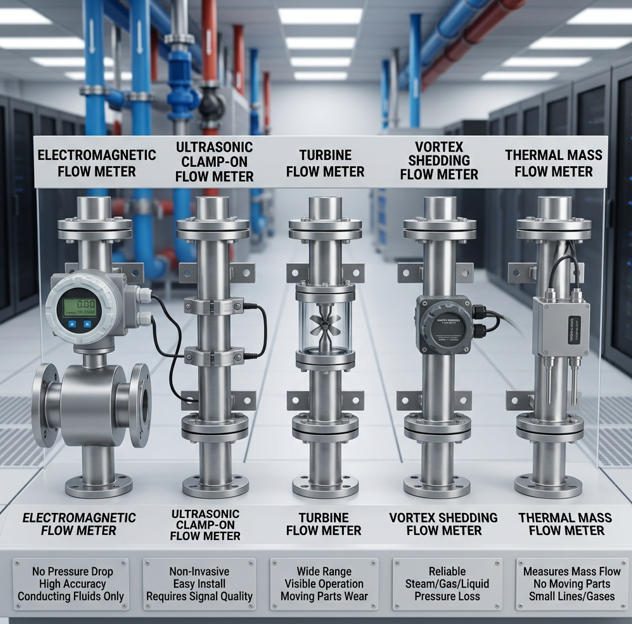
Turbine flow meters operate by placing a free-spinning rotor in the flow path. As coolant passes through, the rotor spins at a rate proportional to fluid velocity. A magnetic pickup or Hall-effect sensor counts blade rotations and converts them to a pulse output (typically 4–20 mA or frequency). In clean chilled water systems, turbine meters deliver accuracy in the range of ±0.5% to ±1.0% of reading, with repeatability as tight as ±0.1% — a performance profile that satisfies most secondary-loop monitoring requirements.
Variable-area meters (rotameters) use a float inside a tapered tube. As flow increases, the float rises to a position where buoyancy and drag balance gravity. These are the simplest and least expensive inline meters, but they are limited to visual indication, lack electronic output for BMS integration, and require vertical mounting. Their role in data center cooling is typically confined to local commissioning verification or makeup water lines — not primary monitoring.
Jade Ant Instruments’ turbine flow meters are available in stainless steel construction with NPT or flanged connections from DN15 to DN200, covering the flow ranges encountered in both rack-level coolant loops and facility-scale chilled water headers.
Ultrasonic and Coriolis Options
Ultrasonic inline flow meters measure flow by transmitting acoustic pulses through the fluid. Transit-time models — the dominant type for clean data center coolants — measure the time difference between upstream and downstream acoustic paths. Because sound travels faster with the flow and slower against it, the delta between the two transit times is directly proportional to flow velocity. With no moving parts and no obstruction in the flow path, ultrasonic meters introduce zero pressure drop and require virtually no maintenance. Accuracy typically falls in the ±0.5% to ±1.0% of reading range for inline (wetted) transit-time models, improving to ±0.2% in high-end custody-transfer configurations.
Coriolis flow meters operate on an entirely different principle. Fluid passes through one or two vibrating tubes. The Coriolis effect causes a phase shift between inlet and outlet sensors that is directly proportional to mass flow rate. This makes Coriolis meters the only technology that provides a true mass flow measurement without requiring density compensation — a significant advantage in systems running glycol blends where concentration (and therefore density) can vary. Accuracy reaches ±0.1% of reading or better, making Coriolis the gold standard for precision. However, this performance comes at a price premium of 3–5× relative to turbine or ultrasonic alternatives in comparable line sizes.
For data center operators evaluating ultrasonic flow meter options, Jade Ant Instruments offers both clamp-on and inline transit-time models with Modbus RTU and 4–20 mA outputs, enabling direct integration with data center BMS and SCADA platforms.
Pros, Cons, and Ideal Applications for Each Technology
| Parameter | Turbine | Ultrasonic (Transit-Time) | Electromagnetic | Coriolis |
|---|---|---|---|---|
| Accuracy (% of reading) | ±0.5% to ±1.0% | ±0.5% to ±1.0% | ±0.2% to ±0.5% | ±0.05% to ±0.1% |
| Repeatability | ±0.1% | ±0.15% | ±0.1% | ±0.05% |
| Turndown Ratio | 10:1 to 20:1 | 25:1 to 100:1 | 30:1 to 100:1 | 80:1 to 200:1 |
| Pressure Drop | Moderate (0.5–2 psi typical) | Zero (no obstruction) | Negligible | Low to moderate |
| Moving Parts | Yes (rotor, bearings) | No | No | No (vibrating tubes) |
| Maintenance Interval | 12–24 months | 36–60 months | 24–36 months | 36–60 months |
| Glycol Blend Suitability | Good (clean blends) | Excellent | Excellent (conductive fluids) | Excellent |
| DI Water Suitability | Good | Excellent | Poor (low conductivity) | Excellent |
| Dielectric Fluid Suitability | Fair (viscosity-dependent) | Good | Not suitable | Excellent |
| Purchase Price (DN50 range) | $300–$1,200 | $800–$3,000 | $600–$2,500 | $3,000–$10,000+ |
| Best Data Center Use | Secondary loops, CDU monitoring | Primary loops, retrofit projects | Chilled water loops (conductive) | Glycol blends, immersion coolant dosing |
Performance Metrics to Compare
Accuracy, Precision, Repeatability, and Turndown Ratio
When evaluating inline flow meters for critical cooling infrastructure, it is important to distinguish between accuracy, repeatability, and turndown — three metrics that are often conflated but serve different engineering purposes. Accuracy (closeness to true value) determines how well the meter supports energy accounting and PUE calculations. Repeatability (consistency under identical conditions) determines how stable the control loop behavior will be. Turndown ratio (the range from maximum to minimum measurable flow) determines whether a single meter can handle both peak cooling demand and low-load nighttime operation without losing reliability at the bottom of its range.
In a typical data center cooling loop, daytime peak flow may be 3–5× the nighttime minimum. A turbine meter with a 10:1 turndown may lose accuracy below 10% of its rated capacity, requiring two meters or a compromise sizing. An ultrasonic or Coriolis meter with 100:1 turndown handles the full range from a single installation point — reducing piping complexity and maintenance burden. This practical difference often outweighs the headline accuracy number when engineers evaluate the real-world performance of competing technologies, a selection philosophy detailed in Jade Ant Instruments’ 5-factor flow meter selection guide.
Pressure Drop and Pump Head Impact
Every inline meter that inserts an obstruction into the flow path — turbine rotors, orifice plates, vortex bluff bodies — creates a permanent pressure drop that the pumping system must overcome. In a large data center with dozens of meters distributed across primary and secondary loops, cumulative pressure drop from flow instrumentation can add measurable pump energy. For a DN100 turbine meter at 300 GPM, the typical pressure drop is 1–2 psi. Across 20 such meters in parallel secondary loops, that adds approximately 2.3–4.6 kW of continuous pump power consumption — roughly $2,000–$4,000 per year at average US commercial electricity rates.
Ultrasonic transit-time meters and electromagnetic meters produce zero or negligible pressure drop because nothing protrudes into the flow stream. Over a 10-year facility lifecycle, the cumulative pumping energy savings from zero-pressure-drop metering can exceed the purchase price difference between technologies. This is a factor that belongs in the total cost of ownership model, not treated as a footnote.
Response Time, Noise, and Data Logging Capabilities
Response time becomes critical in facilities using variable-speed pumps with fast control loops. Turbine meters respond quickly (sub-second) because rotor speed tracks flow velocity in real time. Ultrasonic meters also respond rapidly, typically within 0.5–2 seconds depending on averaging settings. Coriolis meters can be slightly slower (1–3 seconds) due to the mechanical dynamics of tube vibration, but this is rarely a limitation in HVAC-scale cooling control.
Acoustic noise from flow meters is generally negligible in data center environments where server fan noise dominates. However, turbine meters in high-velocity flow conditions (above 5 m/s) can generate audible tones — worth noting if the meter is installed near operator workstations or monitoring rooms. On data logging, all modern meters support 4–20 mA, pulse, and digital protocol (HART, Modbus RTU/TCP) outputs. The shift toward digital integration enables predictive diagnostics — detecting bearing wear in turbine meters or signal degradation in ultrasonic meters before a failure causes a measurement gap.
Installation and Integration Considerations

Piping Configuration, Placement, and Calibration Procedures
Installation quality is the single most common cause of flow measurement problems in the field — more so than sensor selection or manufacturer quality, as documented across Jade Ant Instruments’ 12,000+ installation base. Every inline meter technology has upstream and downstream straight-run requirements that, when violated, introduce swirl-induced bias and noise that no amount of signal filtering can correct.
Turbine meters typically require 10–15 pipe diameters of straight run upstream and 5 downstream. Ultrasonic inline meters require similar or slightly less (5–10 upstream). Electromagnetic meters are more forgiving (5 upstream, 3 downstream) due to their full-bore, obstruction-free measurement principle. Coriolis meters are the least sensitive to upstream disturbances because the measurement relies on tube vibration dynamics rather than velocity profile shape.
In data center mechanical rooms where space is constrained and piping runs are short, the relaxed straight-run requirement of electromagnetic and Coriolis meters is a genuine practical advantage that reduces layout rework during design. Where straight runs cannot be achieved, flow conditioners (vane packs or tab-type devices) can be used to stabilize the velocity profile — at the cost of additional pressure drop and an extra installation component.
Electrical and Data Acquisition (DAQ/SCADA) Integration
Modern data centers run on BMS platforms such as Schneider Electric EcoStruxure, Siemens Desigo CC, or Honeywell Niagara. Integration requires the flow meter to output data in a format the BMS can ingest — whether analog (4–20 mA mapped to a flow range), pulse (volume totalization), or digital (Modbus RTU over RS-485 or Modbus TCP/IP over Ethernet). Jade Ant Instruments’ meter portfolio supports all three output families, including HART 7 for compatibility with asset management systems and predictive maintenance platforms.
Proper wiring practice matters. Signal cables should be routed separately from power cables and VFD motor leads to minimize electromagnetic interference (EMI). In environments with high EMI — common in data centers with hundreds of power supplies and UPS systems — shielded twisted-pair cabling with single-point grounding per the manufacturer’s specification is essential. Failure to address EMI is a frequent root cause of “noisy readings” that operators mistakenly attribute to the meter itself.
Environmental Considerations: Vibration, Heat, and Accessibility
Mechanical rooms in data centers are subject to vibration from pumps, compressors, and cooling towers. Turbine meters are most susceptible to vibration-induced errors because external vibration can cause the rotor to spin independently of flow — generating false readings. Ultrasonic and electromagnetic meters are largely immune to mechanical vibration. Coriolis meters, while vibration-sensitive by design (they rely on precise tube oscillation), incorporate active vibration rejection algorithms that separate process signal from external disturbance.
Ambient temperature in the mechanical room typically ranges from 25–45 °C. All four meter technologies handle this range comfortably, but the electronics housing should be shielded from direct radiant heat sources (steam pipes, hot glycol return lines) to prevent premature component aging. Access for maintenance — particularly important for turbine meters that require periodic rotor inspection and bearing replacement — should be planned during the piping design phase, not retrofitted after commissioning.
Reliability, Maintenance, and Lifecycle
Potential Failure Modes, Fouling, and Cleaning Needs
Each meter technology has a distinct failure profile in cooling applications. Turbine meters fail primarily through bearing wear and rotor fouling — particulate or biofilm buildup on rotor blades changes the K-factor (pulses per unit volume) and degrades accuracy over time. In glycol systems where inhibitor chemistry has degraded, accelerated corrosion of the rotor and housing is common. Electromagnetic meters can fail if the pipe liner is damaged or if electrode fouling from mineral deposits creates a conductive bridge that biases the signal. Ultrasonic meters are the most failure-resistant in clean systems, but sediment buildup on the transducer face — or air pocket formation near the sensor — can attenuate the acoustic signal and cause measurement dropout. Coriolis meters can experience tube erosion in abrasive slurry services but are virtually immune to fouling in the clean coolants used in data centers.
Calibration Frequency and Warranty Implications
Calibration intervals depend on criticality and regulatory requirements. For energy accounting and PUE reporting, annual calibration against a NIST-traceable reference is standard practice. Turbine meters typically require annual recalibration because bearing wear gradually shifts the K-factor. Electromagnetic and ultrasonic meters hold calibration longer — 2–3 years is common in clean-water service — because they have no wearing components that directly affect measurement accuracy. Coriolis meters are the most stable over time; some operators extend calibration intervals to 3–5 years based on diagnostic self-verification data from the transmitter.
Field calibration costs range from $500 to $3,000 per meter for ISO/IEC 17025 traceable calibration, depending on meter size and protocol. Over a 10-year lifecycle with 50 meters deployed across a facility, the difference between annual and triennial calibration can amount to $250,000–$500,000 in cumulative calibration expense — a figure that often exceeds the original meter purchase cost.
Spare Parts Availability and Service Support
Turbine meters require spare rotor assemblies, bearings, and seals. These are generally inexpensive ($50–$300 per set) and widely available. Ultrasonic and electromagnetic meters have no consumable wear parts but may require transducer or electrode replacement after 7–10 years in aggressive fluid services. Coriolis meters rarely need parts replacement but, when they do (tube assembly failure), the cost can be substantial — often 40–60% of the original meter price. For facilities with hundreds of meters, establishing a stocking agreement with the manufacturer or selecting a vendor with local service infrastructure (such as Jade Ant Instruments’ global service network) significantly reduces mean time to repair (MTTR).
Impact on Data Center Cooling Outcomes
Metering in Primary Loops vs. Secondary Loops and Hot Aisle Containment
Primary loop metering measures total coolant flow from the chiller plant and provides the high-level data that drives chiller staging and plant-wide efficiency calculations. Errors here propagate through every downstream calculation — a 3% measurement bias on the primary loop means the BMS is making chiller load decisions based on flawed data, potentially running an additional chiller unnecessarily at a cost of $150,000–$300,000 per year in a large facility.
Secondary loop metering, installed at CDU inlets or CRAH supply headers, enables zone-level optimization. In hot aisle containment configurations — where precise control of supply air or supply water temperature is the primary lever for preventing IT thermal throttling — secondary flow meters provide the feedback signal that the BMS uses to modulate control valves and match coolant delivery to actual IT heat load. Without secondary metering, operators default to over-provisioning flow (and wasting pump energy) to ensure no zone is under-served.
Influence on Cooling Control Strategies and Setpoints
High-accuracy inline metering enables a shift from fixed-setpoint to dynamic-setpoint cooling control. Instead of running the chilled water supply at a constant 7 °C (44.6 °F) to ensure worst-case coverage, operators can raise the supply temperature to 10–12 °C during low-load periods — a strategy that, according to Google’s published PUE data, contributed to their fleet-wide average PUE of 1.1. Every 1 °C increase in chilled water supply temperature reduces chiller energy consumption by approximately 2–3%. This optimization is only possible when the BMS has reliable flow data to verify that heat rejection at the higher supply temperature remains adequate.
Risk Management and Redundancy Planning
In Tier III and Tier IV facilities, cooling system redundancy extends to instrumentation. A single flow meter failure on a critical loop can blind the BMS and force manual intervention or conservative over-provisioning. Best practice is to install redundant meters on primary loops — either two meters in series for cross-verification, or a primary inline meter with a clamp-on ultrasonic as a backup. The cost of a redundant clamp-on ($800–$2,000) is trivial compared to the risk of thermal-related downtime, which the Uptime Institute estimates at $8,000–$9,000 per minute for large enterprise data centers.
Compatibility with Coolants and Materials
Water, Glycol Blends, Dielectric Fluids, and Refrigerants
Data center cooling systems operate with a widening variety of fluids. Chilled water (with or without corrosion inhibitors) remains the most common, but propylene glycol blends at 20–50% concentration are standard in any facility with outdoor piping exposed to freezing temperatures. Direct liquid cooling (DLC) systems for GPUs typically use deionized (DI) water, which has conductivity below 1 µS/cm — too low for electromagnetic meters, which require a minimum of 5 µS/cm. Immersion cooling systems use dielectric fluids (mineral oils, synthetic esters, or engineered fluorocarbons like 3M Novec), which are non-conductive and have viscosity characteristics that differ significantly from water.
The table below maps fluid types to compatible meter technologies:
| Coolant Type | Turbine | Ultrasonic | Electromagnetic | Coriolis |
|---|---|---|---|---|
| Chilled water (treated) | ✓ | ✓ | ✓ | ✓ |
| Deionized (DI) water | ✓ | ✓ | ✗ | ✓ |
| Propylene glycol blend (30%) | ✓ | ✓ | ✓ | ✓ |
| Ethylene glycol blend (50%) | ⚠ (viscosity check) | ✓ | ✓ | ✓ |
| Dielectric fluid (mineral oil) | ⚠ (material check) | ✓ | ✗ | ✓ |
| Engineered fluorocarbon (e.g., Novec) | ✗ | ⚠ (acoustic coupling) | ✗ | ✓ |
Material Compatibility, Corrosion Resistance, and Seal Integrity
Wetted materials must resist the specific chemistry of the coolant over the full operating temperature range. For standard chilled water and glycol services, 316L stainless steel bodies with PTFE or hard rubber liners (for electromagnetic meters) are the industry standard. In dielectric fluid applications, elastomer seals must be verified against the specific fluid — some fluoroelastomers (FKM/Viton) swell in certain hydrocarbon-based dielectric oils, while EPDM seals may be incompatible with fluorocarbon fluids. The Open Compute Project’s material compatibility guide provides a systematic framework for validating wetted component materials against immersion cooling fluids.
Implications for Regulatory Compliance and Safety
In jurisdictions with environmental reporting requirements for water usage (WUE — Water Usage Effectiveness) or chemical discharge, the flow meter’s calibration traceability becomes a compliance instrument. ASHRAE 90.4 and European EN 50600 standards reference monitoring accuracy requirements that favor meters with documented, traceable calibration histories. For systems using glycol or chemical inhibitors, leak detection via flow measurement differential (supply flow minus return flow) also satisfies environmental safety requirements and can trigger automated isolation in the event of a coolant breach.
Cost of Ownership and Total Cost of Ownership
Purchase Price, Installation, and Commissioning
The sticker price of a flow meter represents only 20–35% of the 10-year total cost of ownership. Installation labor (pipe cutting, welding, bypass valve setup, wiring, and commissioning) typically costs 0.5–2× the meter price, depending on pipe size, accessibility, and whether the installation requires a system shutdown. Clamp-on ultrasonic meters eliminate pipe modification entirely and can be installed in under 30 minutes, but inline wetted ultrasonic and Coriolis meters require the same pipe-work as turbine and electromagnetic meters.
Maintenance, Calibration, and Parts Costs Over Time
The chart below illustrates a 10-year total cost of ownership model for a representative DN50 (2-inch) inline flow meter installation on a secondary chilled water loop, assuming one meter, annual calibration for turbine, biennial for electromagnetic and ultrasonic, and triennial for Coriolis:
10-Year Total Cost of Ownership by Meter Technology (DN50, Single Meter)
$0
$5K
$10K
$15K
$20K
$25K
$12,200
$9,800
$10,500
$18,500
Turbine
Ultrasonic
Electromagnetic
Coriolis
Includes: purchase, installation, calibration, maintenance, and pumping energy over 10 years
The chart reveals a counterintuitive insight: the lowest-purchase-price option (turbine) does not have the lowest 10-year TCO. Ultrasonic inline meters, despite costing 2× more at purchase, deliver the lowest total cost because they eliminate pressure-drop energy costs, require less frequent calibration, and have no wearing parts. Coriolis meters are the most expensive overall, but in applications where mass flow accuracy directly prevents coolant over-provisioning (e.g., glycol dosing systems), the measurement precision pays for itself through chemical cost avoidance and reduced pump energy.
| Cost Component | Turbine | Ultrasonic | Electromagnetic | Coriolis |
|---|---|---|---|---|
| Purchase price | $800 | $1,800 | $1,500 | $6,000 |
| Installation & commissioning | $1,200 | $600 | $1,000 | $1,500 |
| Calibration (10-year total) | $5,000 | $2,500 | $3,000 | $2,000 |
| Maintenance & spare parts | $3,200 | $900 | $1,500 | $1,000 |
| Pumping energy (pressure drop) | $2,000 | $0 | $500 | $8,000 |
| 10-Year Total | $12,200 | $5,800 | $7,500 | $18,500 |
Selection Framework and Best Practices
Step-by-Step Evaluation Checklist for Data Centers and HPC Facilities
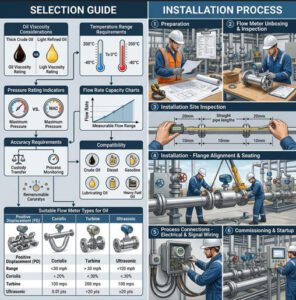
The following seven-step evaluation sequence reflects the decision logic used by cooling system engineers at facilities ranging from 2 MW edge sites to 100+ MW hyperscale campuses. Rather than starting with a meter brand or technology preference, the framework starts with the application reality and narrows to the optimal technology through elimination:
Step 1 — Define the coolant: Identify the fluid (water, glycol blend with concentration, DI water, dielectric fluid) and its temperature range. This immediately eliminates electromagnetic meters for non-conductive fluids and flags viscosity concerns for turbine meters.
Step 2 — Establish flow range: Document minimum, normal, and maximum flow rates for the specific pipe segment. Calculate the required turndown ratio. If turndown exceeds 20:1, turbine meters are disadvantaged.
Step 3 — Assess available straight run: Measure the physical piping upstream and downstream of the proposed installation point. If fewer than 10 diameters are available upstream, prioritize electromagnetic or Coriolis meters, or plan for a flow conditioner.
Step 4 — Determine accuracy requirement: For PUE reporting and energy accounting, ±0.5% of reading is typically sufficient. For custody transfer of coolant chemicals or immersion fluid inventory tracking, ±0.1% (Coriolis) may be justified.
Step 5 — Evaluate BMS integration: Confirm the required output signal (4–20 mA, Modbus, HART) and verify compatibility with the site’s SCADA or BMS platform.
Step 6 — Model 10-year TCO: Using the framework in Table 3, calculate total cost including purchase, installation, calibration, maintenance, and pumping energy. The lowest-TCO technology is often not the lowest purchase price.
Step 7 — Verify redundancy and serviceability: For Tier III/IV facilities, confirm that the selected meter can be maintained or replaced without shutting down the cooling loop (using isolation valves and bypass piping).
Vendor Comparison, Standards, and Interoperability Considerations
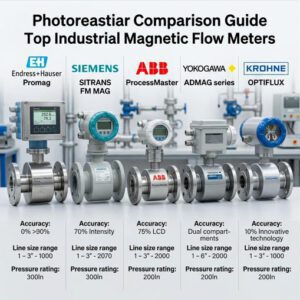
The data center instrumentation market includes global players such as Endress+Hauser, KROHNE, Yokogawa, Badger Meter, and Siemens alongside specialized manufacturers. When comparing vendors, engineers should evaluate not just sensor accuracy specifications but also transmitter diagnostics (device health, signal quality indicators), cybersecurity features (for networked digital meters in operational technology environments), and long-term firmware support. Jade Ant Instruments’ flow monitor comparison provides a structured vendor evaluation that covers these dimensions across electromagnetic, ultrasonic, and turbine technologies.
Interoperability standards to verify include HART 7 or HART-IP for asset management integration, BACnet for building automation interoperability, and ISO 4064 for water metering accuracy classifications. In facilities subject to European EN 50600 or US ASHRAE 90.4 energy management requirements, confirming that the meter’s calibration traceability meets the applicable standard’s monitoring accuracy clause is a compliance prerequisite.
Practical Guidelines for Pilots and Scale-Up Decisions
For operators considering a technology transition — such as replacing turbine meters with ultrasonic meters across a portfolio of facilities — a phased pilot approach reduces risk. Install the candidate technology in parallel with the existing meter on a representative secondary loop for 90 days. Compare readings, evaluate data quality in the BMS, and document any integration issues. This side-by-side validation provides site-specific confidence that laboratory accuracy translates to field performance before committing to a fleet-wide rollout.
Typical 10-Year TCO Distribution — Ultrasonic Inline Flow Meter
Purchase 31%
Install 10%
Calibration 43%
Maintenance 16%
The pie chart above illustrates a critical takeaway: for ultrasonic meters with zero pressure drop and no wearing parts, calibration becomes the largest lifecycle cost component — meaning that extending calibration intervals (supported by diagnostic self-verification data) is the highest-leverage cost optimization lever. This is one reason facilities with advanced BMS integrations are moving toward condition-based calibration scheduling rather than fixed annual intervals.
Selecting inline flow meters for data center and HPC cooling is not a commodity purchasing decision — it is an engineering choice that directly influences PUE, cooling reliability, and lifecycle cost. The key factors that drive the decision are the coolant type (which eliminates certain technologies outright), the required turndown ratio (which favors ultrasonic and Coriolis meters in variable-load environments), the available piping straight run (which constrains turbine and vortex options), and the 10-year total cost of ownership (which often reverses the purchase-price ranking).
For the majority of chilled water and glycol-based secondary loops in data centers, ultrasonic inline transit-time meters deliver the strongest combination of accuracy, zero pressure drop, low maintenance, and competitive TCO. Electromagnetic meters remain the best choice for conductive chilled water applications where their full-bore design and relaxed straight-run requirements simplify installation in space-constrained mechanical rooms. Coriolis meters are justified in high-value applications — glycol concentration monitoring, immersion coolant inventory management, and primary loop energy accounting — where mass flow accuracy below ±0.1% produces measurable operational savings.
For engineers evaluating flow meter selection across multiple technologies, aligning meter capabilities to actual site conditions — rather than defaulting to the most familiar technology — is the single most effective way to improve both cooling performance and instrumentation ROI. As liquid cooling adoption accelerates (projected to reach 50% of US data centers by 2030, per Bluefield Research), the metering infrastructure chosen today will define operational efficiency for the next decade.
Video: Data Center Cooling Methods Explained — Air, Liquid & Immersion Cooling (2026)
Frequently Asked Questions (FAQs)
1. What are the main differences between turbine, ultrasonic, and Coriolis inline flow meters for data centers?
Turbine meters use a mechanical rotor to measure volumetric flow, offering ±0.5–1.0% accuracy at a low purchase price but requiring periodic bearing maintenance. Ultrasonic transit-time meters measure flow velocity using acoustic pulses with no moving parts, producing zero pressure drop and requiring minimal maintenance. Coriolis meters measure mass flow directly through tube vibration, achieving ±0.1% or better accuracy — ideal for glycol blends and dielectric fluids where density varies — but at 3–5× the purchase cost. The right choice depends on your coolant type, flow range, and lifecycle cost priorities.
2. How does flow metering affect overall PUE and cooling efficiency in HPC workloads?
Accurate flow metering enables the BMS to precisely modulate pump speeds and control valve positions, avoiding the energy waste of over-provisioned coolant flow. Facilities with ±0.5% metering accuracy and VFD-controlled pumps have documented 15–25% reductions in cooling energy consumption. In a 10 MW facility with a PUE of 1.5, that translates to $300,000–$500,000 in annual energy savings. For HPC environments with highly variable GPU workloads, real-time flow data also prevents thermal throttling that degrades computational throughput.
3. What factors should be included in a pilot program when evaluating inline meters for a data center retrofit?
A 90-day parallel installation on a representative secondary loop is the standard approach. Key evaluation criteria include: measurement agreement with the existing meter (or a reference clamp-on), signal stability in the BMS under varying load conditions, response to pump speed changes, ease of commissioning and wiring integration, and any observed interference from EMI or vibration. Document calibration drift by performing a reference check at the start and end of the pilot period.
4. Can electromagnetic flow meters be used with deionized (DI) water in direct liquid cooling systems?
No. Electromagnetic meters require a minimum fluid conductivity of approximately 5 µS/cm to generate a measurable signal. DI water typically has conductivity below 1 µS/cm, making it invisible to electromagnetic sensors. For DI water cooling loops, ultrasonic transit-time or Coriolis meters are the appropriate technologies. Turbine meters also work with DI water but introduce pressure drop and require bearing maintenance.
5. How often should inline flow meters be calibrated in data center cooling systems?
Calibration frequency depends on the meter technology and the application’s accuracy requirement. Turbine meters typically require annual calibration due to bearing wear affecting the K-factor. Electromagnetic and ultrasonic meters maintain calibration for 2–3 years in clean coolant service. Coriolis meters are the most stable, with calibration intervals of 3–5 years common when supported by self-diagnostic verification data. For PUE reporting subject to audit, NIST-traceable calibration is recommended regardless of interval.
6. What is the impact of pressure drop from flow meters on data center pump energy costs?
A DN100 turbine meter at 300 GPM typically creates 1–2 psi of permanent pressure drop. Across 20 such meters in a secondary loop network, the additional pumping power is approximately 2.3–4.6 kW continuous — roughly $2,000–$4,000 per year at average US commercial electricity rates ($0.10/kWh). Over 10 years, this amounts to $20,000–$40,000 in energy cost that can be entirely avoided by selecting ultrasonic meters with zero pressure drop. In large hyperscale facilities with hundreds of meters, the cumulative savings become substantial.
7. Which flow meter technology is best for immersion cooling with dielectric fluids?
Coriolis flow meters are the most reliable choice for dielectric fluids because they measure mass flow independently of fluid properties and are fully compatible with non-conductive, varying-viscosity fluids. Ultrasonic meters can work with some dielectric fluids but require verification of acoustic coupling and signal strength for the specific fluid being used. Electromagnetic meters are not suitable (non-conductive fluid), and turbine meters may face seal compatibility and viscosity issues depending on the specific dielectric formulation.
8. How do I integrate inline flow meters with a data center BMS or SCADA system?
Most modern inline flow meters support three output families: analog 4–20 mA (mapped to flow range, best for real-time control loops), pulse/frequency output (ideal for totalization and volume accounting), and digital protocols including Modbus RTU (RS-485), Modbus TCP/IP (Ethernet), and HART. For BACnet-based building automation, a Modbus-to-BACnet gateway may be required. Jade Ant Instruments’ meter lineup supports 4–20 mA, HART, and Modbus outputs across electromagnetic, turbine, and ultrasonic platforms, enabling plug-in compatibility with major BMS brands including Schneider Electric, Siemens, and Honeywell.
9. What material specifications should I require for flow meter wetted parts in glycol cooling systems?
For propylene or ethylene glycol blends at concentrations up to 50%, 316L stainless steel bodies and PTFE or ceramic-lined sensors are standard. Seals should be EPDM or FFKM depending on the glycol type and operating temperature. Verify that all wetted materials — including gaskets, O-rings, and transducer faces — are compatible with the glycol inhibitor package, as some corrosion inhibitors (particularly amine-based formulations) can degrade certain elastomers over time. The Hydratech glycol compatibility guide is a useful reference for validating material selections.
10. What redundancy strategy should I use for flow meters on critical cooling loops?
For Tier III and Tier IV data centers, best practice is to install a primary inline meter with a clamp-on ultrasonic backup on each critical loop (chiller plant discharge, primary distribution header, CDU supply). The inline meter feeds the BMS control algorithm; the clamp-on provides independent verification and serves as a failover data source if the primary meter is removed for calibration or repair. The cost of a clamp-on backup ($800–$2,000) is negligible compared to the Uptime Institute’s estimated $8,000–$9,000 per minute cost of unplanned downtime in enterprise data centers.

For expert guidance on selecting the right inline flow meter for your data center cooling application — including custom configurations for glycol, DI water, and dielectric fluid services — contact Jade Ant Instruments for a technical consultation.