EPC/System Integration Strategies for Streamlining Flow Rate Mass Monitoring

1. Understanding the Critical Role of Flow Rate Mass Monitoring in Industrial Systems
Every barrel of crude, every kilogram of pharmaceutical ingredient, and every cubic meter of treated water passing through a pipe has a financial and regulatory identity. The instrument that tracks it — the flow meter — is the point where process performance, product quality, and compliance intersect. Get the measurement right, and everything downstream runs smoothly. Get it wrong, and the consequences stack up quickly.
Flow rate mass monitoring is the continuous, real-time measurement of how much fluid — by mass or volume — is moving through a piping system at any given moment. It sounds straightforward, but in practice, it sits at the intersection of instrument physics, process chemistry, control system architecture, and regulatory requirements. A refinery running a Coriolis meter on a custody transfer line and a municipal water authority tracking distribution flow through electromagnetic meters are both doing “flow monitoring” — but the accuracy, integration depth, and compliance demands of those two applications are worlds apart.
The Pain Points That Keep Engineers Up at Night
For OEM skid-mount manufacturers, the challenge is delivering a pre-assembled package that integrates seamlessly with a customer’s existing DCS, even when that DCS specification arrives two weeks before the factory acceptance test. For EPC project teams, the pressure is hitting commissioning milestones on a schedule that was set optimistically eighteen months ago, with a control system that may span five different vendor platforms. For instrument distributors, the pain is a customer who purchased the wrong meter technology for a dirty slurry application and is now calling for warranty support.
These are not abstract risks. According to analysis of industry maintenance records, measurement inaccuracies and poor integration practices account for 35–45% of process control deviations in continuous manufacturing environments. Data silos — where field instruments report to one platform, a historian to another, and an enterprise ERP to a third with no automated handshake between them — mean that operators make decisions based on data that is already 15 minutes old. In a fast-responding chemical reaction loop, 15 minutes of measurement lag is not a nuisance: it is a batch failure.
The Role of EPCs and System Integrators
EPC firms and system integrators are the parties who determine whether a flow monitoring system is a collection of individual instruments or a coherent, integrated measurement architecture. The decision made at the FEED (Front End Engineering Design) stage — which technology, which protocol, which topology — echoes through twenty years of plant operation. Choosing a flow measurement philosophy early, standardizing on it, and designing the integration framework before the first instrument is ordered is the single most impactful cost-reduction lever available to EPC teams.
The global flow meters market is projected to grow from USD 12.14 billion in 2026 to USD 19.46 billion by 2034 at a CAGR of 6.08% (Fortune Business Insights). That growth is driven not by the need to measure more flow, but by the need to measure it more precisely, integrate it more deeply, and extract more intelligence from it. The strategies in this guide are designed for the engineering professionals, procurement managers, and system architects who are doing exactly that.
2. Strategic Selection of Flow Measurement Technologies

Selecting the right flow measurement technology is not a catalog exercise. It is an engineering decision with a 15-year cost tail. A meter that is cheap to purchase but requires calibration every six months, or that produces ±2% of full-scale accuracy when the process demands ±0.5% of reading, will cost far more than the purchase price difference over its installed life.
The Four Primary Technologies and When to Use Each
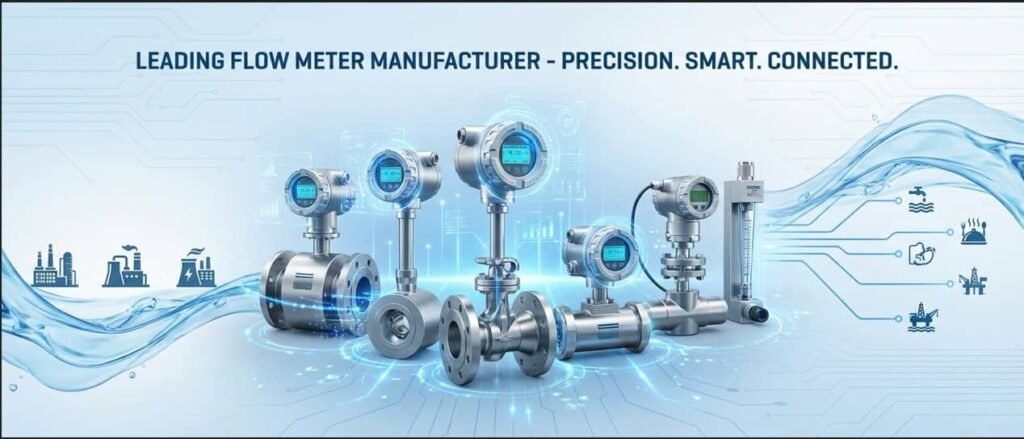
Coriolis Flow Meters measure mass flow directly by tracking the phase shift in vibrating flow tubes caused by the Coriolis effect — the same physical phenomenon that causes weather systems to spiral. Because the measurement is based on inertia rather than velocity inference, Coriolis meters provide truly direct mass flow without density compensation. They simultaneously report fluid density and temperature from a single instrument body. The global Coriolis meter market is projected to grow from USD 2.50 billion in 2025 to USD 4.79 billion by 2034 at a CAGR of 7.5% (TrendX Insights). Premium models achieve ±0.05% to ±0.1% of reading for liquids — accuracy that makes them the reference standard against which other technologies are verified.
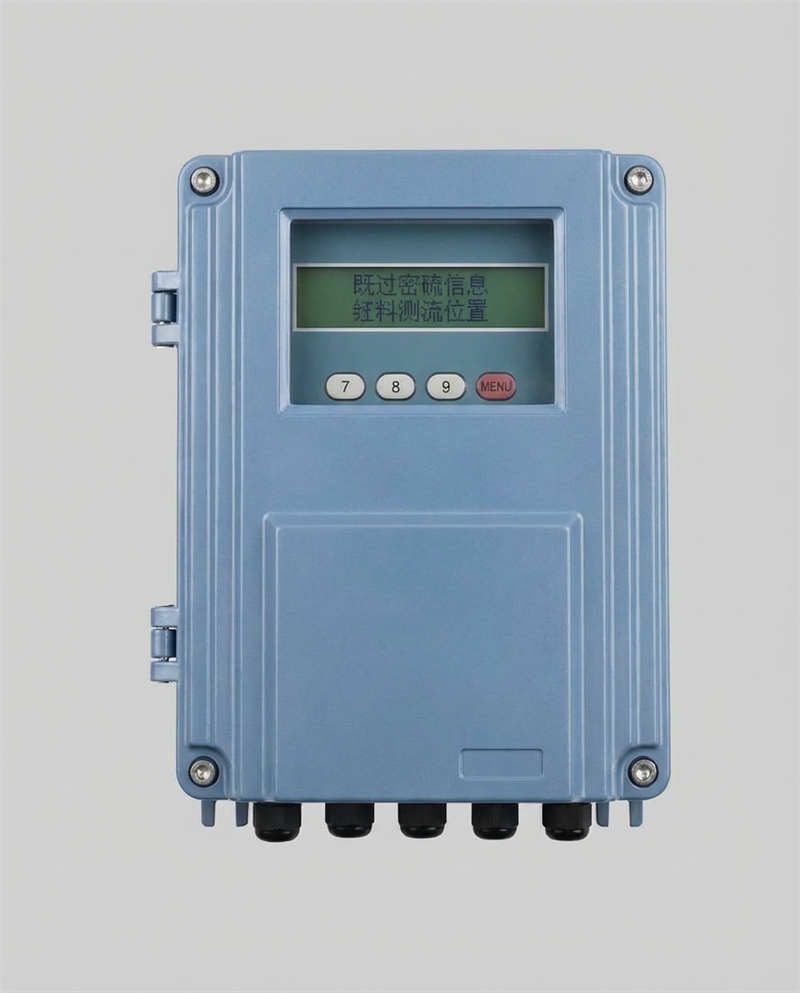
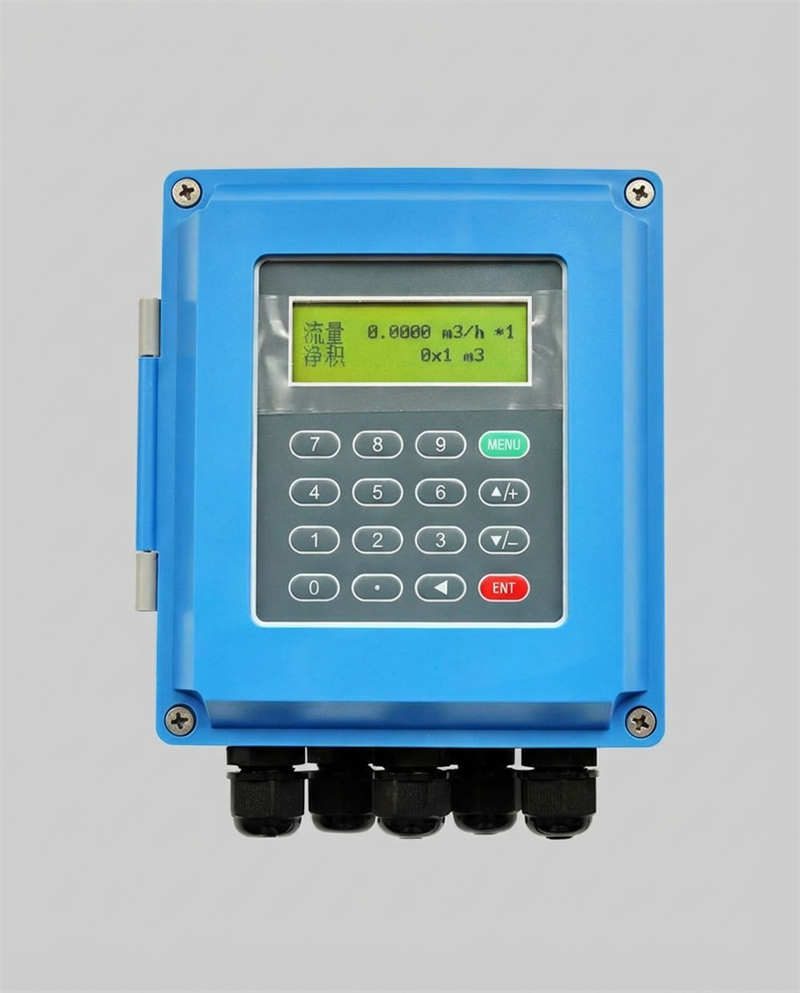
Ultrasonic Flow Meters measure flow by transmitting acoustic signals through the fluid and calculating velocity from transit-time differences (for clean liquids) or Doppler frequency shifts (for particle-laden fluids). They are non-intrusive in clamp-on configurations, create zero pressure drop, and work on large pipe diameters where Coriolis becomes impractical. Typical accuracy runs ±0.5% to ±1.5% of reading for transit-time designs on clean liquids. For large-diameter distribution mains in municipal water systems, multi-path ultrasonic meters are the standard of care.
Thermal Mass Flow Meters measure gas flow by detecting the heat transfer from a heated sensor element to the flowing gas stream. The higher the mass flow, the greater the heat removed. They provide direct mass flow measurement for clean, dry gases without requiring pressure or temperature compensation. Typical accuracy is ±1% to ±2% of reading, with cost significantly lower than Coriolis for gas-only applications. Common applications include compressed air systems, nitrogen blanket monitoring, and natural gas sub-metering.
Differential Pressure (DP) Flow Meters — including orifice plates, Venturi tubes, and V-cone designs — infer volumetric flow from the pressure difference across a constriction. They are the most widely installed technology globally by installed base, largely because they are well understood, inexpensive, and proven. However, they carry a 3:1 to 5:1 turndown ratio (versus 20:1 to 100:1 for Coriolis), significant permanent pressure loss, and accuracy that degrades sharply below 30% of full-scale flow. In 2026, DP meters remain the default for steam measurement and applications where fluid properties are stable and flow range is narrow.
Technology Selection Matrix
| Technology | Accuracy | Turndown | Pressure Drop | Fluid Types | Relative Cost | Best Application |
|---|---|---|---|---|---|---|
| Coriolis | ±0.05–0.1% | 100:1 | Moderate–High | Liquids, gases, slurries | Mass flow, custody transfer, batching, density measurement | |
| Ultrasonic (Transit-Time) | ±0.5–1.5% | 50:1 | Zero (clamp-on) | Clean liquids, gases | $ | Large-diameter pipes, retrofit, non-invasive monitoring |
| Thermal Mass | ±1–2% | 100:1 | Low | Clean, dry gases | $$ | Compressed air, N₂, CH₄, natural gas sub-metering |
| Differential Pressure (Orifice) | ±1–2% FS | 3:1–5:1 | High | Liquids, gases, steam | $ | Steam, gas, stable-flow applications |
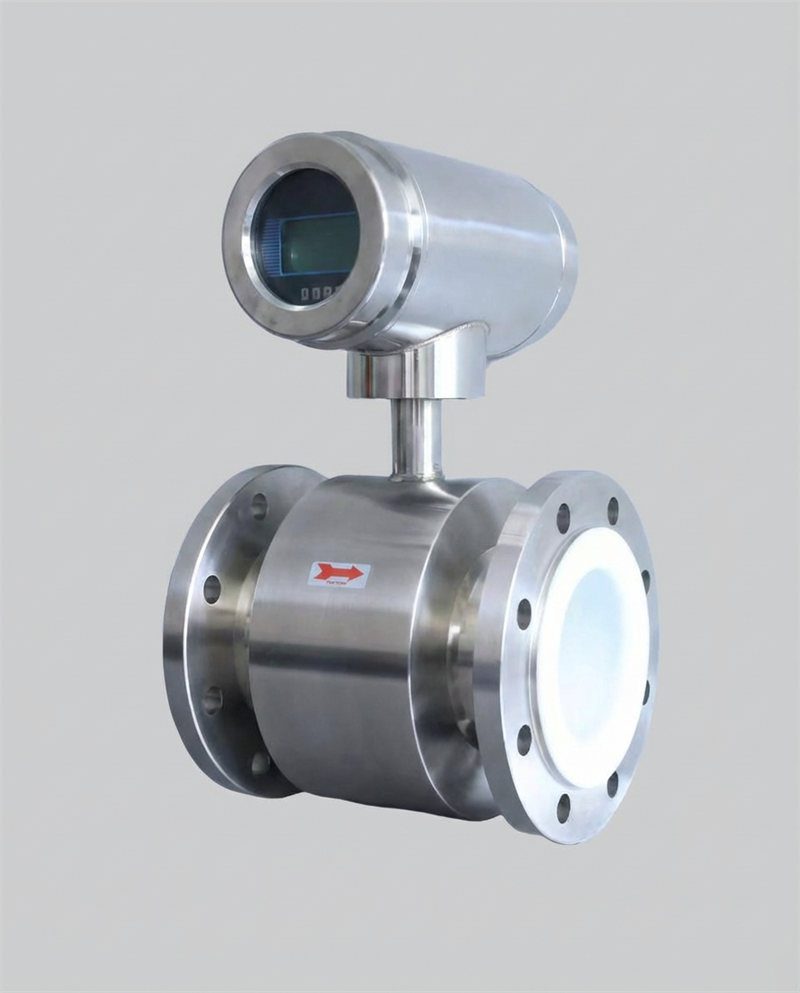
| Electromagnetic (Mag Meter) | ±0.2–0.5% | 30:1–100:1 | Zero | Conductive liquids only | $$ | Water, wastewater, chemicals, slurries |
| Vortex | ±0.5–1% | 20:1–40:1 | Low–Moderate | Liquids, gases, steam | $$ | Steam, clean liquids, gas above minimum velocity |
Data compiled from manufacturer specifications and industry references including Jade Ant Instruments: Coriolis Flow Meter Pros and Cons.
Case Insight: How OEM Skid Manufacturers Optimize Meter Selection
A Texas-based OEM building chemical injection skids for offshore platforms standardized its instrument philosophy across three skid configurations: low-pressure water injection (electromagnetic meters, ±0.3% accuracy, zero pressure drop), medium-pressure corrosion inhibitor injection (Coriolis meters, ±0.1% accuracy, mass-based dosing verification), and high-pressure methanol injection (Coriolis with PEEK wetted parts and ATEX Zone 1 certification). The result was a clearly documented, repeatable selection process that reduced engineering time per skid from 14 hours to 4 hours, eliminated specification errors that had previously caused two warranty replacements per quarter, and allowed procurement to negotiate volume pricing with a single preferred supplier — Jade Ant Instruments provides OEM/ODM support across Coriolis, electromagnetic, and vortex configurations with consistent dimensional and communication interfaces.
Matching Technology to Certification Requirements
For hazardous area installations — classified under ATEX (Europe), IECEx (international), or NEC Class I Division 1/2 (North America) — meter selection must include the hazardous area certification as a hard filter, not an afterthought. An instrument that technically measures the right thing but carries the wrong gas group or temperature class is non-compliant and unusable. EPC teams specifying instruments for offshore platforms, petroleum terminals, and chemical plants should establish the hazardous area classification map before the instrument list is generated, not after.
3. Integration of Smart Instrumentation and Field Devices

The word “smart” in smart instrumentation is not marketing language. It describes a specific technical capability: a field device that communicates not just its primary measurement variable but also diagnostic information, configuration data, and device status — all on the same physical wiring as the traditional 4–20 mA analog signal.
HART, Foundation Fieldbus, and Profibus: What Each Protocol Actually Delivers
HART (Highway Addressable Remote Transducer) overlays digital communication on top of the existing 4–20 mA signal wire. The process variable (flow rate) rides on the 4–20 mA loop as always. Simultaneously, HART digital signals carry secondary variables, diagnostic information, and configuration commands over the same wire at 1.2 kbps. For plants with existing 4–20 mA infrastructure, HART is the lowest-barrier path to smart instrumentation — you get diagnostics and multi-variable data without re-wiring. Approximately 35 million HART-enabled devices are installed globally, making it the most widely deployed smart instrument protocol in process industries.
Foundation Fieldbus (FF) is a fully digital, bidirectional protocol that replaces the 4–20 mA signal entirely. Multiple instruments share a single cable segment, each with its own node address, and execute control function blocks in the device itself rather than in the DCS. The reduction in wiring is significant: a typical H1 segment connects up to 16 devices on a single twisted pair, replacing up to 16 individual instrument cables. Industry practitioners on the Control.com forums consistently report that FF delivers a “huge reduction” in startup and commissioning time as its single greatest operational benefit — with estimates of 30–50% commissioning time reduction versus conventional 4–20 mA wiring documented in large petrochemical projects.
Profibus PA uses the same physical layer as Foundation Fieldbus but follows the Profibus protocol stack — the dominant standard in European and Asian process plants where Siemens-based DCS platforms are common. It connects field devices to a Profibus DP master through a segment coupler and supports device profiles that standardize communication regardless of manufacturer. For EPC firms delivering projects with Siemens PCS 7 or similar DCS infrastructure, Profibus PA instruments are typically the default specification.
Smart Transmitters and Commissioning Efficiency
A conventional 4–20 mA flow transmitter tells you one thing: the current flow rate. A smart transmitter tells you the flow rate, the transmitter temperature, the electronics status, the empty-pipe detection status, the electrode coating index (for mag meters), the sensor health score, and the last five configuration change events — all accessible remotely from the DCS engineering workstation or a handheld HART communicator.
For EPC commissioning teams, this translates to a concrete time saving. In a conventional instrument loop, verifying that a transmitter is correctly configured, calibrated, and communicating requires a technician at the field device and an engineer at the DCS workstation communicating by radio. With HART or Foundation Fieldbus, the DCS or asset management software reads the device description (DD) file, auto-populates the tag configuration, and flags any discrepancy between the ordered range and the installed range. This alone eliminates a category of commissioning defects that historically account for 15–20% of loop check failures on large EPC projects.
Best Practices for Plug-and-Play Integration in Modular Skid Systems
Modular skid systems — self-contained process packages that arrive at site pre-wired, pre-plumbed, and pre-tested — realize their full value only when the control system interface is equally modular. The instrument specification should include not just the physical meter but the complete interface definition: tag number format, engineering unit conventions, alarm setpoints, and the DCS function block or SCADA tag template that will receive the signal.
For OEM skid builders, pre-loading HART device descriptions and tested I/O assignments into a portable marshaling cabinet allows the receiving EPC integrator to connect the skid to the plant DCS in hours rather than days. Jade Ant Instruments supports this workflow by providing device description files, calibration certificates, and configuration records as part of the standard instrument delivery package.
4. Data Harmonization Across Control and Monitoring Platforms
Data fragmentation is one of the most expensive invisible problems in industrial process management. A plant may have a DCS collecting real-time flow data at one-second intervals, a historian archiving trend data at one-minute intervals, a maintenance management system tracking calibration records, and an ERP system doing product accounting — and all four are operating from different, non-synchronized data sources. The result is that when a batch is out of spec, no one can definitively say whether the problem was the flow meter, the control valve, or the operator setpoint change at 2:47 AM.
Breaking Data Silos with OPC UA and MQTT
OPC UA (Unified Architecture) is an open, platform-independent communication standard developed by the OPC Foundation that defines not just how data is transmitted but what it means — the data model, the security model, and the service model are all specified. An OPC UA server running on a SCADA platform can expose flow data, alarm states, historical trends, and device diagnostics to any authorized OPC UA client — whether that is a cloud analytics platform, an ERP system, or a mobile maintenance tablet — without custom integration code.
According to Endress+Hauser’s IIoT guidance, OPC UA “enables interoperability across platforms while ensuring security and scalability” and is “widely regarded as a key standard” for industrial IoT integration. For EPC system integrators, specifying OPC UA as the standard data transport layer between the SCADA tier and enterprise systems eliminates the custom middleware development that has historically consumed 20–30% of system integration budget on large projects.
MQTT (Message Queuing Telemetry Transport) complements OPC UA for edge-to-cloud communication. Where OPC UA defines a rich information model suitable for plant-level integration, MQTT provides a lightweight, low-bandwidth publish-subscribe mechanism that is ideal for transmitting flow data from remote assets — pipeline monitoring stations, distributed water meters, offshore production platforms — to central cloud platforms over cellular or satellite networks. The combination of OPC UA at the plant level and MQTT at the edge-to-cloud level creates a coherent, end-to-end data architecture that eliminates the protocol translation layers that typically introduce latency and data loss.
From Field to Enterprise: A Practical Data Flow
A practical unified data architecture for a process plant looks like this: field instruments communicate via HART, Foundation Fieldbus, or Profibus PA to a DCS or PLC. The DCS publishes real-time data via OPC UA to a plant historian and a SCADA visualization platform. The historian feeds a cloud analytics platform via MQTT or a REST API. The cloud platform feeds dashboards for operations, maintenance alerts for the MRO team, and production reports for the ERP system. Every layer is connected, every data point has a single source of truth, and the time from a field event to an operator notification is measured in seconds rather than shifts.
For system integrators delivering this architecture, the key discipline is data governance: defining tag naming conventions, engineering unit standards, timestamp synchronization, and access control policies before the first instrument is connected. These decisions, made once at the start of a project, determine whether the system is maintainable and auditable for its entire operational life.
5. Automated Control Loops for Dynamic Flow Regulation
PID Control: The Foundation of Flow Regulation
PID control — Proportional, Integral, Derivative — is the algorithm that most industrial control loops use to maintain a process variable at a desired setpoint. In flow control, the PID controller receives the measured flow rate from the flow meter, compares it to the setpoint, and adjusts a control valve or pump speed to close the error. The “proportional” term provides an immediate correction proportional to the error size. The “integral” term eliminates residual steady-state error by accumulating the error over time. The “derivative” term dampens overshoot by anticipating the rate of change.
A well-tuned PID flow control loop on a properly sized control valve can maintain flow within ±0.5–1% of setpoint under steady conditions. The key word is “well-tuned.” A PID loop with incorrectly sized gains will oscillate, overshoot, or respond sluggishly — and in a batch dosing application, any of these behaviors means off-spec product. The accuracy of the flow meter feeding the loop directly determines the minimum achievable control band: a meter with ±2% accuracy cannot support a control loop that needs to hold ±0.5%.
Model-Based Control for Complex Systems
For processes with multiple interacting flow streams — blending systems, heat exchanger networks, water distribution pressure zones — PID control alone may not be sufficient. Model Predictive Control (MPC) uses a mathematical model of the process to predict the effect of control actions over a future time horizon and select the sequence of valve and pump adjustments that minimizes deviation from target while respecting operating constraints. MPC is computationally intensive but delivers measurable improvements in processes where single-variable PID control produces unacceptable interaction between control loops.
The quality of an MPC model depends directly on the quality of the flow measurement feeding it. A Coriolis meter providing direct mass flow with ±0.1% accuracy gives the MPC model a much more reliable data foundation than an inferred mass flow calculated from a volumetric flow meter with a separately measured density — particularly when fluid density varies with temperature or composition over the course of a production run.
Real-World Example: Utility Water Loss Reduction Through Automated Flow Balancing
A mid-sized municipal water utility in Southeast Asia was experiencing non-revenue water (NRW) losses — the volume of treated water entering the distribution network that never reaches a paying customer — of approximately 28%. Industry benchmarks suggest that NRW above 20% indicates significant leakage or metering inaccuracy. The utility installed electromagnetic flow meters at 47 district meter area (DMA) boundaries and connected them to a SCADA system with automated pressure-flow balancing algorithms.
Within six months, the analytics identified three pressure zones where inlet flow consistently exceeded the sum of downstream sub-meter readings by 8–12%, pinpointing zones of active leakage. Pressure management algorithms automatically reduced inlet pressure during low-demand overnight periods, reducing leakage rates by approximately 40% in the identified zones. NRW dropped from 28% to 19% in the first year of operation — equivalent to recovering approximately 450,000 m³ of treated water annually that had previously been lost. At local production cost of $0.35/m³, the annual financial benefit was approximately $157,500 — from an instrumentation investment of approximately $180,000, yielding a payback period under 14 months.
6. Predictive Analytics and AI-Driven Performance Monitoring

Industrial plants generate enormous volumes of flow data that historically went unanalyzed. A flow meter sampling at one-second intervals generates 86,400 data points per day. Across a plant with 200 flow measurement points, that is 17.28 million data points per day. No human operator reviews 17 million numbers per day. But a machine learning model can — and when it does, it finds patterns that predict failures weeks before they manifest as process deviations or instrument failures.
From Reactive to Predictive: The MRO Opportunity
The traditional maintenance model for flow instrumentation is reactive maintenance: the meter fails, production stops, a technician is dispatched, the meter is replaced or repaired, and production resumes. The total cost of a single reactive maintenance event — including emergency labor premium, express parts shipping, lost production, and rescheduling costs — typically runs $5,000 to $50,000 depending on the criticality of the affected flow loop.
IBM Research documents that AI-driven predictive maintenance solutions deliver a 47% reduction in unplanned downtime events (IBM: The Role of AI in Predictive Maintenance). McKinsey research quantifies the maintenance cost reduction at 10–40%, with downtime reduction up to 50%. For an MRO team managing a plant with 50 critical flow measurement points, shifting even half of those from reactive to predictive maintenance represents a measurable budget improvement — one that can be presented to plant management as a documented ROI rather than a technology aspiration.
What Machine Learning Models Actually Detect in Flow Data
The specific failure patterns that machine learning models identify in flow meter data streams include the following:
Sensor drift — a gradual change in the meter’s zero or span calibration, typically caused by temperature cycling, coating buildup on electrode surfaces, or mechanical stress on Coriolis tube geometry. Drift appears as a slow trend in the meter’s output under constant process conditions. A model trained on historical stable-flow periods can detect drift as small as 0.2% of span over a 30-day window — far earlier than a human operator reviewing daily trend plots would notice.
Electrode coating (for electromagnetic meters) — the coating index built into modern mag meter transmitters tracks the electrical impedance of the measurement electrodes. Rising impedance indicates coating buildup from hard scale, biological growth, or chemical precipitation. A model correlating coating index trends with process temperature and chemical composition can predict when coating will degrade accuracy to outside the specification band, enabling a scheduled cleaning intervention rather than an emergency shutdown.
Coriolis tube entrained gas detection — sudden increases in measurement noise, coupled with changes in tube drive gain and density reading, indicate gas entrainment. A model trained to distinguish normal start-up transients from sustained entrainment events can trigger an operator alert before the entrained gas causes the meter to generate false high-flow readings that propagate to batch totals.
Enabling the AI Model: Data Infrastructure Requirements
Machine learning models are only as good as the data fed into them. For flow monitoring applications, the minimum data infrastructure requirements are: consistent timestamp synchronization across all instruments (to within ±1 second), high-resolution data archiving (one-second or better for critical loops), metadata tagging that associates each data point with instrument tag, engineering unit, and calibration status, and a mechanism for labeling known fault events in historical data to train supervised learning models.
For MRO teams and system integrators, the practical starting point is not a complex ML deployment but a systematic review of existing HART diagnostic data. Most plants with smart transmitters installed are not reading the diagnostic data those instruments already generate. Starting with HART diagnostic trending — monitoring electrode coating index, drive gain, empty-pipe detection frequency, and zero-point stability — costs nothing in new infrastructure and can surface actionable insights from instruments that are already installed and reporting.
7. Cybersecurity and Data Integrity in Flow Monitoring Systems
Flow monitoring systems that communicate over digital networks are cybersecurity assets as much as process assets. An adversary who can manipulate flow measurement data — substituting false readings, triggering false alarms, or disabling transmitters — can disrupt production, cause environmental releases, or compromise public safety in water and gas distribution networks. This is not theoretical: documented attacks on industrial control systems, including the 2021 Oldsmar water treatment facility incident, demonstrate that operational technology (OT) networks are actively targeted.
ISA/IEC 62443: The Standard That Matters
ISA/IEC 62443 is the international standard series for cybersecurity in industrial automation and control systems (IACS). It defines security levels (SL 1 through SL 4) for zones and conduits within an industrial network, specifies requirements for device suppliers, system integrators, and asset owners, and provides a structured framework for cybersecurity risk assessment and management. For EPC system integrators and OEM skid builders, ISA/IEC 62443 compliance is increasingly required by contract — particularly for clients in oil and gas, water utility, pharmaceutical, and power generation sectors.
The foundational concept in ISA/IEC 62443 is network segmentation through zones and conduits. A “zone” is a grouping of assets with similar security requirements and trust levels. A “conduit” is the communication channel between zones. By placing field instruments, the DCS, the historian, and the enterprise network in separate zones with controlled, monitored conduits between them, the standard limits the blast radius of a breach: an adversary who compromises the historian zone cannot directly access the DCS zone without passing through a defined, auditable conduit.
According to Cisco’s ISA/IEC 62443-3-3 guidance, “network segmentation is an efficient way to reduce the exposure of the control system to cyberthreats and limit the spread of attacks.” For municipalities and utilities — where a flow monitoring system might be managing drinking water chemistry or flood control infrastructure — the reputational and public safety consequences of a cybersecurity failure are severe enough that ISA/IEC 62443 compliance should be treated as a baseline requirement, not a premium option.
Practical Measures for System Integrators
For EPC teams and system integrators delivering flow monitoring systems, the following measures address the majority of OT cybersecurity risk: encrypting all communications between the field network and SCADA using TLS 1.3 or equivalent; implementing role-based access control (RBAC) so that operators can read and acknowledge alarms but cannot modify calibration parameters without elevated credentials; maintaining an asset inventory that includes firmware versions for every connected field device; and establishing a patch management process that validates OT-compatible security updates before deployment in production environments.
For flow meter distributors supplying instruments to utilities and critical infrastructure, the ability to provide instruments with documented firmware version history, security vulnerability disclosures, and known secure configuration guidance is becoming a competitive differentiator in tender evaluation — not just a compliance checkbox.
8. Scalable System Architecture for Modular and Phased Projects
Designing for Replication, Not Just for Delivery
OEM skid manufacturers face a structural economic challenge: each new skid order should be easier and cheaper to deliver than the previous one, because the design is proven and the production process is refined. In practice, if each skid is engineered from scratch, the opposite happens — every unique meter specification, every custom I/O assignment, and every one-off communication protocol requires design work that erodes margin.
Modular I/O — particularly marshaling cabinet designs that use standardized signal cards with universal input configuration — allows an OEM to receive any combination of HART, 4–20 mA, pulse, and Modbus instruments from the field and connect them to a PLC or DCS without custom wiring design for each project. The wiring topology is fixed; only the configuration changes. This approach reduces wiring design time by 60–80% versus a bespoke design for each project.
Containerized software — deploying SCADA, historian, and OPC UA server functions as Docker containers on standard industrial PCs — allows the system integrator to version-control the entire software configuration of a skid’s control system and deploy it reproducibly on any compatible hardware. When the OEM wins a repeat order for the same skid design, the software image is instantiated, the tag names are updated for the specific project, and commissioning begins from a verified baseline rather than from scratch.
Supporting Phased EPC Commissioning
Large capital projects rarely commission all process systems simultaneously. An oil terminal expansion, a water treatment plant upgrade, or a pharmaceutical manufacturing facility addition will bring individual trains or systems online in sequence over six to eighteen months. Flow monitoring systems that are designed for phased commissioning — where the DCS is live and receiving data from Phase 1 instruments while Phase 2 wiring is still being installed — require careful attention to I/O reservation, tag database management, and alarm rationalization.
The practical solution is to build the full project tag database from the instrument index at the start of the project, with all tags in “inhibited” status until the physical instrument is commissioned. As each system is handed over, tags are enabled and alarm setpoints are activated. This approach allows the SCADA operator interface to show the complete plant picture from day one of system startup, with clearly differentiated active and pending instrument points.
For instrument distributors serving EPC clients, aligning delivery schedules to the phased commissioning sequence — rather than delivering all instruments on one purchase order eight months before they are needed — reduces the client’s temporary storage requirements, reduces the risk of damage during on-site storage, and reduces the distributor’s exposure to order changes when instrument specifications change between FEED and detailed design.
9. Compliance, Calibration, and Audit Readiness
The Cost of Non-Compliance
In industries where flow measurement has regulatory significance — water treatment, pharmaceutical manufacturing, custody transfer of hydrocarbons, environmental discharge monitoring — non-compliance with calibration and documentation requirements is not a paperwork problem. It carries financial penalties, production stops, and in the most serious cases, product recalls or license revocations.
A water utility that cannot demonstrate NIST-traceable calibration records for its chemical dosing meters may face violations under EPA’s National Primary Drinking Water Regulations. A pharmaceutical manufacturer whose batch release documentation lacks complete flow meter calibration traceability faces FDA 21 CFR Part 11 compliance risk. An oil terminal without audit-compliant custody transfer records faces potential disputes over $50,000+ per delivery. In each case, the instrument is not the issue — the missing documentation is.
Automating Calibration Management
Manual calibration management — a spreadsheet of due dates, a filing cabinet of paper certificates, a technician with a reminder in their calendar — creates gaps. Certificates get misfiled. Due dates get missed during busy project periods. Calibration records reference the wrong instrument tag when a meter is replaced but the tag is reused. These gaps are invisible until an auditor finds them.
Automated calibration management software connected to the plant’s asset management system eliminates these gaps by treating calibration as a scheduled workflow with mandatory completion verification. The system generates calibration work orders at the correct interval (based on instrument criticality, service history, and regulatory requirement), tracks work order completion, stores digital calibration certificates against the instrument tag, and generates compliance reports on demand. Integration with the DCS allows the system to flag instruments whose calibration is overdue and automatically inhibit their participation in custody transfer calculations until recalibration is confirmed.
Digital Twins for Virtual Validation
A digital twin — a virtual model of a physical instrument or process system, updated with real-time process data — enables a form of continuous validation that would be impractical with physical testing alone. For flow measurement systems, a digital twin model of a Coriolis meter can simulate the expected response of the instrument under current process conditions (temperature, pressure, fluid density) and compare it to the actual measurement output. Divergence between the model prediction and actual output is an early indicator of instrument drift or process upset — before the deviation has grown large enough to affect product quality or regulatory compliance.
According to Tractian’s digital twin analysis, digital twins are a “virtual replica of a physical asset updated with real-time data,” and divergence between model and reality is an actionable diagnostic signal. For EPC firms delivering plants with ISO 9001 quality management requirements, incorporating digital twin validation into the design basis — with documented model assumptions, acceptance criteria, and periodic reconciliation protocols — strengthens the plant’s audit readiness without adding significant ongoing operational cost.
10. Collaborative Engineering: Aligning OEMs, Distributors, and EPCs

The most preventable cost in flow monitoring system delivery is rework driven by misalignment between the parties who specify instruments, the parties who supply them, and the parties who integrate them into the plant control system. An instrument specification that does not define the communication protocol leaves the supplier to assume Modbus when the DCS requires HART. A skid delivered with instruments tagged to the OEM’s internal numbering system requires retag on site when the EPC’s tag convention is different. A calibration certificate referencing the OEM’s factory test conditions is meaningless when the regulatory requirement specifies site calibration in the actual process fluid.
Early Engagement: The FEED-Stage Advantage
System integrators who engage with instrument suppliers and OEM skid builders during the Front End Engineering Design (FEED) stage — before detailed design begins — capture benefits that are quantifiably larger than those available at any later stage of a project. At FEED stage, instrument specifications can be aligned with the preferred supplier’s standard product range, avoiding the customization costs that arise when specifications are written to match a competitor’s offering. Communication protocol decisions can be made with full awareness of DCS vendor capabilities, avoiding the fieldbus compatibility issues that derail commissioning on an average of one in four large EPC projects.
The financial value of FEED-stage alignment is well-documented: industry research consistently finds that changes made during FEED cost 1/100th to 1/1000th of the same change made during construction. For a project with a $50 million instrumentation and controls scope, even a 1% reduction in rework cost through better front-end alignment represents $500,000 in direct savings.
Standardizing Across the Supply Chain
For instrument distributors serving multiple OEM and EPC clients, the most powerful service offering is a standardized instrument data package — a bundle of documentation that travels with every instrument shipment and contains everything the receiving party needs to integrate the instrument without additional communication: dimensional datasheet with connection details, calibration certificate with NIST reference, device description (DD) file for HART/Foundation Fieldbus, configuration record showing factory-set parameters, and a site commissioning checklist.
Distributors who provide this package consistently report fewer post-delivery questions, faster commissioning sign-off, and stronger repeat-order relationships with EPC and OEM clients. The package costs the distributor approximately $15–25 per instrument to compile (primarily labor time for document assembly), and it routinely prevents $500–$2,000 per instrument in field troubleshooting costs for the client.
Jade Ant Instruments supports distributor partners and OEM clients with comprehensive instrument data packages as standard, including OEM/ODM customization for clients who require private-label documentation or application-specific calibration conditions. For distributors and EPCs building collaborative supply chain frameworks, starting the conversation with the flow meter manufacturer comparison guide provides a structured basis for supplier qualification that goes beyond price comparison.
Watch: How Flow Rate Mass Monitoring Systems Are Integrated in Industrial Plants
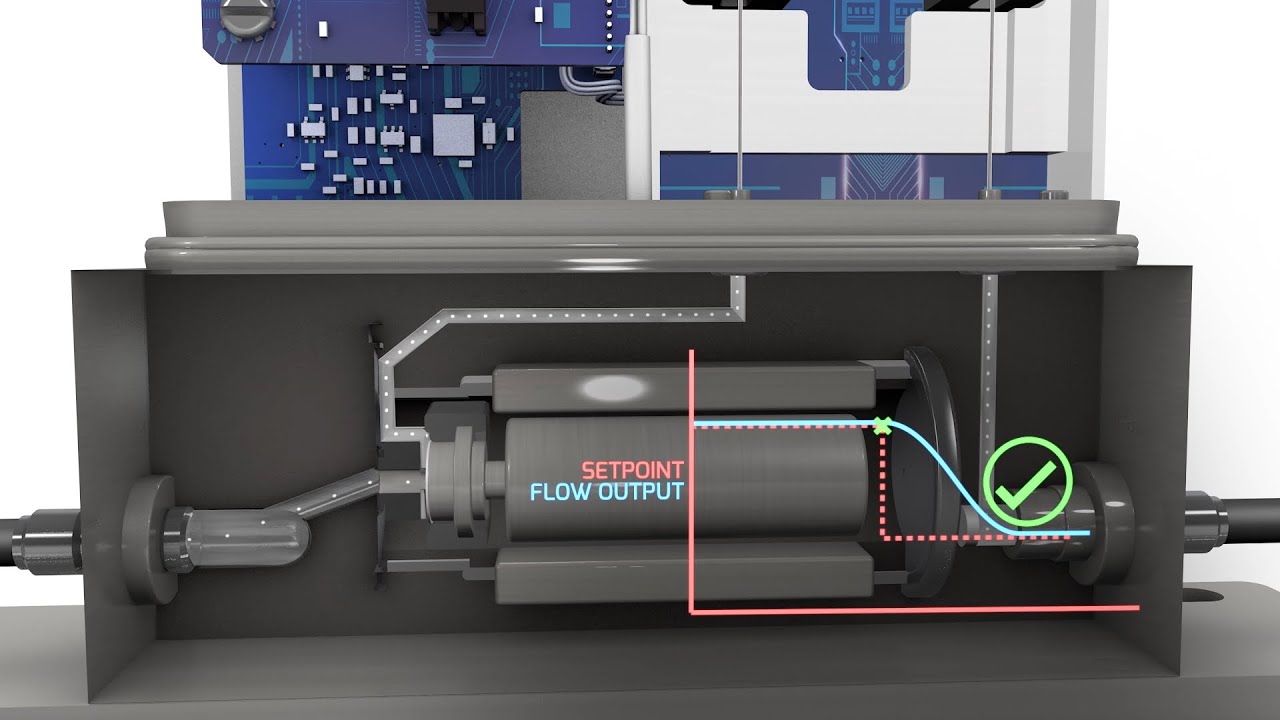
▶ Watch on YouTube: Coriolis Mass Flow Meter — Principle of Operation (Brooks Instrument) — a technical explanation of how Coriolis meters measure mass flow directly, covering the Coriolis effect, phase shift detection, and density measurement from a single instrument body. Essential context for EPC and OEM engineers specifying mass flow instrumentation.
Glossary of Key Technical Terms
Mass Flow Rate: The mass of fluid passing a measurement point per unit of time, expressed in kg/s, kg/hr, or lb/min. Unlike volumetric flow, mass flow is unaffected by changes in fluid temperature, pressure, or density — making it the preferred measurement for custody transfer, batching, and any application where the economic or quality value of the fluid is based on mass rather than volume.
Coriolis Effect: The physical phenomenon in which a mass moving in a rotating or vibrating reference frame experiences an apparent force perpendicular to its direction of motion. In a Coriolis flow meter, this effect causes a phase shift in the vibrating tube that is proportional to the mass flow rate.
PID Control (Proportional-Integral-Derivative): A control algorithm that calculates a corrective output based on three terms: the current error (proportional), the accumulated past error (integral), and the predicted future error (derivative). Used in virtually all industrial flow control loops.
HART Protocol: Highway Addressable Remote Transducer — a communication standard that overlays digital data on a 4–20 mA analog signal, allowing smart transmitters to communicate diagnostic and configuration data without additional wiring.
Foundation Fieldbus: A fully digital, bidirectional communication protocol for field instruments that replaces analog 4–20 mA wiring, enables multi-drop device connections, and distributes control function blocks to field devices.
OPC UA (Unified Architecture): An open, platform-independent standard for industrial data communication that defines both the transport mechanism and the data model, enabling interoperable, secure data exchange between process control systems and enterprise applications.
MQTT: Message Queuing Telemetry Transport — a lightweight, publish-subscribe messaging protocol designed for constrained networks and remote device communication, widely used for edge-to-cloud data transmission in IIoT applications.
ISA/IEC 62443: The international standards series for cybersecurity in industrial automation and control systems, defining security levels, zone and conduit architecture, and requirements for device suppliers, system integrators, and asset owners.
Digital Twin: A virtual model of a physical asset that is continuously updated with real-time operational data, enabling performance prediction, anomaly detection, and virtual validation without interrupting physical operations.
Non-Revenue Water (NRW): The volume of water that enters a distribution system but is not billed to customers, due to physical losses (leakage), commercial losses (meter inaccuracies, unauthorized use), or unbilled authorized consumption. Industry benchmark: NRW below 10% is considered excellent; above 25% indicates significant infrastructure issues.
ATEX/IECEx: European (ATEX) and international (IECEx) certification frameworks for electrical equipment designed for use in potentially explosive atmospheres, where flammable gas, vapor, mist, or combustible dust may be present.
Frequently Asked Questions (FAQs)
1. What is the most accurate technology for mass flow measurement in multiphase fluids?
For the majority of industrial multiphase applications, Coriolis flow meters remain the primary recommendation for direct mass flow accuracy, delivering ±0.05–0.1% of reading on clean single-phase liquids. However, multiphase flow — particularly gas-liquid mixtures — presents a genuine challenge for Coriolis meters: entrained gas causes tube dampening, increased drive gain, and density reading instability that can degrade accuracy significantly. For applications with persistent multiphase conditions (produced water with entrained gas, wet steam, slurries), the preferred approach is to eliminate the multiphase condition upstream through separation or degassing, or to use a hybrid measurement approach combining a Coriolis meter with an entrained-gas compensation model. Specialized multiphase flow meters designed for oil, gas, and water simultaneous measurement (common in upstream oil and gas production metering) exist but are high-cost, application-specific instruments rather than general-purpose flow meters. For guidance on Coriolis selection for challenging fluid conditions, see Jade Ant Instruments: Coriolis Flow Meter Pros and Cons.
2. How can EPC firms reduce integration time when incorporating flow meters into existing control systems?
The single most effective step is to standardize on OPC UA as the data transport layer between field devices and the plant SCADA or DCS, combined with pre-tested device description (DD) files for every instrument in the project’s standard instrument list. This eliminates the custom integration code that typically consumes 20–30% of system integration budget. Equally important is establishing instrument specification alignment with preferred suppliers during FEED — before detailed design freezes the instrument list — to avoid the specification exceptions and waiver processes that add weeks to commissioning timelines. For protocol comparison and integration planning resources, see Transmitter Shop: HART vs. PROFIBUS vs. Foundation Fieldbus Comparison.
3. What are the key considerations when selecting flow meters for hazardous environments?
Four factors are non-negotiable for hazardous area flow meter selection: (1) the correct ATEX/IECEx or NEC/FM gas group and temperature class for the specific classified zone, (2) the protection concept appropriate to the installation (intrinsic safety Ex ia for loop-powered devices, flameproof Ex d for enclosures with internal ignition sources), (3) entity parameter compatibility between the field device and the associated equipment in the safe area, and (4) a traceable hazardous area certification document that the local safety regulator will accept. A meter with an incorrect gas group — specifying Group IIA for a hydrogen service requiring Group IIC — is a safety deficiency, not a paperwork issue. Always verify hazardous area classification against the area classification drawing, not against a verbal description. For hazardous area installation guidance, consult ISA’s standards and publications on ISA/IEC 62443.
4. How do smart flow meters reduce maintenance costs for MRO teams?
Smart flow meters with HART or Foundation Fieldbus diagnostics report instrument health data continuously — electrode coating index, empty-pipe detection frequency, sensor temperature, zero-point stability, and electronics status — without requiring a technician to be at the instrument. An MRO team with access to these diagnostics through an asset management platform (such as Emerson’s AMS Suite or Endress+Hauser’s Netilion) can identify the 15% of instruments that are drifting or degrading and schedule interventions for those instruments specifically, rather than performing calendar-based maintenance on all 100% of the installed base. This targeted approach typically reduces total annual maintenance labor by 25–35% while improving fleet-wide measurement reliability. The shift from calendar-based to condition-based maintenance is the fundamental value proposition of smart instrumentation for MRO operations.
5. Can flow data be integrated into enterprise asset management (EAM) systems?
Yes. The standard integration path is: flow data from the field → SCADA or DCS historian → OPC UA server → middleware or API gateway → EAM platform (SAP PM, IBM Maximo, Oracle EAM). Most major EAM platforms support OPC UA client connectivity natively or through a supported integration module. Once connected, real-time flow data can trigger work orders in the EAM when flow-based health indicators exceed thresholds, calibration due-date alerts can be generated automatically from the instrument database, and maintenance history can be correlated with flow measurement performance trends for root-cause analysis. The middleware layer — typically a lightweight OPC UA-to-REST or OPC UA-to-SQL bridge — is where most integration projects spend the most engineering time, so standardizing on a proven integration platform early in the project lifecycle pays dividends throughout the asset’s life.
6. What are the benefits of Coriolis versus thermal mass flow meters?
The distinction is both technical and economic. Coriolis meters measure true mass flow through inertial forces, work on liquids, gases, and slurries, provide simultaneous density and temperature output, and achieve ±0.05–0.1% of reading accuracy — making them the choice for custody transfer, pharmaceutical dosing, custody-grade inventory tracking, and any application where fluid density varies significantly with process conditions. Thermal mass flow meters measure gas flow through heat transfer, work only on clean, dry gases, offer no density output, and achieve ±1–2% of reading accuracy — making them cost-effective for compressed air monitoring, nitrogen blanketing, and natural gas sub-metering where the gas composition and density are stable and known. The total installed cost difference is significant: a thermal mass meter for a 1″ compressed air line costs $800–$2,500 installed; a Coriolis meter for the same pipe size costs $4,500–$12,000 installed. For applications where that accuracy difference translates to a measurable process improvement, Coriolis is justified. For applications where ±2% is adequate and the fluid is a stable clean gas, thermal mass is the rational economic choice. For a detailed comparison, see Linc Energy Systems: Coriolis vs. Thermal Mass Flow Meters.
7. How can system integrators ensure long-term calibration accuracy across a plant?
Three practices, applied consistently, maintain calibration accuracy across a large installed base: (1) automated calibration management software that generates scheduled work orders, tracks completion, stores digital certificates, and generates compliance reports without manual intervention; (2) in-situ verification routines for smart instruments — zero checks, diagnostic health scoring, and cross-reference comparison between adjacent meters — that identify drift between formal calibration events without removing instruments from service; and (3) a calibration interval review process that adjusts intervals based on historical drift data. Instruments that consistently show zero drift over three calibration cycles can safely move to longer intervals, freeing calibration resources for instruments that show active drift trends. This risk-based calibration approach is consistent with ISO 9001 requirements for measurement system management and is increasingly required by major oil and gas operators as a condition of instrument approval.
8. Are there cybersecurity risks associated with networked flow monitoring systems?
Yes — and the risk is real, documented, and growing. The 2021 Oldsmar (Florida) water treatment incident, where an attacker remotely modified chemical dosing setpoints through a compromised remote access system, demonstrated that OT networks managing public infrastructure are actively targeted. The primary mitigations for networked flow monitoring systems are: network segmentation implementing ISA/IEC 62443 zones and conduits architecture, so that a breach of one zone cannot propagate to adjacent zones without passing through a monitored conduit; encrypted communications using TLS for SCADA-to-historian and historian-to-cloud data transport; role-based access control limiting who can modify instrument configurations, calibration parameters, and alarm setpoints; and regular vulnerability assessment of all connected devices, including firmware version audits for field instruments. For municipalities and utilities — where the consequences of a compromised flow monitoring system extend beyond financial loss to public health and safety — implementing ISA/IEC 62443 as a baseline design requirement is not optional.
9. How can OEM skid manufacturers future-proof their designs for evolving client needs?
Three architectural decisions made at design time determine whether a skid design can adapt to future client requirements or requires a complete redesign with each new order: (1) modular I/O with universal signal card configuration, allowing any combination of analog, digital, pulse, and fieldbus instruments without custom wiring design; (2) open communication standards (OPC UA, Modbus TCP, HART) rather than proprietary protocols that lock the skid to a specific DCS vendor; and (3) containerized software for the skid’s local HMI and data acquisition, allowing the software image to be version-controlled, updated, and deployed reproducibly across multiple units without re-engineering. OEM skid builders who invest in these three architectural elements consistently report that repeat orders for proven skid designs are delivered with 40–60% less engineering hours than the first-of-a-kind unit — a margin improvement that compounds with each successive order.
10. What role does flow data play in energy efficiency and sustainability reporting?
Precise mass flow measurement is the foundation of energy efficiency accounting. You cannot optimize what you cannot measure. For a manufacturing plant reporting Scope 1 (direct combustion) and Scope 3 (supply chain) emissions under frameworks such as the GHG Protocol, CDP, or EU Corporate Sustainability Reporting Directive (CSRD), the accuracy of fuel and feedstock flow measurement directly determines the accuracy of the emissions report. A 1% measurement error on a plant consuming 50,000 tonnes of natural gas per year produces a 500-tonne error in the reported carbon inventory — a discrepancy that external auditors will identify and that can affect carbon credit valuations, regulatory compliance status, and investor ESG ratings.
11. How can municipal water utilities detect and reduce non-revenue water using flow monitoring?
The most effective approach combines district meter area (DMA) deployment — installing electromagnetic or ultrasonic meters at every boundary of defined supply zones — with pressure-flow analytics that identify discrepancies between inlet flow and the sum of downstream metered consumption. Where inlet flow consistently exceeds downstream totals by more than the measurement uncertainty of the meters, the difference represents leakage, unauthorized consumption, or billing meter inaccuracy. High-resolution (one-second sampling) flow data enables minimum night flow analysis — measuring the lowest flow rate in a DMA during the early morning hours when legitimate demand is lowest — to quantify background leakage and identify zones where active leak detection surveys should be prioritized. The Badger Meter non-revenue water resource provides a practical overview of flow monitoring tools and analytics approaches used by utilities to tackle NRW.
12. Can flow monitoring systems support remote operations for distributed assets?
Yes, and this is one of the fastest-growing applications for cloud-connected flow monitoring. A pipeline company monitoring 400 km of gathering infrastructure, a water utility managing 120 remote pump stations, or an oil company operating unmanned production platforms all need to collect, visualize, and act on flow data without having an operator physically present at each asset. The enabling technology architecture combines edge computing at the remote site (an industrial gateway that preprocesses and buffers data locally, ensuring continuity during communication outages) with MQTT-based data transmission over cellular or satellite to a cloud platform, and a cloud dashboard and alarm management system that routes notifications to the appropriate on-call operator. Latency for this architecture is typically 5–15 seconds from field event to cloud notification — sufficient for all but the most time-critical control applications. For control applications requiring sub-second response, the control loop runs locally at the edge, and the cloud platform receives telemetry rather than issuing control commands.
13. What are the common pitfalls in flow meter installation that affect accuracy?
The five installation errors that account for the majority of accuracy-related commissioning failures are: (1) insufficient straight-run piping upstream of the meter — most meters require 5D to 20D of unobstructed straight pipe to ensure a developed, non-swirling flow profile reaches the sensing element; (2) inadequate grounding — particularly for electromagnetic flow meters on non-metallic pipes, where grounding rings are required to establish the reference potential for the measurement signal; (3) incorrect orientation for meters sensitive to gas entrainment or solids settling — Coriolis meters in liquid service should typically be installed with flow upward to ensure the tubes remain liquid-filled; (4) installation near vibration sources — pumps, compressors, and rotating machinery create mechanical vibration that interferes with Coriolis tube frequency and ultrasonic signal quality; and (5) installation in two-phase flow — partial pipe filling, slug flow, or entrained gas destroys the accuracy of most flow measurement technologies. All five pitfalls are addressable during the engineering phase if installation requirements are reviewed against the specific site conditions before piping design is frozen. For detailed installation guidance, see Jade Ant Instruments: Flow Meter Installation Best Practices Guide.
14. How do you handle custody transfer applications requiring regulatory approval?
Custody transfer flow measurement — where the meter reading is the basis for a financial transaction between two parties, or for regulatory reporting of quantities delivered or received — requires a level of accuracy, traceability, and documentation that exceeds general process measurement. The standard requirements are: (1) a certified meter with a type-approval or pattern approval from a recognized metrology authority (OIML, NIST, or national metrology institute) confirming the meter design meets the accuracy requirements of the applicable standard (API MPMS, ISO 17089, OIML R 49); (2) NIST-traceable calibration of the specific installed meter, performed at conditions as close as possible to the actual operating conditions; (3) sealed configuration preventing unauthorized modification of calibration parameters; (4) audit-compliant data logging with time-stamped, tamper-evident records of all measurement data and configuration events; and (5) periodic proving — comparing the installed meter against a certified portable prover or master meter at defined intervals to verify ongoing accuracy. For critical custody transfer installations, redundant metering runs with automatic statistical comparison between runs provide an additional layer of integrity assurance.
15. Is it possible to retrofit legacy systems with modern flow monitoring capabilities?
Yes, and the technology landscape for retrofit has improved dramatically over the past five years. Clamp-on ultrasonic flow meters — installed on the outside of existing pipe without cutting or process shutdown — are the most straightforward retrofit option for liquid monitoring, providing ±0.5–1.5% accuracy without any modification to the existing piping. For legacy instruments with 4–20 mA analog outputs, HART multiplexers enable asset management software to read HART diagnostic data from instruments that were previously only providing analog signals. Wireless adapters compliant with WirelessHART (IEC 62591) or ISA100.11a convert field instruments from wired to wireless communication, enabling remote monitoring of assets in locations where running new cable is impractical. Protocol converters and edge gateways bridge Modbus, Profibus, and other legacy protocols to OPC UA, enabling existing DCS data to flow into modern cloud analytics platforms without replacing the DCS. For most retrofit projects, the combination of clamp-on metering, HART multiplexing, and an OPC UA gateway provides 80% of the functionality of a greenfield smart instrumentation design at 20–30% of the cost.
This guide is intended for engineering professionals, system integrators, and industrial decision-makers who need practical, data-backed strategies for flow rate mass monitoring — not a theoretical overview. Every recommendation is grounded in real project experience and documented industry data.
For tailored guidance on Coriolis, electromagnetic, vortex, and ultrasonic flow meter selection and integration for your specific application, visit Jade Ant Instruments or consult the flow meter selection guide for choosing the right meter.